
 ?Mathematical formulae have been encoded as MathML and are displayed in this HTML version using MathJax in order to improve their display. Uncheck the box to turn MathJax off. This feature requires Javascript. Click on a formula to zoom.
Abstract
Knowledge of the optical properties of soot black carbon (BC) is required for the prediction of the radiative effects of freshly-emitted and aged BC particles. Here we review BC mass absorption cross section (MAC) and absorption function E(m) measurements, focusing on freshly-emitted BC. First, we review recently reported MACs at 550 nm wavelength as obtained from direct measurements of particulate absorption and mass concentration; we find an average of 8.0 ± 0.7 m2/g from ten measurements, not significantly higher (p > 0.26) than the widely used MAC of 7.5 ± 1.2 m2/g recommended by Bond and Bergstrom [Bond, T. C., and R. W. Bergstrom. 2006. Light absorption by carbonaceous particles: An investigative review. Aerosol Sci. Technol. 40(1):27–67]. Second, we review recently reported E(m), whose retrieval is more complex due to the need to combine measurements with numerical models to estimate the contribution of scattering to extinction. Third, we review recent numerical studies that have aimed to predict the BC MAC using various complex refractive indices (m = n + ik). Most of these studies have used m = 1.95 + 0.79i recommended by Bond and Bergstrom (2006), yet failed to predict a MAC as high as 7.5 or 8.0 m2/g at 550 nm wavelength. Fourth, we summarize a selected range of alternative values of m that has been reported by recent studies and place them in the context of measurements using a contour plot of E(m) on the n–k plane. We show that the widely used m = 1.95 + 0.79i corresponds to an E(m) that is too low to be consistent with the measured MAC values. We conclude that the E(m) of BC in the visible and near infrared should be greater than 0.32, and that the commonly used BC models or the refractive index, or both, are still in need of improvement.
EDITOR:
1. Introduction
Ultrafine soot aerosol particles are ubiquitously formed as a byproduct during incomplete combustion of fossil fuels and biomass burning. These nanoscale soot particles emitted from various combustion devices and biomass burning have been identified as a major contributor to radiative forcing of climate at regional and global scales as well as various health concerns to human. Depending on the type of fuel and combustion conditions, soot contains different levels of elemental carbon (EC), which strongly absorbs light at ultraviolet, visible, and infrared wavelengths. Because of this strong light absorbing ability of soot particles, they are commonly called black carbon (BC) particles in the aerosol community. The terms soot (or mature soot, as commonly used in the combustion community) and BC will be used interchangeably in this study, although other forms of BC exist (Corbin et al. Citation2019). The detrimental impacts of soot aerosols on climate and human health have drawn world-wide attention and different strategies have been proposed to mitigate soot emissions. Regulations on particulate emissions from on-road vehicles have been enforced in Europe and California and are likely to be enforced in other countries and regions as well as in other transportation sectors.
Formed as a result of the diffusion limited cluster aggregation (DLCA) process, freshly emitted soot particles (emitted from combustion processes without being coated by volatile particulate matter) appear as fractal-like fractal aggregates of nearly spherical primary particles (PPs or monomers), with certain levels of PP polydispersity (Yon et al., Citation2019), overlapping and necking (Yon, Bescond, and Liu Citation2015). The structure of a fractal-like soot fractal aggregate can be described approximately by the following fractal scaling law (Sorensen Citation2001):
(1)
(1)
where Np is the number of PP in the aggregate, kf and Df are respectively the prefactor and fractal dimension, Rg is the radius of gyration of the aggregate, and
is the mean radius of PPs forming the aggregate. Freshly emitted soot aggregates have a fairly open or lacy structure with a fractal dimension about 1.8 as a result of the DLCA process (Sorensen Citation2001).
To monitor BC mass concentrations from various transient emission sources, such as on-road vehicles and in the atmosphere, it is highly desirable to develop real-time and accurate methods to measure the mass concentrations of BC particles. The majority of such methods rely on the optical properties of BC. Real-time techniques offer the advantages of high temporal resolution (typically on the order of 1 s and limited by the electronic signal processing) based on the direct measurement of the optical extinction, scattering, and/or absorption by aerosols. BC measurements are typically performed at far red or near-infrared wavelengths to minimize interferences from light-absorbing gaseous species and organics, e.g. brown carbon, as well as the contribution of scattering to extinction.
It must be noted that the brown carbon produced by fuels such as biomass and crude-oil residual fuels does absorb in the near-infrared, and care must be taken when interpreting light absorption as due solely to BC (Corbin et al. Citation2019). This is fundamentally due to the fact that the graphitic or graphene-like sub-domains which comprise the molecular structure of BC lie on a continuum of graphitization (Bond Citation2001). This degree of graphitization, or maturity, is an essential property of BC and can be characterized by high-resolution TEM images or by indirect methods. Less-mature BC has been observed in the emissions of fuel-rich quenched flames (Maricq Citation2014), fuel-rich turbine engines (Vander Wal, Bryg, and Huang Citation2014), and low-quality fuels such as biomass and crude-oil residual fuels (Corbin et al. Citation2019). In the present work, we restrict our scope to mature soot BC because a large fraction of BC emissions falls into this category (Bond and Bergstrom Citation2006; Bond et al. Citation2013). We use the term mature soot to refer to soot aggregates composed of PPs of approximately 10-50 nm in diameter, with a turbostratic and polycrystalline graphite-like fine structure and an elemental composition dominated by carbon, with carbon-to-hydrogen (C/H) ratios of 10-20 (Johansson et al. Citation2017; Michelsen Citation2017). In terms of EC relative to total carbon (TC), mature soot has an EC/TC ≥ 0.9 (Török et al. Citation2018).
Although the measured light absorption property of BC can be used to calculate its climate impacts without a conversion to mass concentration, such a conversion is often valuable for the prediction of evolving atmospheric properties, such as BC coatings, size distributions, deposition rates, and health effects. Moreover, BC has traditionally been measured as “elemental carbon” by atmospheric monitoring networks (Petzold et al. Citation2013), and extensive historical data exists. Converting from mass to absorption requires an assumed or measured mass absorption cross section or mass absorption coefficient (MAC, typically in m2/g) in the visible or near IR spectra, which is also needed to convert the measured BC absorption coefficient babs to equivalent BC (eBC; Petzold et al. Citation2013) mass concentration CeBC through CeBC = babs/MAC. The majority of light-absorption measurements are reported as CeBC rather than babs. Even techniques that do not directly measure light absorption, such as the technique of pulsed laser-induced incandescence (LII), include MAC as a key parameter for calibration.
Soot is also an important species in combustion science, for its role in heat transfer as well as pollution. In combustion science, the soot absorption function E(m) is more commonly used than MAC, since the soot volume fraction is the quantity of interest rather than the soot mass concentration. E(m) plays a vital role in optically based BC diagnostic methods, such as light extinction (Snelling et al. Citation1999), flame emission (Snelling et al. Citation2002), and laser-induce incandescence (LII) (Michelsen et al. Citation2015). In such optical methods, E(m) is required to interpret the detected optical signals via prediction of the absorption cross section of BC particles. We note that whereas MAC represents mass-specific absorption and is therefore dependent on particle morphology, in addition to the BC refractive index m and wavelength λ, E(m) is a function only of the refractive index m and is therefore independent of particle morphology (EquationEq. 6(6)
(6) below). Moreover, it has been commonly accepted that m, hence E(m), remains nearly constant in the visible and near infrared spectra for mature soot (Bond and Bergstrom Citation2006).
The Rayleigh-Debye-Gans approximation for fractal aggregates (RDGFA) is the most commonly used theory to predict BC particle absorption because of its simplicity. However, more precise theories are available and have been used in detailed numerical studies. These more precise theories include the generalized multiparticle Mie (GMM) method (Xu Citation1995), the superposition T-matrix (STM) method (Mackowski and Mishchenko Citation1996; Mishchenko Citation2009), and the discrete dipole approximation (DDA). The GMM and STM methods are numerically exact solutions of Maxwell’s equations, i.e., they are not subject to approximations; however, their application is limited to particles formed by non-overlapping spheres. The DDA method, although an approximation, can provide accurate results if the particle is discretized into a sufficiently large number of dipoles. DDA has the advantage of being able to easily model complex particle morphologies, such as internally-mixed soot or BC aggregates formed with overlapping PPs without or with necking. The much simpler and analytical RDGFA approximation may suffer from substantial error, as it effectively represents the BC aggregate as non-interacting monomers (potentially with a correction factor as discussed below to achieve better accuracy), as further discussed below. When applying these theories to predict MAC of BC particles, an m must be selected to conduct the numerical calculations, along with a properly assumed morphology to represent the BC particles.
An essential underlying assumption when using MAC to convert babs to CeBC is that the MAC of BC-containing aerosol particles in the visible and near infrared is sufficiently robust, i.e., insensitive to BC-particle morphological parameters and to BC mixing state. As it is well known that the BC mixing state may affect its MAC (Bond and Bergstrom Citation2006; Bond et al. Citation2013), we avoid the issue of mixing state by focusing only on unmixed or uncoated BC, i.e., freshly emitted BC, in this study. Even for this case, Bond et al. (Citation2013) concluded that models have been unsuccessful at predicting the measured BC MAC from best estimates of m and particle density.
In addition to uncertainties on the impact of BC morphology on the predicted MAC, there is also some uncertainty in the most representative value of the measured MAC and refractive index m of freshly-emitted BC. The comprehensive review of Bond and Bergstrom (Citation2006) included recommended values of MAC and m that have been widely adopted by climate models, BC instruments, and numerical studies. While that review did accurately summarize the best available measurements of these quantities prior to 2006, new data have since become available from improved experimental techniques and accurate numerical methods. In addition, while Bond and Bergstrom (Citation2006) did review all available MAC measurements, they did not review measurements of the absorption function E(m), which can be used to predict the expected range of MAC using the RDGFA approximation and its error bound when the material bulk density ρBC is known.
In this study, we aim to critically review recent measurements of MAC and E(m) in order to evaluate the consistency of these measurements. We also review recent modeling results, in terms of the predicted MAC and in terms of choice of m, an essential choice for any modeling work, to see if recent numerical predictions of BC MAC can reproduce the recommended measured value at 550 nm. We focus on 550 nm light absorption and structure our review as follows. First, we formally define key optical properties and review the currently-accepted values of related physical properties of BC. Second, we review recent direct measurements of MAC of freshly-emitted mature BC particles and compare these measurements with the currently-accepted MAC value. Third, we review previously unaddressed measurements of the absorption function E(m) of mature BC particles, as reported in the combustion and heat transfer literature. Fourth, we review predictions of MAC using numerically accurate methods and compare these predictions with MAC measurements. Fifth, we summarize our review with a discussion of plausible refractive indices for black carbon, and conclude that the currently-accepted m is unlikely to be accurate. Future studies should therefore explore whether the underprediction of MAC at 550 nm by numerically accurate methods is solely due to the inaccurate BC refractive index recommended by Bond and Bergstrom (Citation2006).
2. Definitions of MAC, E(m), ERDG, AAE, and RDGFA
In this section, the definitions and key properties of MAC, E(m), and absorption Ångström exponent (AAE) are introduced. The acronyms used in this section and the remainder of the paper are given in .
Table 1. A summary of acronyms used in this study.
2.1. MAC and RDGFA
The mass absorption cross-section, MAC, is the absorption cross-section per unit mass of a material. MAC can be understood to either represent the mass absorption coefficient on an ensemble basis, i.e., the ratio of aerosol absorption coefficient babs to the aerosol mass concentration C (which implicitly assumes that MAC is independent of aggregate size), or on individual particle basis. The former definition is the basis of the experimental determination of MAC, according to instrument sensitivity limits, while the latter definition is normally used in the numerical prediction of MAC.
In the numerical prediction of MAC, the orientation-averaged BC particle absorption cross section σabs has to be obtained for numerically generated aggregates with certain morphological parameters (Df, kf, and Np) and an assumed refractive index at a specified wavelength λ using an appropriate method, such as GMM, STM, DDA, or RDGFA. The choice of method depends on the complexity of the BC aggregate morphology and the required accuracy. The GMM, STM and RDGFA methods require that the model BC aggregate is represented as a collection of point-contact spheres, whereas DDA does not suffer such a limitation and can handle complex particle shape. Once the aggregate absorption cross section σabs is available, MAC can be readily evaluated as
(2)
(2)
where mp, vp, and ρBC are respectively the particle (aggregate) mass, volume, and bulk density. In the case of the RDGFA approximation for idealized BC aggregates formed by point-contact spherical PPs, which neglects the interactions or multiple scattering among PPs within an aggregate, the aggregate absorption cross section is the summation over all PPs, i.e.,
(3)
(3)
where superscripts agg and p represent quantities of aggregate and primary particle, respectively. The RDGFA theory requires that each PP can be considered to be in the Rayleigh-scattering regime, i.e., the absorption cross section of each PP is evaluated by the Rayleigh approximation in the second part of EquationEq. (3)
(3)
(3) . Consequently, under the RDGFA approximation MAC is expressed as
(4)
(4)
where the subscript RDG indicates the RDGFA approximation.
It is noticed that under the RDGFA approximation, MAC is treated as a property of the constituent material of BC particles at a given wavelength λ through the absorption function E(m) discussed in the next sub-section and the material bulk density ρBC. However, it should be emphasized that MAC is not an intrinsic property of BC material, it depends on the morphology of BC particles as well.
It is also worth pointing out that several efforts have been made to improve the accuracy of RDGFA approximation for the prediction of aggregate absorption cross section by introducing a correction factor h as a multiplier to the right hand side of EquationEq. (4)(4)
(4) to bring the RDGFA result of aggregate absorption cross section to agree with accurate numerical predictions by GMM, STM, or DDA. The modified equation becomes
(5)
(5)
where the prime indicates the MAC of corrected RDGFA through the correction factor h. The correction factor h has been estimated as lying within the range 0.9 to 1.3 (Yon et al. Citation2008; Yon et al. Citation2014; Sorensen et al. Citation2018), depending on the particle morphology, PP and aggregate sizes, refractive index, and wavelength.
2.2. Absorption function E(m) and retrieved absorption function ERDG based on RDGFA
The absorption function E(m) arises from electromagnetic theory as a fundamental quantity related to particle absorption (Bohren and Huffmann Citation1983) and is of importance because it can be inferred from absorption measurements and the RDGFA approximation. It is defined as
(6)
(6)
Therefore, E(m) is dependent solely on the refractive index of the particle material and is an important parameter in the calculation of particle absorption cross-section in the RDGFA theory through EquationEq. (3)(3)
(3) . This is in contrast to MAC, which depends on not only the particle material, but also the particle morphology.
The absorption function E(m) of soot in the visible and near infrared is an important property of flame-generated soot in combustion science due to its vital role in optically based soot diagnostic methods, such as light extinction (Snelling et al. Citation1999), flame emission (Snelling et al. Citation2002), and laser-induce incandescence (LII) (Michelsen et al., Citation2015). In such optical methods, E(m) is used to predict the absorption cross section of BC particles using the RDGFA theory. While in principle any theory could be used to predict the soot absorption cross section provided that the soot particle morphology and refractive index are known, the RDGFA theory is most commonly used mainly due to its simplicity, sometimes including the correction factor defined in EquationEquation 5(5)
(5) . The RDGFA theory was used in all of the experimental studies reviewed below.
The RDGFA theory has been commonly used not only for the prediction of absorption by soot particles but also for the retrieval of E(m) from measurements. However, such a retrieved value of E(m) does not constrain the complex refractive index m. We therefore introduce a separate term for an E(m) value retrieved from measurements using the RDGFA theory, ERDG, which may differ from the true E(m) and the degree of deviation depends on the error of RDGFA applied to the measured soot. We only use the term E(m) in the context of modeling, where m is known (EquationEquation 5(5)
(5) ).
2.3. Absorption ångström exponent (AAE)
AAE is an important BC optical property used to characterize the spectral variation of BC aggregate absorption cross section. In the Rayleigh limit (which, under the RDGFA approximation, depends on the PP size and not the aggregate size), the absorption cross section of a BC particle with wavelength-independent m is inversely proportional to λ (Moosmüller and Arnott Citation2009), that is, the aggregate has an AAE of 1. In reality, the absorption cross section of a realistic BC aggregate may deviate from such spectral behavior for various reasons, such as the presence of coatings and multiple scattering among PPs. AAE is defined as the negative slope of a log-log plot of absorption cross section versus wavelength (Moosmüller et al. Citation2011)
(7)
(7)
It can also be expressed for a pair of wavelengths as
(8)
(8)
It is worth pointing out that AAE can also be defined in terms of absorption coefficient or MAC. In this study, based on the hypothesis of mature strongly absorbing particles, a BC AAE of unity was used to harmonize MAC measurements at different wavelengths to 550 nm.
2.4. Currently-accepted BC MAC, density, and refractive index from Bond and Bergstrom (Citation2006)
To date, the most commonly used MAC in models and instruments is that recommended in the comprehensive review of light-absorbing carbon by Bond and Bergstrom (Citation2006). Although its title referenced light-absorbing carbon (LAC), their review actually focused on the freshly-emitted, externally-mixed soot BC that is discussed here, and excluded other forms of LAC (such as char BC, soluble brown carbon and tar brown carbon, Corbin et al. Citation2019). For such freshly-emitted BC particles, those authors recommended MAC = 7.5 ± 1.2 m2/g at 550 nm based on a critical review of measurements conducted before 2006. To reduce the influence of measurement artifacts on the results, Bond and Bergstrom (Citation2006) excluded samples that had undergone atmospheric aging (mixing with non-BC materials). The MAC samples they reviewed relied upon a variety of techniques to determine babs, and most frequently determined the BC mass concentration CBC by filter gravimetry after solvent extraction to remove organic impurities.
The BC density is often required to infer E(m) and, in some cases, MAC. The most-often-used density for BC is ρBC = 1.8 g/cm3. The uncertainty in this value is considered minimal (± 0.1 g/cm3 or 5.5%), as the bulk mass density of flame- and engine-generated BC particles has been measured to fall in a fairly narrow range of 1.7–1.9 g/cm3 (Choi et al. Citation1995; Mullins and Williams Citation1987; Park, Kittelson, and McMurry Citation2004; Wu, Krishnan, and Faeth Citation1997) for highly-graphitic BC (as measured by its EC content).
Bond and Bergstrom (Citation2006) recommended a BC refractive index m = 1.95 + 0.79i in the visible and near infrared. While this value is traceable to the experimental work of Smith (Citation1984) on annealed amorphous-carbon films, it is also consistent with the wide range of experimental work reviewed by Bond and Bergstrom (Citation2006) and should not be considered as specific to the sample of Smith (Citation1984). We note that Bond and Bergstrom (Citation2006) also reported “alternative” refractive indices along a “void-fraction line”, down to 1.75 + 0.63i, and stated that they could not differentiate between values on this line. This void-fraction line results in nearly-equivalent values of MAC, so we will not discuss these alternatives explicitly here.
The values of MAC, ρBC and m of Bond and Bergstrom (Citation2006) have been widely adopted by climate models, BC instruments, and numerical studies. However, as noted by Bond and Bergstrom (Citation2006), their recommended MAC cannot be predicted using either Mie or RDGFA models with their recommended values of ρBC and m. The predicted MAC is about 30% lower than the measured value at 550 nm. As the uncertainty in ρBC is much smaller than 30%, this underprediction of the BC MAC must be due either to inaccuracy in m or inaccuracy in the numerical models. Bond and Bergstrom (Citation2006) suggested that the latter inaccuracy was more likely, since the Mie and RDGFA models are not accurate: the Mie model involves the simplification of a fractal-like BC aggregate to an equivalent-volume sphere, and the RDGFA model neglects the interactions among primary particles within the BC aggregate.
3. Recently and directly measured MAC of freshly-emitted BC
In this section, we discuss recent experimental studies dedicated to the direct measurement of the MAC of freshly emitted mature BC. We focus on studies conducted after 2006, i.e., after the publication of Bond and Bergstrom (Citation2006), and only include studies where MAC was determined in situ from direct measurements of BC absorption and mass. That is, we exclude studies where model calculations were required to obtain MAC, and we also exclude studies where filter-based instruments were used. The goal of this section is to assess whether these recent direct measurements are consistent with the value of 7.5 ± 1.2 (± 16%) m2/g at 550 nm recommended by Bond and Bergstrom (Citation2006). For a review which includes all MAC values reported in the literature regardless of the techniques used, the reader is directed to the work of Zangmeister et al. (Citation2018). summarizes the studies we review in the following discussion.
Table 2. A summary of recent measurements of MAC of freshly emitted BC.
Zhang et al. (Citation2008) reported the MAC of size-selected soot generated from a Santoro-like burner at 320 nm mobility diameter at λ = 532 nm to be 8.7 m2/g. They measured babs using the extinction-minus-scattering technique and determined CBC using the single-particle mass measurements determined by an Aerosol Particle Mass (APM) analyzer and the particle number concentration measurements of a condensation particle counter (CPC). While uncertainties in these techniques can generally be considered to be well understood, Zhang et al. (Citation2008) did not report an uncertainty for their measured MAC. Assuming that the uncertainty in their babs was the dominant source of uncertainty in MAC, we estimate an uncertainty of 1.2 m2/g for their reported MAC, so that their MAC is not significantly different (higher by 12%) from the value of Bond and Bergstrom (Citation2006). We note that Zhang et al. (Citation2008) used a tandem differential mobility analyzer (tandem DMA) setup to minimize interferences by the multiply-charged particles that can lead to an overestimation of MAC. We also note that they did not attempt to remove volatiles from their sample; hence, their measured MAC may be biased low due to the presence of organic impurities.
In a follow up study from the same group as Zhang et al. (Citation2008), Khalizov et al. (Citation2009) reported the MAC of soot at mobility diameters of 150, 245, and 320 nm. As before, they employed a tandem DMA setup to attempt to account for multiply-charged particles. To validate this approach, they reported that the scattering cross-section of crystalline ammonium sulfate particles was 17-47% higher than that predicted by Mie theory (larger bias for smaller size selections). This implies that their measured MAC could have been overestimated at smaller sizes due to the presence of larger than expected particles. They obtained a size-dependent MAC at λ = 532 nm that increases from 6.7 ± 0.7 at 155 nm mobility diameter to 8.7 ± 0.1 m2/g at 320 nm mobility diameter. They did not offer an explanation for this size dependence.
Cross et al. (Citation2010) measured babs of denuded soot particles generated using a McKenna flat premixed flame burner burning rich C2H4/O2 mixtures without or with coating using multiple techniques for light absorption measurement: photoacoustic spectrometer (PAS), photoacoustic soot spectrometer (PASS-3), and photo-thermal interferometer (PTI). They determined CBC using a Couette centrifugal particle mass analyzer (CPMA) in combination with a CPC, similarly to Zhang et al. (Citation2008). They obtained MAC = 8.11 ± 1.7, 7.43 ± 0.5, and 8.68 ± 0.4 m2/g using PASS-3, PTI, and PAS, respectively, for denuded soot at 532 nm. None of these values are significantly different from the value recommended by Bond and Bergstrom (Citation2006).
Radney et al. (Citation2014) measured the MAC of soot particles produced from a laminar ethylene/air diffusion flame. In their experiments, the soot aerosol was classified by a DMA and an APM in tandem to respectively select particles by mobility diameter and mass. The babs of the classified particles was measured at 405 nm wavelength by a photoacoustic spectrometer (PAS), while the number concentration measured by a CPC was used to calculate CBC. They obtained a MAC of 5.69 ± 0.83 m2/g at 405 nm, equivalent to 4.2 m2/g at 550 nm, substantially lower than the other measurements discussed herein. They attributed the lower measured MAC value to the elimination of larger and multiply charged particles. However, only 68% of carbon in their samples was classified as EC, in comparison with 80% (Durdina et al., Citation2016) or even 90% (Ferge et al., Citation2006; Török et al., Citation2018) for typical mature soot. A lower EC percentage corresponds to a lower degree of maturity (degree of graphitization) and correspondingly a lower MAC (Bond, Citation2001). We therefore excluded the MAC reported by Radney et al. (Citation2014) from .
Dastanpour et al. (Citation2017) characterized and measured the optical properties of soot particles produced from an inverted diffusion flame fueled with CH4 and conditioned the aerosol using a catalytic stripper. The babs was measured using the extinction-minus-scattering technique and a CPMA-aerosol-electrometer system was used to measure CBC. Compared to the CPC method for measuring CBC, the aerosol-electrometer method has the advantage of detecting the multiple charges of multiply-charged particles, reducing bias in the measured MAC. They found that the MAC of soot particles at 660 nm increased from 4.5 to 8.5 m2/g as the CPMA-classified particle mass (related to mobility diameter) was varied from 0.05 to 8 fg and explained this size dependence in terms of an increasing degree of graphitization with particle size, based on the hypothesis that the size and maturity were correlated in that flame. In other words, smaller particles are less mature than the larger ones.
If the size dependence of MAC is also significant for other BC sources other than the inverted flame studied by Dastanpour et al. (Citation2017), then any size-selected MAC measurements must be reported at a diameter of average particle mass, such as the mass-median diameter, to be representative. Ideally, one would harmonize MACs to size as well as wavelength. However, as the conversion factor from count- to mass-median diameter ranges from 2 to 4, depending on the width of the size distribution (Hinds, Citation1999), such a harmonization would introduce too much uncertainty. At present, much more experimental data on the potential size dependence of MAC are needed, although hints can be obtained from the literature about its importance. In particular, the studies of Cross et al. (Citation2010) and Radney et al. (Citation2014) obtained MAC by linear fits to σabs measured as a function of CPMA or APM setpoints up to 3.8 fg and 5 fg, respectively, whereas Dastanpour et al. (Citation2017) measured setpoints up to 8 fg. The fact that linear fits were adequate to describe the data of Cross et al. (Citation2010) and Radney et al. (Citation2014) means that either the size dependence of MAC in those studies was negligible, that multiple-charge issues obfuscated any size dependence, or too-narrow mass ranges were explored. The first possibility is the most likely. The second possibility is unlikely for both studies, as Cross et al. (Citation2010) used multiple SP2 instruments capable of observing the presence of multiply charged particles whereas Radney et al. (Citation2014) employed a tandem DMA-APM setup to minimize their presence. The last possibility is also unlikely as the mass ranges measured in all three studies were dependent on the available particle masses.
Very recently, Zangmeister et al. (Citation2018) measured MAC of nine forms of highly-absorbing carbonaceous aerosols in the spectral range of 500 and 840 nm. The aerosol absorption coefficient was measured using PAS with a supercontinuum laser and tunable wavelength and bandpass filter. At λ = 550 nm, the measured MAC of ethylene soot with mobility diameter of 250 nm was only 3.8 m2/g, while the MAC of kerosene lamp, diesel lamp, and paraffin wick soot with mobility diameter of 700 nm was 8.6 ± 0.3, 7.5 ± 0.3, and 8.2 ± 0.4 m2/g, respectively. The significantly lower MAC value of the ethylene soot, which was collected from the centerline of a laminar diffusion flame 5 cm above the burner, is likely because it was of low maturity; we therefore rejected this value from . The remaining MAC values are all within one standard error of the Bond and Bergstrom (Citation2006) value. Zangmeister et al. (Citation2018) also investigated the MAC of different sized ethylene soot particles between 300 and 550 nm mobility diameter, and found that the MAC was essentially independent of mobility diameter.
Zangmeister et al. (Citation2018) also summarized all published MAC values for any carbonaceous particles (without restricting their discussion to mature soot as in the present work) and reported a mean value of 8.0 ± 0.3 m2/g when excluding filter-based studies, in general agreement with our discussion here, but a mean value of 7.4 ± 0.5 m2/g when including filter-based studies. We note that Bond and Bergstrom (Citation2006) included filter-based studies in their recommended value, after attempting to correct for artifacts of that method. This discrepancy suggests that challenges in filter-based absorption measurements may be one reason for the lower MAC of Bond and Bergstrom (Citation2006) compared to the studies summarized herein.
Forestieri et al. (Citation2018) measured MAC of uncoated flame soot particles generated from an inverted coflow diffusion flame fueled with CH4 and a McKenna flat flame fueled with a rich C2H4/O2/N2 mixture at an equivalence ratio of 2.0. In their study, the mass concentration and optical properties of size selected soot particle aerosol were measured using CPMA and several instruments, including PASs, PASS-3, and CAPS, with a focus on λ = 532 nm. They obtained size-independent MAC = 9.1 ± 1.1 m2/g at 532 nm for particles larger than 160 nm, which is about 17% higher than the value recommended by Bond and Bergstrom (Citation2006). Instead of determining the refractive index of mature soot in the visible, they derived model-specific effective refractive index at 405, 532, and 630 nm by fitting the predicted size-dependent particle absorption cross section to the measurements using Mie theory and the RDGFA approximation. It should be noticed that the model-specific effective refractive index is of limited value since it is not the optical property of BC material, though the Mie theory based effective refractive index may be useful to climate models and satellite remote sensing where the Mie theory has been the preferred choice based on the consideration of computational efficiency.
We emphasize that Forestieri et al. (Citation2018) actually discussed multiple intensive laboratory studies performed in the same laboratory in different years (2008, 2012, 2015) with various different authors contributing to data collection. This represents a significant advantage of their work relative to some other studies. In addition, their data set overlaps partially with that of Cross et al. (Citation2010). It could be proposed that their reported MAC should be more heavily weighted in our averaged value; however, doing so would not change our reported average significantly, and would require some subjective decision which we have avoided introducing into our data analysis.
Finally, we note that Coderre et al. (Citation2011) also reported MAC values of BC emitted from an inverted diffusion flame fueled with CH4 over the spectral range of 450 to 750 nm. They reported MAC = 6.5 ± 0.5 m2/g at 550 nm (13% lower than the Bond and Bergstrom value, and not significantly different), but used a BC density of 1.89 ± 0.07 g/cm3 rather than 1.8 ± 0.1 g/cm3 as used herein. Had Coderre et al. (Citation2011) used the latter density, they would have reported MAC = 6.8 ± 0.5 m2/g at 550 nm, which is even closer to (just 9% lower than) the Bond and Bergstrom (Citation2006) value. However, we have omitted this MAC from to avoid repetition of the Coderre et al. (Citation2011) results, which are better categorized as measurements of E(m) than MAC, and are therefore shown in .
Table 3. A summary of reported values of ERDG, the E(m) of mature soot inferred from measurements using the RDGFA theory. The last column lists the corresponding MACRDG values at 550 nm based on EquationEq. (4)(4)
(4) , yielding a mean value of 7.3 ± 1.4 m2/g. Uncertainties are provided where the original publication provided uncertainties.
The preceding discussion of recent direct measurements of MAC of freshly emitted flame-generated mature soot conducted after the review of Bond and Bergstrom (Citation2006) is summarized in and in . It is evident that the values of recently measured MAC at 550 nm are either very close to or somewhat higher than the value recommended by Bond and Bergstrom (Citation2006), except those by Khalizov et al. (Citation2009) at 150 nm mobility diameter, i.e., the smallest selected mobility diameter.
Figure 1. Comparison of the MAC recommended by Bond and Bergstrom (Citation2006) (7.5 ± 1.2 m2/g; number of studies N = 17; middle panel) with the recent measurements summarized in this study Blue bars (bottom panel) show direct MAC measurements (8.0 ± 0.7 m2/g, number of studies N = 10), red bars (top panel) show the MAC values derived from recent ERDG measurements (7.3 ± 1.4 m2/g, N = 14) discussed in Section 4. Each histogram is overlaid with a normal distribution illustrating the respective reported mean and standard deviation.
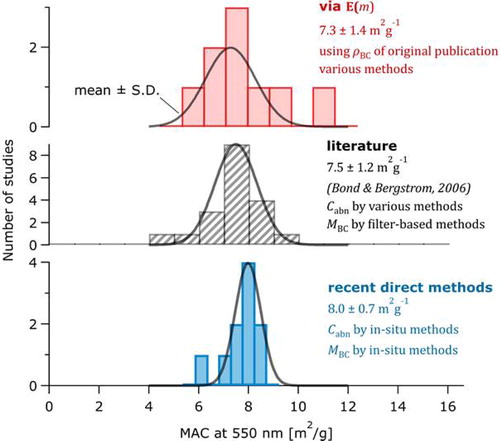
The ten directly measured MAC values of mature soot fall within a fairly narrow range between 6.5 and 8.8 m2/g and give a mean and standard deviation of 8.0 ± 0.7 m2/g at 550 nm (bottom panel of ). This mean MAC is 7% higher than that of Bond and Bergstrom (Citation2006), who summarized 17 studies (middle panel of ), but still within the 16% uncertainty range of the latter value. The top panel of displays MAC values at 550 nm converted from measured ERDG discussed in the next section, which yield a mean and standard deviation of 7.3 ± 1.4 m2/g. The differences between the three MAC values are not statistically significant. The consistency among the three sets of MAC suggests that the under-prediction of MAC by using the Bond and Bergstrom (Citation2006) refractive index is likely due to an inaccurate refractive index or to inaccuracy of the optical models. The accuracy of those optical models will be examined below.
4. Recently measured ERDG of mature soot
In this section, we discuss recent experimental studies dedicated to the determination of ERDG of freshly emitted mature BC in the visible and near infrared spectra. As stated in Section 2.2, we use the term ERDG to refer to the E(m) retrieved by experimental studies, where m is unknown, in conjunction with the RDGFA theory for BC aerosol absorption and scattering. The term ERDG is appropriate since all of the studies discussed below employed the RDGFA approximation. Although we focus on studies conducted after 2006, the review of Bond and Bergstrom (Citation2006) did not address ERDG, and so we also include some older studies of ERDG measurement in our review.
In reviewing measurements of ERDG, it is important to bear in mind that the effect of aggregation on the absorption cross section of soot aggregates has been commonly neglected in the retrieval of ERDG as well as in the theory behind the optical methods used. The extent to which this neglect may have biased the results of the measured ERDG is therefore dependent on the accuracy of RDGFA, which in turn depends on the detection wavelength and the morphology of soot particles and is discussed in the next section.
It has been well known that ERDG depends on soot maturity (Bladh et al. Citation2011; López-Yglesias, Schrader, and Michelsen Citation2014), and, therefore, so does MAC. Here, we concern only the measured values of ERDG of mature soot (high EC content, high C/H ratio, and high degree of graphitization) in the visible and near infrared. Moreover, we point out that the measurement of ERDG is fundamentally equivalent to the measurement of MAC, as long as the bulk mass density of mature soot is known or assumed, in the sense that both are measurements of light absorption by BC aerosol. This point has been made clear in several publications, e.g. Williams et al. (Citation2007) and Coderre et al. (Citation2011). However, there is an important difference between ERDG measurement and MAC measurement. The former always relies on assumptions about how the BC particle morphology affects the accuracy of the RDGFA approximation used to infer ERDG from the measured BC aerosol absorption, i.e., ERDG cannot be directly measured. On the other hand, the latter does not require such assumptions since both the BC aerosol absorption coefficient and mass concentration can be directly measured. The equivalence of ERDG and MAC is based on the RDGFA approximation, that is, assuming that the effects of aggregation are negligible the two quantities are simply related through EquationEq. (4)(4)
(4) . Although this equivalence implies a redundancy between the two values, ERDG is the property required in optical methods in combustion science, where the objective of some optical soot diagnostics is to obtain the soot volume fraction, not the soot mass concentration. In addition, the determination of ERDG in combustion science also involves approaches different from those deployed to measure MAC in aerosol sciences. For these reasons, we will limit the discussion of recent literature of ERDG measurement to fields closely related to combustion and heat and mass transfer, though it is clear from EquationEq. (4)
(4)
(4) that the recent measurements of MAC discussed in Section 3 directly provide ERDG. Some earlier studies related to the measurements of soot optical properties leading to ERDG can be found in the discussions of Bond and Bergstrom (Citation2006), Williams et al. (Citation2007), and Coderre et al. (Citation2011) and will not be included in the following discussion.
Zhu et al. (Citation2002) measured the dimensionless extinction constant Ke of soot emitted from laminar diffusion flames fueled with acetylene and ethene. The dimensionless extinction coefficient is used to interpret laser extinction measurements and is defined in terms of Bouguer’s Law as
(9)
(9)
where I/I0 is the ratio of transmitted to incident monochromatic light intensity at wavelength λ, fv is the soot volume fraction along a uniform pathlength l. If total scattering is also measured, the dimensionless absorption coefficient, which is equal to Ka = 6πERDG based on the RDGFA approximation, can be determined. Zhu et al. determined Ke using directly measured light extinction at four wavelengths in the visible and infrared, namely, 543, 632, 856, 1314, and 1565 nm, and the soot volume fraction determined from the measured mass of collected soot and the measured soot bulk mass density from a previous study. Their measured values of Ke increase with increasing wavelength from 7.95 to 10 for soot emitted from the acetylene flame, but remain nearly constant around 9.35 (between 9.19 and 9.65) for soot emitted from the ethene flame. They showed that their measured values of Ke are significantly higher than those predicted using several soot refractive indices in the literature. Moreover, they reported that the measured dimensionless absorption constant, Ka = 6πERDG under the RDGFA approximation, increases with wavelength from 5.44 to 6.72 between 543 and 856 nm for the acetylene soot, but varies only slightly from 7.25 to 7.51 for the ethene soot. Their measured Ka suggests that ERDG increases somewhat from 0.289 to 0.356 for the acetylene soot and varies slightly from 0.385 to 0.398 for the ethene soot over the spectral range of 543 to 856 nm, when the RDGFA approximation were used. In a later study, Zhu et al. (Citation2004) measured the dimensionless extinction constant of soot produced from JP-8 flames using the same experimental setup and data analysis method as in Zhu et al. (Citation2002). Using a constant soot density of 1.74 g/cm3, they obtained nearly constant soot dimensionless extinction constant Ke = 9.83 over the spectral range of 632 to 1565 nm. The constancy of Ke was explained as a tradeoff between the ‘beam shielding effect’ (more commonly known as the multiple scattering effect among primary particles within aggregates, Yon et al. Citation2008; Liu et al. Citation2013; Yon et al. Citation2014; Sorensen et al. Citation2018), which reduces the soot aggregate absorption cross section at shorter wavelengths, and the contribution of aggregate scattering to extinction, which has a stronger contribution at a shorter wavelength (Zhu et al., Citation2002, Citation2004). Based on the considerations that the measured Ke remains almost constant and the scattering contribution to extinction is negligible in the near infrared, ERDG can be inferred from Ke = Ka = 6πERDG, leading to ERDG = 0.52.
Williams et al. (Citation2007) carried out another experimental measurement of the dimensionless extinction coefficient of soot extracted from the radial location of maximum soot volume fraction at several heights of coannular diffusion flames of methane, ethylene, and nitrogen-diluted kerosene at 635 and 1310 nm using a similar experimental setup as Zhu et al. (Citation2002, Citation2004). They also interpreted their gravimetric data using ρBC = 1.74 g/cm3 as in Zhu et al. (Citation2004) and obtained the dimensionless soot absorption constant Ka = 6πERDG ≈ 7.0 at both 635 and 1310 nm, leading to ERDG ≈ 0.37 in the visible and near infrared. Moreover, they pointed out that the predicted Ka using the soot refractive indices in the literature is in general significantly lower than the experimental data and arrived at a refractive index m = 1.75 + 1.03i at 635 nm by simultaneously matching the RDGFA calculated Ka and scattering albedo with the measured values.
Snelling et al. (Citation2004) proposed a novel approach to determine the soot absorption function ERDG using low-fluence LII by matching the calculated peak soot temperature to the measured one. The method infers ERDG through the energy balance equation of soot particles and relies on the knowledge of the local gas temperature, the bulk mass density and specific heat of soot, as well as the peak soot temperature during laser pulse heating determined by two-color pyrometry. It is noticed that the laser energy absorption rate by the soot particle was modeled using the RDGFA approximation and the two-color pyrometry requires the ratio of ERDG at the two detection wavelengths. Fortunately, this ratio can be assumed unity for mature soot in the visible and near infrared (Bond and Bergstrom Citation2006; Snelling et al. Citation1999). The main uncertainty in the determined ERDG using this approach is due to the uncertainty in the product ρBCcp (cp is the specific heat of mature soot). Assuming ρBC = 1.9 g/cm3 and cp = 2100 J kg−1 K−1, Snelling et al. obtained ERDG = 0.40 at 1064 nm at HAB = 42 mm and on the centerline of a laminar ethylene diffusion flame where the soot is considered mature. By using the same low-fluence approach and through analyzing LII data obtained using a 532 nm laser pulse at the same flame location as in Snelling et al. (Citation2004), Snelling et al. (Citation2009) arrived at ERDG = 0.4 at λ = 532 nm, supporting the notion that ERDG of mature soot displays negligible variation with wavelength in the visible and near infrared. Adjusting these results to ρBC = 1.8 g/cm3 as recommended by Bond and Bergstrom (Citation2006) gives an ERDG of 0.38 in both cases.
In a more recent study, Snelling et al. (Citation2015) determined soot absorption function ERDG at 465, 577, and 825 nm using the soot volume fraction measured by the modulated LII (MLII) technique and the soot absorption coefficient estimated from 2 D line-of-sight attenuation (LOSA) measurements in the same laminar coflow ethylene/air diffusion flame as investigated earlier (Snelling et al., Citation2004, Citation2009). It is noticed that the soot volume fraction measured using MLII is not dependent on the soot optical properties and can be considered as an independent measurement. The estimate of soot absorption coefficient involves the measured soot extinction coefficient by LOSA and numerically predicted scattering albedo using the RDGFA approximation. Therefore, the uncertainty in the predicted total scattering coefficient by the RDGFA approximation propagates to the estimated soot absorption coefficient. It should also be pointed out that this methodology for inferring ERDG does not require soot density. Snelling et al. (Citation2015) obtained ERDG = 0.45 at 465 and 577 nm and 0.42 at 825 nm.
Coderre et al. (Citation2011) measured the optical properties of cooled soot in the exhaust of inverted diffusion flames fueled with methane in the spectral range of 450 to 750 nm. They conducted spectral LOSA measurements to obtain the spectrally-resolved extinction coefficient and gravimetric analysis to obtain the soot volume fraction along with an assumed soot mass density of ρBC = 1.89 g/cm3. The methodology is overall quite similar to that used previously by Zhu et al. (Citation2002, Citation2004) and Williams et al. (Citation2007). To quantify the contribution of scattering to extinction, Coderre et al. characterized the soot particles by analyzing transmission electron microscope (TEM) images for mean primary particle diameter and scanning electron microscope (SEM) images for aggregate size distribution and then applied RDGFA to predict the ratio of scattering coefficient to absorption coefficient ρsa (equivalent to single scattering albedo). The only parameter in their estimate of ρsa that was not measured or predicted is the ratio of scattering function to absorption function F(m)/E(m), which was taken from the literature. However, they performed a sensitivity study and found that a 10% uncertainty in this ratio only leads to a 2% in the scattering correction. They obtained ERDG = 0.35 ± 0.03 in the visible spectrum and MAC = 6.5 ± 0.5 m2/g at 550 nm, which is 13% lower than the value recommended by Bond and Bergstrom (Citation2006) as pointed in Section 3. It is noticed that their MAC at 550 nm can simply be evaluated using the RDGFA approximation expressed in Eq. (4), which is not surprising since they used this approximate theory to interpret their extinction measurements and to model the relative contributions of scattering to extinction.
The studies on the measurements of mature soot ERDG in the visible and near infrared discussed above are summarized in . Based on these values of ERDG of mature soot, it is evident that the mature soot has an ERDG between 0.35 and 0.45 in the visible and infrared and any ERDG values of mature soot significantly lower than 0.35 should be considered unacceptable. For the reasons that the uncertainty of measured soot volume fraction using the MLII method is quite high (Snelling et al. Citation2015), the acceptable range of mature soot ERDG is limited to 0.35 to 0.4, though the upper limit of 0.4 is likely under-estimated. However, it should be pointed out that the lower limit of ERDG is important to derive the validity criterion of BC m presented below, not the upper one. It is worth pointing out that these indirect measurements of ERDG also suffer various issues. First, an assumed soot bulk density is required. Second, the estimate of soot absorption from extinction measurements requires the knowledge of scattering contribution to extinction, which is either neglected or estimated using the RDGFA approximation along with the soot aggregate morphological parameters derived from TEM image analysis. In essence, the nature of measurements of ERDG is still the measurement of absorption, either directly using low-fluence LII and MLII or indirectly using the extinction-minus-scattering method. In this regard, as pointed out above, measurements of MAC and ERDG are fundamentally equivalent, though somewhat different techniques have been deployed.
5. Previous numerical studies of MAC
Various efforts employing different methods, either RDGFA or numerically accurate approaches, have been made in the last two decades or so to predict MAC of soot aggregates in the visible spectrum. Here, we summarize the results of these studies. By focusing on numerically-accurate methods, we investigate the accuracy of the best available techniques to predict MAC and the refractive index.
Liu and Mishchenko (Citation2005) employed the superposition T-matrix method to predict the effects of morphological parameters, i.e., Df, kf, a, and Np, on the radiative properties of numerically generated soot fractal aggregates formed by monodisperse PP in point-contact at λ = 628 nm and two refractive indices m = 1.75 + 0.435i and 2 + i. When using m = 1.75 + 0.435i their results showed that the predicted MAC of soot aggregates displayed a weak dependence on Df (between 1.5 and 2.4), kf (between 0.9 and 2.1), Np (between 3 and 400), and a (between 5 and 60 nm). On the other hand, assuming m = 2 + i results in a strong variation of the predicted MAC with a (first increasing slightly from 10.9 to 11.3 m2/g, for a from 5 to 30 nm and then decreasing more quickly) and Np (first increases from about 10.5 at Np = 3 to 11.8 m2/g at Np = 20 and decreases very slowly to approach 11.1 m2/g over the entire range of Np considered), though the effects of Df and kf were still very weak. Thus, the calculated MAC values are very sensitive to the refractive index, which also affects the sensitivity of MAC to other morphological parameters (Sorensen et al. Citation2018). It is important to notice that Liu and Mishchenko (Citation2005) assumed that the bulk mass density of BC was 1 g/cm3, explaining their much higher calculated values of MAC.
Kahnert (Citation2010a) applied GMM to investigate the radiative properties of numerically generated fractal soot aggregates formed by monodisperse PP in point-contact with Df = 1.82 and kf = 1.27 at λ = 440 and 870 nm. Assuming m = 1.70 + 0.64i at 440 nm and ρBC = 1.8 g/cm3, the calculated MAC = 6.6 m2/g was about 30% lower than that (9.4 m2/g) extrapolated from the recommended value of Bond and Bergstrom (Citation2006) at 550 nm assuming an inverse wavelength dependence of MAC (AAE = 1). Kahnert (Citation2010b) made an attempt to investigate plausible causes for the discrepancy between measured and computed MAC values in the visible spectrum. He calculated the absorption and scattering properties of numerically generated soot aggregates formed by identical and point-contact PP with Df = 1.82 and kf = 1.27 using the T-matrix method. The results indicate that the calculated MAC at 550 nm is about 20% lower than the value recommended by Bond and Bergstrom (Citation2006) (6.0 vs. 7.5 m2/g) when using the refractive index and mass density suggested by Bond and Bergstrom (Citation2006), i.e., m = 1.95 + 0.79i, and is independent of the PP radii up to 25 nm. Although Kahnert realized that the predicted MAC is very sensitive to the assumed refractive index, he stated that there is little reason to doubt the refractive index suggested by Bond and Bergstrom. He suggested that a lower mass density of BC has to be used to bring the predicted MAC in agreement with the measured value. However, available experimental evidence indicates that the mass density of mature flame soot lies between 1.7 and 1.9 g/cm3 (Bond and Bergstrom Citation2006; Choi et al. Citation1995; Mullins and Williams Citation1987; Park, Kittelson, and McMurry Citation2004; Wu, Krishnan, and Faeth Citation1997) with negligible uncertainty. Therefore, it is unreasonable to assume a mass density of mature soot significantly lower than 1.8 g/cm3. In a further numerical study using the T-matrix method and assuming ρBC = 1.8 g/cm3 and the refractive index of Chang and Charalampopoulos (Citation1990), which gives m = 1.77 + 0.63i at 550 nm, Kahnert and Devasthale (Citation2011) also obtained significantly lower MAC = 5.2 and 4.9 m2/g for lacy (Df = 1.8) and compact (Df = 2.4) aggregates, respectively.
Scarnato et al. (Citation2013) conducted a numerical study of MAC of bare and coated BC particles of both lacy and compact structure using DDSCAT (version 7.1) (Draine and Flatau, Citation2010) and the BC mass density and refractive index recommended by Bond and Bergstrom (Citation2006), i.e., ρBC = 1.8 g/cm3 and m = 1.95 + 0.79i. They found that the MAC values are in general higher for lacy aggregates compared to more compact ones. It is surprising to notice that their predicted MAC values at 550 nm between 6.3 and 7.0 m2/g for uncoated soot particles, depending on the compactness of the aggregates, are significantly higher than the value obtained by Kahnert (Citation2010b) (6.0 m2/g) for lacy soot aggregates using the T-matrix method, though the same values of soot density and refractive index were used in both studies. Scarnato et al. (Citation2013) attributed to the lower MAC value predicted by Kahnert (Citation2010b) to the larger aggregate size considered by Kahnert (Citation2010b). In a more recent numerical study, Scarnato et al. (Citation2015) computed MAC of freshly emitted soot particles at 550 nm using DDSCAT, ρ = 1.8 g/cm3, and m = 1.77 + 0.63i (Chang and Charalampopoulos Citation1990) and obtained lower MAC values between 5.32 and 5.65 m2/g that are weakly dependent on aggregate size. The lower MAC values at 550 nm than those reported earlier (Scarnato et al. Citation2013) are attributed to the use of the refractive index of Chang and Charalampopoulos (Citation1990), instead of that recommended by Bond and Bergstrom (Citation2006). The causes for the significantly higher MAC values predicted by Scarnato et al. (Citation2013) remain unclear and deserves further investigations.
Wu et al. (Citation2015) calculated the optical properties of soot aggregates formed by polydisperse PP at λ = 550 nm using the STM method with the soot density and refractive index recommended by Bond and Bergstrom (Citation2006). They predicted MAC values between 6.26 and 6.38 m2/g for soot aggregates formed by polydisperse and monodisperse PP. Although these predicted MAC values are lower than the value recommended by Bond and Bergstrom, they are considerably higher than the MAC value of 6.0 m2/g obtained by Kahnert (Citation2010b) using the same method, the same soot density and refractive index, and very similar morphological parameters. The causes for the discrepancies between these predicted MAC values are unknown, and may be related to differences in the simulated particles used by these two studies.
In summary, previous numerical studies using accurate methods, including GMM, DDA and STM, have shown that the predicted MAC values are not strongly dependent on the morphological parameters of soot aggregates, but are significantly influenced by the refractive index, as shown e.g. by Liu and Mishchenko (Citation2005). To provide a clear quantitative comparison between the predicted and measured MAC at 550 nm, the numerically predicted MAC values discussed above using the refractive index recommended by Bond and Bergstrom (Citation2006), either m = 1.95 + 0.79i or m = 1.75 + 0.63i on the upper void-fraction line (Bond and Bergstrom Citation2006), are summarized in . The predicted MAC results using other refractive indices, e.g. Liu and Mishchenko (Citation2005), are not included in for clarity. Except the results of Scarnato et al. (Citation2013), which are considered questionable due to the inconsistency with the prediction of Kahnert (Citation2010b), the predicted MAC values at 550 nm using the refractive index and mass density of Bond and Bergstrom (Citation2006) and the best numerical methods available are at least 15% lower than the measured value. Considering that the MAC value recommended by Bond and Bergstrom (Citation2006) is likely about 10% lower than recent measurements discussed in Section 3, the discrepancy between the predicted and measured MAC at 550 nm is likely even larger.
Table 4. A summary of previous numerical studies of MAC prediction, focusing on numerically accurate techniques. Only studies using refractive indices m along the void fraction line recommended by Bond and Bergstrom (Citation2006) are included. Other studies, such as Liu and Mishchenko (Citation2005), are discussed in the text.
The inaccuracy of the RDGFA approximation, which was originally invoked to explain this discrepancy, is therefore not the only cause of the under-prediction of MAC. All numerically-modeled MACs are under-predicted, with no cases of over-prediction, suggesting that a model bias exists. This model bias is highly likely due to the use of an inaccurate refractive index; however, other biases in model construction cannot be ruled out.
6. Plausible refractive indices for black carbon
The preceding discussion has concluded that the literature on measured E(m) (strictly speaking on ERDG) of mature soot is consistent with the literature on measured MAC, and that the literature on using highly accurate numerical methods and the m and ρBC recommended by Bond and Bergstrom (Citation2006) to predict MAC has failed to reproduce the measured MAC at 550 nm. In this section, we therefore evaluate some literature values of m based on their consistency with the measured E(m). It is recognized that the measured E(m), ERDG, may not be the true E(m) of mature soot due to the inaccuracy of the RDGFA approximation. However, it can be used as a proxy of the true value for the present purpose described below. We have used E(m) as a reference because it is a simple function of m which can be calculated without any assumptions. In contrast, the calculation of MAC from m requires modeling assumptions to be made about the particle morphology and the use of a specific numerical method, such as assuming the particle is formed by point-contact PPs and use of the RDGFA approximation. For this comparison, between the values of literature measured E(m) and the calculated E(m) as a function of m, we wish to consider both the real n and imaginary k parts of m, since E(m) is strongly influenced by both n and k. We therefore plot E(m) as a contour on the n-k plane as shown in .
Figure 2. Contours of E(m) on the n-k plane. Five representative soot refractive indices in the visible and near infrared are shown. The two black contour lines mark the range of reported ERDG between 0.35 and 0.4. The solid pink line shows the lower limit of E(m) of 0.32 corresponding to the mean value of recent directly measured MAC of 8.0 m2/g at 550 nm calculated using the RDGFA approximation from EquationEq. (11)(11)
(11) with h ≤ 1.3. The two dashed pink lines indicate the uncertainty range of the lower limit of E(m) with one standard deviation. It is noticed that the lower bound of measured ERDG coincides with the upper uncertainty bound of the estimated lower limit of E(m).
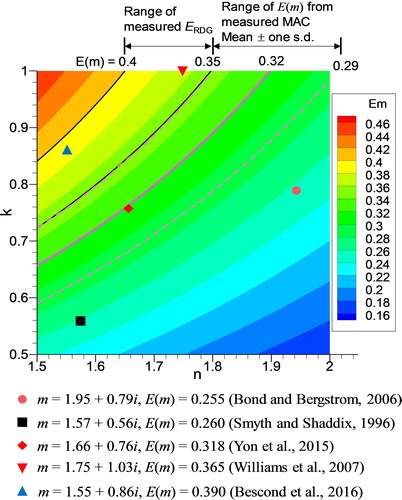
In the majority of published refractive indices of mature soot and BC, the real and imaginary parts fall in the range of 1.5 < n < 2 and 0.5 < k < 1 (Bond and Bergstrom Citation2006). Within this range, we plot the values of E(m) on the n-k plane in as color coded contours. It is noticed that, within the considered ranges of n and k, E(m) increases with increasing k and decreasing n, i.e., the high and low values of E(m) appear in the top-left and bottom-right corner of the plot, respectively. It is also noticed that the E(m) would be approximately parallel to the void-fraction line in n-k space of Bond and Bergstrom (Citation2006), which is why we have considered those values as equivalent in the discussion above.
In , the two black solid curves indicate the range of the measured E(m), ERDG, which is between 0.35 and 0.4 (Section 4). To place the lower limit of E(m) corresponding to the recently-measured average MAC of 8.0 m2/g on , modeling assumptions are necessary. We have used the RDGFA approximation in combination with literature assessments of its accuracy and the effects of aggregation or the multiple scattering among PPs (Farias, Köylü, and Carvalho Citation1996; Liu et al. Citation2013; Sorensen Citation2001; Yon et al. Citation2008; Sorensen et al. Citation2018), which have concluded that the RDGFA approximation generally underpredicts the aggregate absorption cross section by up to about 30% for freshly-emitted soot aggregates.
The purple solid curve marks the lower limit of E(m) of 0.32 as determined from the average value of recently measured MAC at 550 nm, i.e., 8.0 m2/g ( and ), and the deviation based on the RDGFA approximation with the correction factor h is given below. Based on the maximum errors of the RDGFA approximation (30%) from the literature discussed above, the accurate MAC (as predicted using numerically accurate methods with the correct refractive index, here the measured MAC is treated as the accurate value) can be related to the approximate RDGFA MAC using the correction factor h given in EquationEq. (5)(5)
(5)
(10)
(10)
where
≤ 1.3. We reiterate that h is not a universal constant applicable to any BC particles or any wavelengths. Instead, h is a function of BC particle morphological parameters, structure defects (PP overlapping, necking, polydispersity, and surface roughness etc.), wavelength, and even the refractive index. All of these effects have been estimated in the literature and it has been found that 0.9 < h < 1.3 over a wide range of BC particle size and refractive index for wavelengths in the visible and near infrared spectra (Yon et al. Citation2008; Yon et al. Citation2014; Sorensen et al. Citation2018). Substitution of EquationEq. (4)
(4)
(4) into EquationEq. (10)
(10)
(10) leads to
(11)
(11)
We emphasize that in EquationEq. (11)(11)
(11) E(m) is the true absorption function of the mature soot material and the effect of various factors mentioned above on MAC has been taken into account in the correction factor h. Using the average value of the recently measured MAC of mature soot at 550 nm (8.0 ± 0.7 m2/g) and the constraint h ≤ 1.3, it is readily shown that
(12)
(12)
It is worth pointing out that the E(m) value corresponding to MAC = 8 m2/g without considering the correction factor h (h = 1), i.e., ERDG, would be 0.42, which is close to the upper limit of the measurements, ERDG discussed in Section 4. This estimated lower limit of E(m) (0.32) is close to the lower limit of measured ERDG (0.35) of mature soot in the visible and near infrared discussed in Section 4, confirming the consistency between the present numerical and theoretical analysis and the measured absorption properties of mature soot in terms of MAC at 550 nm and ERDG in the visible and infrared.
Also plotted in are five representative soot refractive indices of mature soot from the literature and the associated values of E(m). It is evident that m recommended by Bond and Bergstrom (Citation2006) has the lowest value of E(m) among the five m and significantly lower than the lower limit of E(m) of 0.32 estimated above (even below the value of mean minus one standard deviation). It is therefore suggested that the m recommended by Bond and Bergstrom (Citation2006) is inaccurate, and contributes to the under-prediction of MAC at 550 nm in recent numerical efforts (as discussed in Section 5). As another example of m leading to a too-low E(m), we also plot m = 1.57 + 0.56i, a value widely used in the combustion community (Smyth and Shaddix Citation1996), which also leads to an E(m) that is too low to be consistent with measurements of ERDG and MAC. In contrast, the m derived by Yon, Bescond, and Liu (Citation2015) at 532 nm produces an E(m) value close to the required lower limit. However, among the five refractive indices considered, only the m values determined by Williams et al. (Citation2007) and Bescond et al. (Citation2016) yield E(m) values that fall above the lower limit and within the range of the measured values discussed in Sections 3 and 4. The m of Bescond et al. (Citation2016) shown in is for the ethylene flame soot, which is considered mature, at 632 nm. It is worth pointing out that Bescond et al. (Citation2016) incorporated correction factors of absorption and scattering to the RDGFA approximation in the interpretation of their extinction measurements for the determination of m from different sources. For this reason, their results are considered more reliable than previous studies that used the original RDGFA approximation (h = 1 in EquationEq. 5(5)
(5) ).
Although we are unable to recommend a single value for m based on absorption measurements alone, either MAC or ERDG, we can state that m in the visible and near infrared must satisfy EquationEq. (12)(12)
(12) , which serves as a necessary condition. To uniquely determine m, an additional constraint related to scattering measurements is required, along with a precisely specified BC particle morphology and size distribution. Such constraints may be provided by measurements of light scattering or extinction, or by relationships such as the Lorentz-Drude dispersion law or Kramers-Kronig relations (Bescond et al. Citation2016).
7. Conclusions
The recently measured MAC of freshly emitted BC particles at 550 nm and RDGFA-based soot absorption function ERDG of mature soot in the visible and near infrared were reviewed. It was shown that the recently measured MAC values in general support the recommended value of 7.5 ± 1.2 m2/g by Bond and Bergstrom (Citation2006), but the average value of recent measurements is somewhat higher at 8.0 ± 0.7 m2/g (p > 0.26), which in turn suggest a lower limit of E(m) of 0.32 ± 0.03 as derived from the RDGFA approximation along with its known upper error bound of 30% for the prediction of soot aggregate absorption cross section. We also reviewed literature values of ERDG of mature soot and show that they fall in the range of 0.35 to about 0.4 and display negligible spectral dependence in the visible and near infrared. Recasting these ERDG values in terms of MAC via the RDGFA approximation shows that the literature studies on these two parameters are in good agreement.
Modeling studies employing numerically accurate methods have consistently under-predicted the MAC of BC aggregates when using a refractive index of m = 1.95 + 0.79i (or equivalent values on the void-fraction line), as recommended by Bond and Bergstrom (Citation2006), and the well-established mass density of mature soot. These studies have under-predicted the 550 nm MAC by about 30%. This suggests that either the Bond and Bergstrom (Citation2006) m is inaccurate, or that the representations of BC within those models are inadequate. Uncertainty in the BC density is well-constrained by measurements and cannot be implicated in the under-prediction of MAC. We evaluate the consistency of different values of m with measured E(m) (ERDG) and the lower bound of E(m) estimated from the mean value of recently measued MAC at 550 nm the upper bound of the RDGFA approximmation by plotting E(m) contours on the n-k plane, which allows different BC refractive indices to be evaluated in the context of absorption measurements. MAC measurements can also be plotted on this plane using the RDGFA theory, together with a correction factor between 0.9 and 1.3. According to this plot, the m of mature soot in the visible and near infrared is expected to satisfy 0.32 < E(m) < 0.4. This condition serves as a necessary condition to check the validity of mature soot refractive index in the visble and near infrared spectra. The corresponding values of n and k are expected to lie within a sector where 1.5 < n < 1.86 and 0.68 < k < 1 and are constrained by 0.32 < E(m) < 0.4.
While some literature values of m fall within the range of plausible E(m) values, such as 1.75 + 1.03i (Williams et al. Citation2007) and 1.55 + 0.86i (Bescond et al. Citation2016), the Bond and Bergstrom (Citation2006) m of 1.95 + 0.79i does not. This statement is also true for other values of m on the Bond and Bergstrom (Citation2006) void fraction line, since variation along this line does not correspond to substantial variation in E(m). We acknowledge that BC from different samples may have different refractive indices due to variations in the BC molecular structures and/or compositions.
We emphasize that our proposed constraint of E(m) ≥ 0.32 does not fully constrain the complex refractive index of mature soot, since the refractive index m = n + ki consists of two free parameters. Additional measurements of the light-scattering properties of a BC sample would be required to uniquely constrain its refractive index. Moreover, even for mature soot, the true refractive index of different samples may vary within a certain range due to variations in the microstructure and compositions. Combined experimental and numerical studies are urgently needed under well-defined and highly controlled conditions to determine the refractive indices of mature soot BC particles in their native aerosol phase in the visible and near-infrared spectra.
The consistency between recent measurements of MAC and ERDG discussed in this study and MAC measurements previously summarized by Bond and Bergstrom (Citation2006) suggests confidence in our knowledge of BC MAC at 550 nm. In contrast, numerically accurate techniques using the refractive index recommended by Bond and Bergstrom (Citation2006) have not been able to accurately predicted the measured MAC, indicating that either the numerical models or the refractive index remain inaccurate.
Acknowledgments
Part of this work was performed on computing resources provided by CRIANN (Normandy, France).
Funding
The financial support of this work by NRCan PERD through TR3 Projects 3B03.0002B and EIP Project EU-TR3-04A is greatly acknowledged.
References
- Bescond, A., J. Yon, F.-X. Ouf, C. Rozé, A. Coppalle, P. Parent, D. Ferry, and C. Laffon. 2016. Soot optical properties determined by analyzing extinction spectra in the visible near-UV: Toward an optical speciation according to constituents and structure. J. Aerosol Sci. 101:118–132. doi:10.1016/j.jaerosci.2016.08.001.
- Bladh, H., J. Johnsson, N.-E. Olofsson, A. Bohlin, and P.-E. Bengtsson. 2011. Optical soot characterization using two-color laser-induced incandescence (2C-LII) in the soot growth region of a premixed flat flame. Proc. Combust. Inst. 33(1):641–648. doi:10.1016/j.proci.2010.06.166.
- Bohren, C. F., and D. R. Huffman. 1983. Absorption and scattering of light by small particles. New York: John Wiley & Sons.
- Bond, T. C. 2001. Spectral dependence of visible light absorption by carbonaceous particles emitted from coal combustion. Geo. Res. Lett. 28(21):4075–4078. doi:10.1029/2001GL013652.
- Bond, T. C., and R. W. Bergstrom. 2006. Light absorption by carbonaceous particles: An investigative review. Aerosol Sci. Technol. 40(1):27–67. doi:10.1080/02786820500421521.
- Bond, T. C., S. J. Doherty, D. W. Fahey, P. M. Forster, T. Berntsen, B. J. DeAngelo, M. G. Flanner, S. Ghan, B. Kärcher, D. Koch, et al. 2013. Bounding the role of black carbon in the climate system: a scientific assessment. J. Geophys. Res. Atmos 118(11):5380–5552. doi:10.1002/jgrd.50171.
- Bouvier, M., J. Yon, G. Lefevre, and F. Grisch. 2019. A novel approach for in-situ soot size distribution measurement based on spectrally resolved light scattering. J. Quant. Spectrosc. Radiat. Transf. 225:58–68. doi:10.1016/j.jqsrt.2018.12.018.
- Chang, H., and T. T. Charalampopoulos. 1990. Determination of the wavelength dependence of refractive indices of flame soot. Proc. R. Soc. London A 430(1880):577–591. doi:10.1098/rspa.1990.0107.
- Choi, M. Y., G. W. Mulholland, A. Hamins, and T. Kashiwagi. 1995. Comparisons of the soot volume fraction using gravimetric and light extinction techniques. Combust. Flame 102(1-2):161–169. doi:10.1016/0010-2180(94)00282-W.
- Corbin, J. C., H. Czech, D. Massabo, F. Buatier de Mongeot, G. Jakobi, F. Liu, P. Lobo, C. Mennucci, A. A. Mensah, J. Orasche, et al. 2019. Infrared-absorbing carbonaceous tar can dominate light absorption by marine-engine exhaust. NPJ Climate and Atmospheric Climate Sci 2:12. doi:10.1038/s41612-019-0069-5.
- Coderre, A. R., K. A. Thomson, D. R. Snelling, and M. R. Johnson. 2011. Spectrally resolved light absorption properties of cooled soot from a methane flame. appl. Physics B 104(1):175–188. doi:10.1007/s00340-011-4448-9.
- Cross, E. S., T. B. Onasch, A. Ahern, W. Wrobel, J. G. Slowik, J. Olfert, D. A. Lack, P. Massoli, C. D. Cappa, J. P. Schwarz, et al. 2010. Soot particle studies – instrument inter-comparison – project overview. Aerosol sci. technol. 44(8):592–611. doi:10.1080/02786826.2010.482113.
- Dastanpour, R., A. Momenimovahed, K. Thomson, J. Olfert, and S. Rogak. 2017. Variation of the optical properties of soot as a function of particle mass. Carbon 124:201–211. doi:10.1016/j.carbon.2017.07.005.
- Draine, B., and P. J. Flatau. 2010. User guide to the discrete dipole approximation code DDSCAT 7.1.
- Durdina, L., P. Lobo, M. B. Trueblood, E. A. Black, S. Achterberg, D. E. Hagen, B. T. Brem, and J. Wang. 2016. Response of real-time black carbon mass instruments to mini-CAST soot. Aerosol sci. technol. 50(9):906–918. doi:10.1080/02786826.2016.1204423.
- Farias, T. L., Ü. Ö. Köylü, and M. G. Carvalho. 1996. Range of validity of the Rayleigh-Debye-Gans theory for optics of fractal aggregates. Appl. Opt. 35(33):6560–6567. doi:10.1364/AO.35.006560.
- Ferge, T., E. Karg, A. Schröppel, K. R. Coffee, H. J. Tobias, M. Frank, E. E. Gard, and R. Zimmermann. 2006. Fast determination of the relative elemental and organic carbon content of aerosol samples by on-line single-particle aerosol time-of-flight mass spectrometry. Environ. Sci. Technol. 40(10):3327–3335. doi:10.1021/es050799k.
- Forestieri, S. D., T. M. Helgestad, A. T. Lambe, L. Renbaum-Wolff, D. A. Lack, P. Massoli, E. S. Cross, M. K. Dubey, C. Mazzoleni, J. S. Olfert, et al. 2018. Measurement and modeling of the multiwavelength optical properties of uncoated flame-generated soot. Atmos. Chem. Phys. 18(16):12141–12159. doi:10.5194/acp-18-12141-2018.
- Johansson, K. O., F. El Gabaly, P. E. Schrader, M. F. Campbell, and H. A. Michelsen. 2017. Evolution of maturity levels of the particle surface and bulk during soot growth and oxidation in a flame. Aerosol sci. technol. 51(12):1333–1344. doi:10.1080/02786826.2017.1355047.
- Hinds, W. C. 1999. Aerosol technology, properties, behaviour, and measurement of airborne particles. New York: John Wiley & Sons, Inc.
- Kahnert, M. 2010a. Modelling the optical and radiative properties of freshly emitted light absorbing carbon within an atmospheric chemical transport model. Atmos. Chem. Phys 10(3):1403–1416. doi:10.5194/acp-10-1403-2010.
- Kahnert, M. 2010b. On the discrepancy between modeled and measured mass absorption cross section of light absorbing carbon aerosols. Aerosol Sci. Technol. 44(6):453–460. doi:10.1080/02786821003733834.
- Kahnert, M., and A. Devasthale. 2011. Black carbon fractal morphology and short-wave radiative impact: A modelling study. Atmos. Chem. Phys. 11(22):11745–11759. doi:10.5194/acp-11-11745-2011.
- Khalizov, A. K., H. Xue, L. Wang, J. Zheng, and R. Zhang. 2009. Enhanced light absorption and scattering by carbon soot aerosol internally mixed with sulfuric acid. J. Phys. Chem. A 113(6):1066–1074.
- Liu, L., and M. I. Mishchenko. 2005. Effects of aggregation on scattering and radiative properties of soot aerosols. J. Geophys. Res. 110(D11):D11211.
- Liu, F., C. Wong, D. R. Snelling, and G. J. Smallwood. 2013. Investigation of absorption and scattering properties of soot aggregates of different fractal dimension at 532 nm using RDG and GMM. Aerosol sci. technol. 47(12):1393–1405. doi:10.1080/02786826.2013.847525.
- López-Yglesias, X., P. E. Schrader, and H. A. Michelsen. 2014. Soot maturity and absorption cross sections. J. Aero. Sci 75:43–64. doi:10.1016/j.jaerosci.2014.04.011.
- Mackowski, D. W., and M. I. Mishchenko. 1996. Calculation of the T matrix and the scattering matrix of ensembles of spheres. J. Opt. Soc. Am. A 13(11):2266–2278. doi:10.1364/JOSAA.13.002266.
- Maricq, M. M. 2014. Examining the relationship between black carbon and soot in flames and engine exhaust. Aerosol sci. technol. 48(6):620–629. doi:10.1080/02786826.2014.904961.
- Michelsen, H. A., C. Schulz, G. J. Smallwood, and S. Will. 2015. Laser-induced incandescence: Particulate diagnostics for combustion, atmospheric, and industrial applications. Prog. Energy Combust. Sci 51:2–48. doi:10.1016/j.pecs.2015.07.001.
- Michelsen, H. A. 2017. Probing soot formation, chemical and physical evolution, and oxidation: A review of in situ diagnostic techniques and needs. Proc. Combust. Inst. 36(1):717–735. doi:10.1016/j.proci.2016.08.027.
- Mishchenko, M. I. 2009. Electromagnetic scattering by nonspherical particles: A tutorial review. J. Quant. Spectrosc. Radiat. Transf. 110(11):808–832. doi:10.1016/j.jqsrt.2008.12.005.
- Moosmüller, H., and W. P. Arnott. 2009. Particle optics in the rayleigh regime. J Air Waste Manag Assoc 59(9):1028–1031. doi:10.3155/1047-3289.59.9.1028.
- Moosmüller, H., R. K. Chakrabarty, K. M. Ehlers, and W. P. Arnott. 2011. Absorption ångström coefficient, brown carbon, and aerosols: Basic concepts, bulk matter, and spherical particles. Atmos. Chem. Phys 11(3):1217–1225. doi:10.5194/acp-11-1217-2011.
- Mullins, J., and A. Williams. 1987. The optical properties of soot: A comparison between experimental and theoretical values. Fuel 66(2):277–280. doi:10.1016/0016-2361(87)90255-9.
- Park, K., D. B. Kittelson, and P. H. McMurry. 2004. Structural properties of diesel exhaust particles measured by transmission electron microscopy (TEM): Relationships to particle mass and mobility. Aerosol sci. Technol. 38(9):881–889. doi:10.1080/027868290505189.
- Petzold, A., J. A. Ogren, M. Fiebig, P. Laj, S.-M. Li, U. Baltensperger, T. Holzer-Popp, S. Kinne, G. Pappalardo, N. Sugimoto, C. Wehrli, A. Wiedensohler, and X.-Y. Zhang. 2013. Recommendations for reporting “black carbon” measurements. Atmos. Chem. Phys 13(16):8365–8379. doi:10.5194/acp-13-8365-2013.
- Radney, J. G., R. You, X. Ma, J. M. Conny, M. R. Zachariah, J. T. Hodges, and C. D. Zangmeister. 2014. Dependence of soot optical properties on particle morphology: measurements and model comparisons. Environ. Sci. Technol. 48(6):3169–3176. doi:10.1021/es4041804.
- Scarnato, B. V., S. Vahidinia, D. T. Richard, and T. W. Kirchstetter. 2013. Effects of internal mixing and aggregate morphology on optical properties of black carbon using a discrete dipole approximation model. Atmos. Chem. Phys 13(10):5089–5101. doi:10.5194/acp-13-5089-2013.
- Scarnato, B. V., S. China, K. Nielsen, and C. Mazzoleni. 2015. Perturbations of the optical properties of mineral dust particles by mixing with black carbon: a numerical simulation study. Atmos. Chem. Phys 15(12):6913–6928. doi:10.5194/acp-15-6913-2015.
- Smith, F. W. 1984. Optical constants of a hydrogenated amorphous carbon film. J. appl. Phys 55(3):764–771. doi:10.1063/1.333135.
- Smyth, K. C., and C. R. Shaddix. 1996. The elusive history of m∼=1.57 – 0.56i for the refractive index of soot. Combust. Flame 107(3):314–320. doi:10.1016/S0010-2180(96)00170-8.
- Snelling, D. R., K. A. Thomson, G. J. Smallwood, and Ö. L. Gülder. 1999. Two-dimensional imaging of soot volume fraction in laminar diffusion flames. Appl. Opt. 38(12):2478–2485. doi:10.1364/AO.38.002478.
- Snelling, D. R., K. A. Thomson, G. J. Smallwood, Ö. L. Gülder, E. J. Weckman, and R. A. Fraser. 2002. Spectrally resolved measurement of flame radiation to determine soot temperature and concentration. AIAA J. 40(9):1789–1795. doi:10.2514/3.15261.
- Snelling, D. R., F. Liu, G. J. Smallwood, and Ö. L. Gülder. 2004. Determination of the soot absorption function and thermal accommodation coefficient using low-fluence LII in a laminar coflow ethylene diffusion flame. Combust. Flame 136(1/2):180–190. doi:10.1016/j.combustflame.2003.09.013.
- Snelling, D. R., K. A. Thomson, F. Liu, and G. J. Smallwood. 2009. Comparison of LII derived soot temperature measurements with LII model predictions for soot in a laminar diffusion flame. Appl. Physics B 96(4):657–669. doi:10.1007/s00340-009-3614-9.
- Snelling, D. R., R. A. Sawchuk, G. J. Smallwood, and K. A. Thomson. 2015. Measurement of soot concentration and bulk fluid temperature and velocity using modulated laser-induced incandescence. Appl. Physics B 119(4):697–707. doi:10.1007/s00340-015-6107-z.
- Sorensen, C. M. 2001. Light scattering by fractal aggregates: A review. Aerosol Sci. Tech. 35(2):648–687. doi:10.1080/02786820117868.
- Sorensen, C. M., J. Yon, F. Liu, J. Maughan, W. R. Heinson, and M. J. Berg. 2018. Light scattering and absorption by fractal aggregates including soot. J. Quant Spectrosc. Radiative Transfer 217:459–473. doi:10.1016/j.jqsrt.2018.05.016.
- Török, S., V. B. Malmborg, J. Simonsson, A. Eriksson, J. Martinsson, M. Mannazhi, J. Pagels, and P.-E. Bengtsson. 2018. Investigation of the absorption ångström exponent and its relation to physicochemical properties for mini-CAST soot. Aerosol sci. technol. 52(7):757–767. doi:10.1080/02786826.2018.1457767.
- Vander Wal, R. L., V. M. Bryg, and C. H. Huang. 2014. Insights into the combustion chemistry within a gas-turbine driven auxiliary power unit as a function of fuel type and power level using soot nanostructure as a tracer. Fuel 115:282–287. doi:10.1016/j.fuel.2013.07.011.
- Williams, T. C., C. R. Shaddix, K. A. Jensen, and J. M. Suo-Anttila. 2007. Measurement of the dimensionless extinction coefficient of soot within laminar diffusion flames. Int. J. Heat Mass Transfer 50(7/8):1616–1630. doi:10.1016/j.ijheatmasstransfer.2006.08.024.
- Wu, J.-S., S. S. Krishnan, and G. M. Faeth. 1997. Refractive indices at visible wavelengths of soot emitted from buoyant turbulent diffusion flames. ASME J. Heat Transf. 119(2):230–237. doi:10.1115/1.2824213.
- Wu, Y., T. Cheng, L. Zheng, and H. Chen. 2015. A study of optical properties of soot aggregates composed of poly-disperse monomers using the superposition T-matrix method. Aerosol sci. technol. 44:941–949. doi:10.1080/02786826.2015.1083938.
- Xu, Y.-L. 1995. Electromagnetic scattering by an aggregate of spheres. Appl Opt. 34(21):4573–4588. doi:10.1364/AO.34.004573.
- Yon, J., C. Rozé, T. Girasole, A. Coppalle, and L. Mees. 2008. Extension of RDG-FA for scattering prediction of aggregates of soot taking into account interactions of large monomers. Part. Part. Syst. Charact 25(1):54–67. doi:10.1002/ppsc.200700011.
- Yon, J., F. Liu, A. Bescond, C. Caumont-Prim, C. Rozé, F.-X. Ouf, and A. Coppalle. 2014. Effects of multiple scattering on radiative properties of soot fractal aggregates. J. Quant. Spectrosc. Radiat. Transf. 133:374–381. doi:10.1016/j.jqsrt.2013.08.022.
- Yon, J., A. Bescond, and F. Liu. 2015. On the radiative properties of soot aggregates part 1: Necking and overlapping. J. Quant. Spectrosc. Radiat. Transf. 162:197–206. doi:10.1016/j.jqsrt.2015.03.027.
- Yon, J., F. Liu, J. Morán, and A. Fuentes. 2019. Impact of the primary particle polydispersity on the radiative properties of soot aggregates. proc. Combustion inst. 37(1):1151–1159. doi:10.1016/j.proci.2018.07.065.
- Zangmeister, C. D., R. You, E. M. Lunny, A. E. Jacobson, M. Okumura, M. R. Zachariah, J. T. Hodges, and J. G. Radney. 2018. Measured in-situ mass absorption spectra for nine forms of highly-absorbing carbonaceous aerosol. Carbon 136:85–93. doi:10.1016/j.carbon.2018.04.057.
- Zhang, R., A. F. Khalizov, J. Pagels, D. Zhang, H. Xue, and P. H. McMurry. 2008. Variability in morphology, hydroscopicity, and optical properties of soot aerosols during atmospheric processing. PNAS 105(30):10291–10296. doi:10.1073/pnas.0804860105.
- Zhu, J., M. Y. Choi, G. W. Mulholland, S. L. Manzello, L. A. Gritzo, and J. Suo-Anttila. 2002. Measurement of visible and near-IR optical properties of soot produced in laminar flames. Proc. Comb. Inst. 29(2):2367–2374. doi:10.1016/S1540-7489(02)80288-7.
- Zhu, J., A. Irrera, M. Y. Choi, G. W. Mulholland, J. Suo-Anttila, and L. A. Gritzo. 2004. Measurement of light extinction constant of JP-8 soot in the visible and near-infrared spectrum. Int. J. Heat Mass Transf. 47(17/18):3643–3648. doi:10.1016/j.ijheatmasstransfer.2004.04.013.