
 ?Mathematical formulae have been encoded as MathML and are displayed in this HTML version using MathJax in order to improve their display. Uncheck the box to turn MathJax off. This feature requires Javascript. Click on a formula to zoom.
Abstract
A differential mobility analyzer for high-mobility resolution (1/FWHM∼30) classification of 1–67 nm particles is designed to analyze viral particles. Inner and outer electrode radii of 1.01 and 2 cm (at the outlet slit) and a 11.6 cm long column achieve this range at a sheath gas flow (Q) and aerosol flow (q) of 30 and 1 L/min. Turbulent transition potentially resulting from this substantial length combined with high sheath gas flow rates (Q∼1000 Lit/min) required to classify 1 nm particles is avoided by stabilizing the flow via a continuous acceleration with a conical inner electrode (1° half-angle). High axisymmetry of the aerosol flow as it joins the sheath gas is achieved by injecting it through a circularizer ring with 24 symmetrically spaced orifices. The sheath flow is laminarized with two pre-laminarization schemes, three laminarization screens, and an inlet trumpet with an area ∼3 times the analyzer channel throat area. The instrument is tested with singly charged monomobile cluster ions produced by a bipolar electrospray source. A resolving power of 29 is measured at the highest flow rate reached, with a trend towards even higher resolution if either Q or the monomobile particle size could be increased. This performance indicates that the electrode concentricity is excellent and the flow highly stable. Tests carried out at limited resolution (set below 16 by a protein test aerosol) with the modest Q/q∼30 values required to classify 70 nm particles indicate that the DMA response is close to ideal at Q = 151, 110, and 47 Lit/min.
Copyright © 2019 American Association for Aerosol Research
EDITOR:
1. Introduction
The Differential Mobility Analyzer (DMA) has been for many decades a widely used tool for size classification and analysis of submicron particles (Knutson and Whitby Citation1975), especially in the size range below 100 nm. Most often, the wide size range spanned by aerosols and the lack of sharp features at specific sizes makes it either unpractical or unnecessary to analyze them with high resolution. High resolution DMAs have demonstrated their utility in the size range of molecules, clusters and macromolecules (1–10 nm), where discrete compositions exist. In order to minimize diffusion broadening, these instruments require unusually large flows Q of sheath gas and relatively short column lengths L. As a result, their size range has been limited to below 10 nm, though certain resolution compromises have recently extended it to ∼30 nm. There are, however, situations where high resolution would be useful in atmospheric and laboratory studies, as long as it is compatible with covering the size range from 1 to 100 nm. One example motivating the present development is size-analysis of viral particles via electrospray (Fenn et al. Citation1989), charge-reduction and DMA classification (Kaufman et al. Citation1996), where proof of concept has been available for some time (Kallinger et al. Citation2013; Bereszczak et al. Citation2014; You et al. Citation2014; for a recent review see Fernandez-Garcia et al. Citation2019). There are however two practical challenges that need to be separately resolved. One is the development of improved liquid purification (Wick Citation2015), electrospraying, and charge reduction protocols for viral solutions. The other is the development of DMAs with high resolving power in the 20–100 nm size range. Such DMAs would provide a much-needed feedback to optimize the liquid purification, electrospraying, and charge reduction protocols to maximize the monodispersity of the viral aerosol. However, even if one succeeded at developing a high-resolution 20–100 nm DMA, the lack of narrow size standards would make it difficult to assess reliably its actual resolving power. This hurdle is partially tackled in the present study with an instrument capable of operating laminarly under an uncommonly wide range of sheath gas and aerosol flow rates, such that possible nonidealities in various aspects of the flow or the DMA geometry may be tested at very high flow rates (∼1000 Lit/min) with monomobile cluster standards, even though the design flow rates for viral studies are much smaller (∼30 L/min). Complementary experiments at Q values typical of virus classification conditions are described in section 5.
2. Design considerations
2.1. Critical dimensions
A sketch of the new axially symmetric DMA tested, nicknamed the Perez DMA, is given in , with key figure components marked in the text within square brackets. Its critical dimensions () include inner and outer radii R1 = 1.01 cm, R2 = 2 cm at the outlet slit [12]. For a resolving power of 30 at an aerosol flow rate q = 1 L/min, the sheath gas flow rate must be Q = 30 Lit/min for large non-diffusing particles. With these dimensions and flow rates we chose a classification length L = 11.6 cm. The inner electrode [9] is conical with a 1° semi-angle, yielding a smaller effective classification length L*= 10.08 cm (Appendix A). Assuming a maximal classification voltage of 10 kV, this DMA spans a size range up to 67 nm.
Figure 1. Cross-sectional sketch of the Perez DMA with key components: [1] NW-40 flange for sheath gas entry. [2] 1st prelaminarization stage (one roughly stretched screen; optional). [3] Perforated inlet plate centering the upstream end of the inner rod. [4] One of 24 openings in the inlet plate allowing passage of the sheath gas. [5] 2nd prelaminarization stage (filtering medium, or roughly stretched screen). [6] Laminarization stage, including three or four well-stretched screens. [7] Nut for tensioning and centering the inner rod. [8] Cylindrical mating surface to center inner rod. [9] Conical inner rod. [10] One of 24 circularizer holes communicating the aerosol flow with the inlet slit. [11] Annular chamber upstream of the circularizer. [12] Outlet slit. [13] One of 18 holes drawing the sheath gas out into the exhaust manifold. [14] NW-40 flange for sheath gas exhaust. [15] Antistatic aerosol outlet tube. [16] Insulating cone for downstream centering of inner rod. [17] Laminarization trumpet. [18] Aerosol inlet tube. [19] Grounded aerosol outlet tube.
![Figure 1. Cross-sectional sketch of the Perez DMA with key components: [1] NW-40 flange for sheath gas entry. [2] 1st prelaminarization stage (one roughly stretched screen; optional). [3] Perforated inlet plate centering the upstream end of the inner rod. [4] One of 24 openings in the inlet plate allowing passage of the sheath gas. [5] 2nd prelaminarization stage (filtering medium, or roughly stretched screen). [6] Laminarization stage, including three or four well-stretched screens. [7] Nut for tensioning and centering the inner rod. [8] Cylindrical mating surface to center inner rod. [9] Conical inner rod. [10] One of 24 circularizer holes communicating the aerosol flow with the inlet slit. [11] Annular chamber upstream of the circularizer. [12] Outlet slit. [13] One of 18 holes drawing the sheath gas out into the exhaust manifold. [14] NW-40 flange for sheath gas exhaust. [15] Antistatic aerosol outlet tube. [16] Insulating cone for downstream centering of inner rod. [17] Laminarization trumpet. [18] Aerosol inlet tube. [19] Grounded aerosol outlet tube.](/cms/asset/df0617c4-c814-417b-8276-02f65656281d/uast_a_1684433_f0001_b.jpg)
Table 1. Some characteristics of the Perez DMA and the 10 cm-Herrmann DMA.
2.2. General geometric and flow requirements
Two features necessary for high resolution are that both the geometry and the flow be highly circularly symmetric. The flow must also be highly steady (laminar) in time. Much may be learned on how to achieve some of these goals by examining the various prototypes developed by Georg Reischl and his students at Vienna, whose attention to aerodynamic detail is as important at moderate flow rates as in high flow rate nano-DMAs (see also Fernandez de la Mora and Kozlowski Citation2013). High flow rate nano-DMAs have been generally short, not providing enough time for flow instabilities to develop into turbulence prior to classification. Their short length has also permitted the use of Reischl’s aerodynamically favorable bullet-shaped inner electrode, supported only on the downstream end (Reischl, Mäkelä, and Necid Citation1997), without serious eccentricity costs. Our high flow DMAs have also employed small radial dimensions, permitting wide inlet trumpets that facilitate laminarization, as well as relatively long downstream diffusers for pressure recovery, without resulting in unduly large instruments.
Unfortunately, many of these simplifying peculiarities are much harder to maintain in DMAs with wide size ranges. A long inner electrode combined with small radial dimensions makes it difficult to keep a high concentricity. This encourages relatively wide radial dimensions (∼1–2 cm rather than a few mm), as well as an inner electrode centered on both ends. This electrode then penetrates through the laminarization screens (without which the flow would be neither spatially uniform not steady in time), complicating their design. This penetration has nonetheless been previously handled both in low flow rate DMAs (TSI models, as well as Reischl models; see Figure 1 of Steiner et al. Citation2010, or Figure 2 of Kallinger et al. Citation2013) as well as high flow rate DMAs (The Rio Arriba design described by Martínez-Lozano and Fernández de la Mora Citation2006).
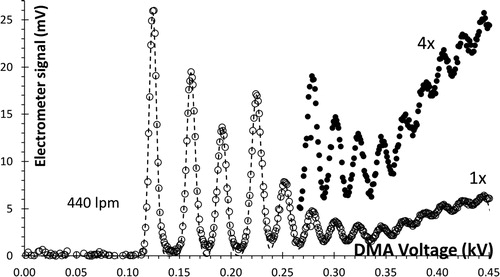
Figure 2. Negative mobility spectrum for a bipolar electrospray of MPI-FAP, resolving over 14 clusters at Q = 440 Lit/min. 1 mV in the vertical scale correspond to 2 fA of ion current. The dashed line fitting the data is a linear superposition of 14 Gaussians.
2.3. Pressure drop
The various flow sections in the sheath gas circuit are collected in . Centimeter wide DMAs are not incompatible with portability as long as one gives up on the wide inlet trumpets and diffusers characteristic of other high flow rate DMAs developed at Yale. High flow DMAs often include a diffuser downstream from the working section in order to achieve pressure recovery. This element was not incorporated here because the wide radial dimensions chosen (R1 = 1.01 cm, R2 = 2 cm) enable modest speeds and pressure drops everywhere. A moderately sized inlet trumpet [17] was nonetheless used, in part for laminarization purposes, but also to avoid excessive pressure drop in the laminarization screens. Given that one or more of the most upstream screens in the laminarizing section [6] must have relatively low open areas of ∼30% to reduce ingested turbulence, we have chosen a ratio of areas of ∼3 from the trumpet entry to the beginning of the working section. This makes the pressure drop in each of these low transparency screens comparable to the dynamic pressure ρu2/2 required to accelerate the sheath gas to its working velocity. Therefore, the total pressure drop in the screens and flow column is ∼3ρu2/2 (0.58% of an atmosphere at Q = 2000 Lit/min).
Table 2. Various flow restrictions in the sheath gas circuit (dimensions in mm).
Other potentially important sources of pressure drop in our design are at the sheath gas inlet and exhaust. Following the Rio Arriba design (Martínez-Lozano and Fernández de la Mora Citation2006), an inlet plate [3] is introduced to precisely center the inner cylinder with respect to the outer cylinder. In order to allow passage of the sheath gas through this plate, it is symmetrically drilled with 24 axially oriented holes, each 8 mm in diameter [4], with an area comparable to that in the screens, and hence little pressure drop. For a flow rate of 2000 Lit/min entering through an NW flange (inner diameter D = 35 mm), the Reynolds number is ReD ∼4Q/(πνD)∼80,000, where ν = 0.15 cm2/s is the kinematic viscosity of ambient air. In some experiments a screen in a first prelaminarization stage [2] was placed upstream of the perforated inlet plate, though this element did not result in observable resolution improvements. For each of the 24 jets formed by the inlet plate holes [4] the Reynolds number is ∼14,736, still carrying a high level of turbulence which the laminarization screens may not sufficiently dissipate. For this reason, we have introduced a second prelaminariation stage [5] immediately downstream from the 24 jets. The outer and inner radii of 42.7 and 17.07 mm in this second stage would provide an area equal to the throat of the working section if its open area were 19%. A filtering medium initially inserted in [5] had substantially less than 19% open area, and dominated the pressure drop. This filter was subsequently substituted by a pair of roughly stretched screens with open areas between 22% and 28%.
The sheath gas is exhausted radially through 18 holes with diameter Ds = 5 mm, drilled symmetrically on the side of the outer electrode [13], at an axial distance ls = 16 mm downstream from the outlet slit [12]. The angular (θ) pressure variation present at the axial location of the holes propagates with the distance x upstream typically as exp[–x/Ds]. This may be readily seen in a potential flow model by separation of variables of the velocity potential as eniθ–λx. As a result, the angular modulation of the gas velocity induced at the slit location does not limit the resolution. This modulation would in any case be further weakened in the vicinity of the more distant inner rod, where the particles being classified would lie. The exhaust area opened by these 18 holes is 2.63 times smaller than the DMA channel throat, representing the real throat or greatest source of pressure drop in the instrument. The flow from these 18 exhaust jets is collected by an annular chamber and pumped out through a single NW-40 port [14]. Note in that the axial path of the sheath gas is blocked by a conical insulator piece [16] centering the inner rod at its downstream end. In an attempt to increase the flow rate, in some experiments, that conical piece was perforated with 14 symmetrically placed holes 5 mm in diameter, oriented parallel to the conical walls. The reduction in pressure drop achieved was minor, probably due to the small discharge coefficient of these holes resulting from the constrained geometry.
2.4. Concentricity
In a short DMA, good concentricity of the light and short inner electrode may be achieved by supporting it (with conical mating surfaces) only on its downstream end (Reischl’s bullet geometry). However, this approach is problematic in the case of the longer and heavier inner electrode in the Perez DMA. Supporting this electrode on both ends with cone-to-cone fittings presents the difficulty that, on assembly, either the top or the bottom centering conical surface will be mated first with its support, leaving the other end dangling. In order for the two ends of the center rod to mate correctly with their support, the contact must either be cylindrical on one end, or one of the two conical mating surfaces must be slightly deformable to yield axially until firm contact is established on both ends. Our first design relied on the second method, partly because it offered a better centering, and also because metal to metal contact is precluded on both ends by the need to isolate electrically the inner rod. This design achieved excellent centering, but was subsequently abandoned due to practical problems with the laminarization screens. The final design then centered the upstream region of the inner rod with a cylindrical mating [8]. A nut [7] on the threaded left end of the inner rod in provides the needed axial stress to center the rod on the conical seats on its downstream end.
2.5. Keeping the flow laminar in a long instrument
Turbulence transition at high Reynolds numbers may be delayed substantially by slightly reducing the channel cross-section, thereby accelerating the flow as it moves downstream (Appendix B). For this reason, our inner electrode is conical with a 1° half angle of divergence. Boundary layer stabilization by a favorable pressure gradient is a well-known phenomenon. It was first exploited by Hoppel (Citation1970) for mobility measurement, and has proven its utility in high resolution mobility analysis (Fernandez de la Mora Citation2002), though not previously with the small rate of area variation used here. The effectiveness of this approach will be confirmed by the ability of this long DMA to keep the flow laminar at sheath gas flow rates above 1000 Lit/min. In spite of this acceleration, numerical analysis shows that relatively wide boundary layers develop in the vicinity of both electrodes.
2.6. Keeping the aerosol inlet flow highly axisymmetric
A critical feature in DMAs operating under moderate aerosol to sheath flow rate ratios q/Q (>3%) is the need to distribute the aerosol flow uniformly along the slit circumference. Otherwise the local q/Q value may be several times larger than the average in the region of the inlet slit closest to the connection to the tube bringing the aerosol flow into the DMA [18]. As a result, the resolving power would be considerably smaller than the ideal Q/q ratio appearing in the Knutson-Whitby (Citation1975) transfer function for matched inlet/outlet aerosol flows. We have addressed this problem especially for the present instrument via a circularizer ring [10] intermediate between a first annular region connected to the aerosol inlet tube, and a second annular region upstream the inlet slit where the aerosol flow merges with the sheath gas. The circularizer ring is a plate orthogonal to the DMA axis. It includes 24 symmetrically distributed axial perforations [10], through which the aerosol flow passes from a first to a second annular region. Since the pressure is relatively uniform (by design) in the first annular region, all 24 holes pass approximately the same flow rate.
Although the circularizer concept was first developed for the present instrument, it has been successfully tested in a preexisting DMA that could be quickly modified while the Perez DMA was being designed and fabricated (Fernandez de la Mora Citation2017). Other DMAs (the Vienna UDMA and TSI’s 3085, for example) have previously achieved axisymmetric aerosol flows by introducing the sample through the symmetry axis, but this arrangement results in high inlet losses for 1 nm particles.
2.7. Antistatic outlet tube
Following the outlet slit, the monodisperse aerosol is efficiently transferred from the high voltage at the inner rod to the grounded outer DMA casing by an antistatic tube [15] previously used in a Half-Mini DMA (Attoui and Fernandez de la Mora Citation2016). The inner diameter of our tube is identical to that previously studied, with about half its length. Because the DMA voltages are considerably smaller here for the same particle size, even under the most unfavorable conditions, the losses here should accordingly be even smaller than the slight losses reported by Attoui and Fernandez de la Mora (Citation2016).
3. Experimental methods
The DMA was designed at Yale and was produced by the NanoEngineering Corporation, primarily for virus and virus-like particle diagnosis in the 20–70 nm size range. Three or four nylon laminarization screens [6] with open areas varying from 28% to 49% were glued under tension to three pairs of outer and inner supporting ring frames. The sheath gas flow was most of the time operated in recirculating mode, with a blower (with stabilized rotation speed) followed by an air-cooled heat exchanger. In these tests, the aerosol flow (q = 2–5 Lit/min) entering the DMA was controlled by a rotameter and was automatically matched to the exiting monodisperse particle flow. This gas was air from a laboratory compressor, dried by flowing through a silica gel bed and passed through a HEPA filter. The air flow went through a bipolar electrospray source previously described (Fernandez de la Mora and Barrios Citation2017), where positive and negative electrosprays of alcohol solutions of the same salt [A+B–] interact, producing dominantly singly charged clusters with the general composition [A+n ± 1B–n]±1. Therefore, all mobility spectra shown in this study correspond to almost exclusively singly charged ions of either polarity. Two of the salts previously recommended to yield excellent mobility calibration standards were used here: 1-Methyl-3-pentylimidazolium-tris(pentafluoroethyl)PF3 (MPI-FAP, from Merk) and 1-Ethyl-3-methylimidazolium-tris(trifluoromethylsulphonyl) Methide (EMI-Methide, from Covalent).
In order to achieve increased flow rates in early experiments where the second prelaminarization stage [5] used a filter medium of relatively high resistance, the sheath gas circuit was open, with laboratory air entering freely into a first blower through a HEPA filter, going through the cooler into the DMA, passing into a second blower, and back to the atmosphere. In these experiments the two blowers in series were run near their maximum power, consuming about 1 kW each. The pressure inside the DMA was up to 110 mb below 1 atmosphere, complicating the stable bipolar source operation. In spite of these difficulties, the experiment permitted comparing the laminarization effectiveness of the filter to that of screens with greater open area at comparably high flow rates, establishing the ability to achieve a resolving power of at least 29. This provided assurance of (i) the excellent concentricity attained; (ii) the effectiveness of the conical center rod to stabilize the flow at flow rates close to 1000 Lit/min, and (iii) the overall correctness of the aerodynamic design. Similar tests substituting the upstream laminarization filter by screens of greater open area yielded comparable flow rates and resolving powers with a single pump.
The monodisperse aerosol flow was detected by a recently described electrometer (Fernandez de la Mora et al. Citation2017) commercialized by SEADM, having an unusually fast response (20 ms half-height rise time) 1012 V/Amp amplification and an exceptionally low noise level (∼0.1 fA). The slightly inferior amplifier circuit used for the present measurements had half that amplification (based on the nominal 0.5 × 10¹² Ω of the amplifying resistance), with an expected rise time half that in the commercial electrometer. However, we did not directly measure either the response time or the gain. The amplifier inverts the signal, giving negative voltages for positive ions. The high voltage is applied to the inner rod with the outer electrode being grounded for safety. Accordingly a positive ion spectrum will span negative voltages and currents.
Once the DMA flow rates were fixed manually, a computer run program scanned over the DMA voltage (applied to the inner rod) and recorded the electrometer current. The voltage scan was discrete, with typical voltage jumps of 2–5 V and dwell times from 0.1 s to 1 s, during which the signal was averaged to a single datum at 250 ksamples/s. The wait time between measurements was much smaller (<10 ms) thanks to the fast response time of the high voltage power supply and the moderate residence time of charged particles in the working section (10 ms at 500 Lit/min). A typical mobility spectrum is shown in for the negative part of the bipolar mobility spectrum of MPI-FAP. The first peak on the left is associated with the bare FAP– anion, while each of the subsequent peaks to its right add one neutral ion pair MPI-FAP to the prior peak. The resolution associated with a given peak is defined as 1/FWHM, where FWHM is the voltage width at half peak height normalized by the peak voltage. Note the nonstandard notation: FWHM is often used as the dimensional width (say in Volts or in cm2/V/s), while the dimensionless FWHM is often referred to as nFWHM. 1 mV in the vertical scale of corresponds to 2 fA. The rise of the largest clusters over the background signal due to neighboring clusters is less than 2 fA (see filled black symbols, at a scale magnified fourfold), but the noise level is small enough for these tiny peaks to be clearly seen.
4. Experimental results
shows that, when run with a filtering medium in [5] at the maximum flow rate delivered by one blower, the Perez DMA is able to resolve more than 14 negative MPI-FAP cluster peaks. Up to 41 clusters of this salt were previously distinguished in a half-mini DMA designed to operate with 1 nm particles. While the present much longer DMA is not designed to classify such small particles, its singular ability to handle rather high flow rates yields a resolving power between 21 and 22 for the largest clusters resolved. Note that the ratio Q/q ∼100, so the theoretically expected resolution is not limited by the sample gas flow.
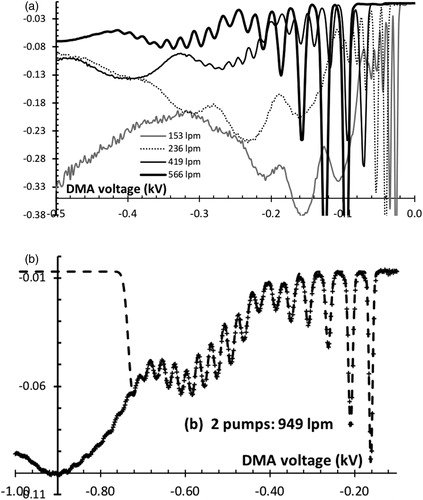
shows the positive-ion sides of bipolar mobility spectra for EMI-Methide at varying sheath gas flow rate, also using the filtering medium in [5]. Although the clusters are all singly charged, one sees broad modulations with unresolved peaks, each associated with the original charge state of the clusters prior to charge reduction (Gamero-Castaño and Fernandez de la Mora Citation2000a, 2000b). In other words, the first broad modulation corresponds to originally singly charged ions, the second to larger originally doubly charged ions, etc. At Q ≤ 236 Lit/min, only ions in the first modulation are resolved. For 419 ≤ Q (lit/min) ≤ 566, ions in the second modulation are also resolved. For Q = 949 Lit/min (b), ions in the third modulation are also partly resolved. As in , the ratio Q/q ∼100 is not expected to have a limiting effect in the measured resolution.
Figure 3. Positive mobility spectra for EMI-Methide at various indicated sheath gas flows Q, with one (a) or two pumps (b). Data in (b) are shown as crosses, while the dashed line is a superposition of 17 Gaussians fitting the 17 most mobile experimental peaks. The vertical scale is in V, 1 mV corresponding to 2 fA of ion current.
The continuous line of is a linear superposition of 14 Gaussians fitting the data, from which we determine the resolutions shown in . The straight dashed line going through the origin is a fit to the 4 most mobile ionic peaks. It is motivated by the fact that the resolution limited by diffusion alone is strictly linear with (zeV/kBT)1/2, where ze is the charge on the ion (z = 1 in this study) T the absolute temperature and kB is Boltzmann’s constant (Stolzenburg Citation2018). Representative theoretical calculations (kindly communicated by Dr. Mark Stolzenburg) for a cylindrical DMA with either plug or parabolic flow yield slopes 20–30% higher than the 1.32 V1/2 shown for the diffusive line fit. Part of the observed excessive broadening is probably due to our non-cylindrical geometry, which tends to decrease the resolution (Fernandez de la Mora Citation2002). But part of it is likely due to a peculiar form of flow nonideality that increases diffusive broadening. In our own experience with DMAs running at high Reynolds numbers, the purely diffusive limit has been approached only rarely. A recent study by Amo-Gonzalez and Perez (Citation2018) has demonstrated the critical importance of a careful arrangement of screens in approaching ideal behavior at resolving powers as high as 110. The diffusive nonidealities observed in other studies, including the present one, may therefore be partly due to survival of free stream turbulence through the laminarization system. Another source of diffusive nonideality has been attributed by Martínez-Lozano and Fernández de la Mora (Citation2006) to acoustic radiation originating downstream from the analyzing region. They reported a resolution in excess of 100, close to ideal behavior, but only when running the downstream region of the DMA under sonic conditions (which precluded upstream propagation of acoustic disturbances). While these examples show flow nonideality in the form of free stream turbulence or acoustic oscillations that yield anomalous diffusion, the resolution still increases as V1/2 rather than tending to a constant value. This nonideality then appears to be strictly diffusive, manifested in a diffusivity larger by a fixed factor than theoretically expected from Einstein’s formula. This is quite different from an imperfection in the DMA geometry or in the axisymmetry of the flow, both of which would be manifested in a horizontal asymptote in the resolution versus voltage curve.”
Figure 4. Resolving power of the Perez DMA, determined from the data of . The origin of the current scale is artificially shifted upwards from 0 to 1.2 mV, to display the sensitivity of the inferred resolution in the presence of a small continuum background of contaminants. The straight dashed line through the origin is a theoretical reference for the resolution due to diffusion alone, though the slope shown of 1.32 V1/2 is a fit to the four most mobile peaks rather than theoretically calculated.
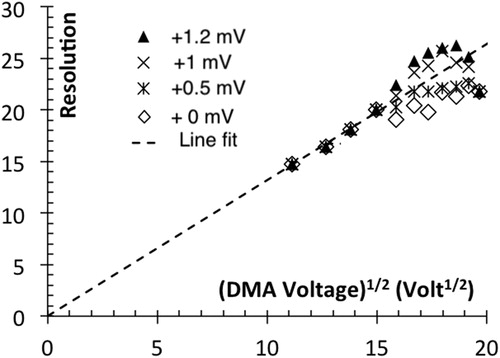
The original data (diamonds in ) fall increasingly below the dashed line starting on the fifth peak. For this and subsequent peaks, neighboring clusters have unresolved baselines, whence departure from the dashed line in could be partly due to a continuum background signal of contaminants or multiply charged clusters lying below the resolved peaks, and potentially degrading the inferred resolving power. An indication on the sensitivity of the inferred resolution to a hypothetical background is provided in by fitting the spectra of to different Gaussian curves displaced up by 0 (diamonds), 0.5 (*), 1 (×), 1.2 (black triangles) mV. That there is non-negligible background is evident from the data in the interval between the second and third, and the third and fourth peaks, whose Gaussian fits decay to essentially zero current, while the minimum experimental signals range between 0.5 and 1 mV. We believe this background is real (from impurity or doubly charged ions), though it may conceivably be apparent, due to a nonideality on the right tail of the peaks. Real or apparent, this background would naturally increase at increasing voltages due to the increased number of real impurity peaks or number of tails. Ignoring this background provides not the true resolution, but a lower bound for it, which we shall refer to as the apparent resolution. It is accordingly not unreasonable to expect that the maximum real resolving power for the data of at 400 Volt would lie closer to 25 than to 22.
For reference we note that the inverse mobility of the FAP– ion appearing in at 124 Volt is 1/Z = 0.642 Vs cm−2 (Fernandez de la Mora and Barrios Citation2017). The least mobile ion resolved in the negative spectrum appears at 445 Volt, with 1/Z = 0.642 × 445/124 V s cm−2 =2.31 Vs cm−2. This corresponds to a mobility diameter of 2.16 nm.
A linear combination of Gaussians fitting the data is included as a dashed line for the data (crosses) of uncorrected for background), obtained with two pumps in series. Corresponding resolutions are reported in for both the negative and the positive spectra. includes the data from , also uncorrected for background. Similarly to , Figure displays a decay in the rising trend of resolution versus DMA voltage at about 16 Volt1/2. If the resolution tended to a horizontal asymptote the natural explanation would be that a nonideality on the geometry or the axial symmetry or temporal steadiness of the flow was limiting the resolving power, even for non-diffusing particles. However, a second region of increasing apparent resolution reappears at about 23 Volt1/2. Note that the region of stagnant or decreasing resolution from 17 to 22 Volt1/2 corresponds to the transition between the first and second modulation, where the peaks have small intensities and the uncorrected background has a larger influence on apparent resolving power. The effect weakens as the peak height increases in the second modulation, resulting in apparent resolutions as large as 29. Interestingly, the high voltage trend of the data in is a continuous increase of resolution with voltage, with no sign of saturation. Also significant is the fact that the data for two and one pump are quite close to each other when V1/2 < 14 Volt1/2, in spite of the substantial differences in sheath gas flow rate. From this, we conclude that there is no deterioration of the quality of the flow, even when operating at flow rates much larger than the design conditions. includes also apparent resolving powers obtained with two additional configurations (documented in as C and D), where the filter in the second laminarizer [5] is substituted by screens of two different transparencies. These tests with decreased inlet pressure drop used only one pump, yet achieved higher flow rate Q than the test with two pumps documented in . In spite of the slight differences seen in for the various configurations, all exhibit maximal resolutions between 25 and 29, with a positive slope at the maximum peak voltage achieved. These and other similar tests not reported provide ample confidence that the quality of the centering system is maintained after disassembly and reassembly.
Figure 5. Apparent resolution in various tests, including those of and , with one and two pumps, respectively. The dashed line is the diffusive limit from .
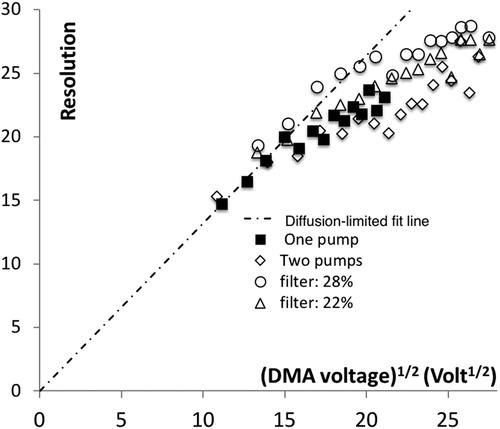
Table 3. Maximal flow rate achieved for various DMA configurations, all with 3 screens in the laminarizing stage [6] having 28% open area.
4.1. Tests with decreased flow resistance
In view of the increased resolving power achieved for a given particle size upon increasing the flow rate of sheath gas, we have tested the DMA in the various configurations described in the methods section. The flow rates achieved at the maximum power of our pumps are summarized in . They were determined from the measured peak voltages of standard ions via a variant of the Knutson-Whitby formula accounting approximately for the slightly conical geometry [EquationEquations (A5)–(A7) in the Appendix]. The mobility of the [(EMI+)2Methide–]+ cation dimer used to infer flow rate from peak voltage was determined by calibration with the tetraheptylammonium+ ion to be 1.06 cm2/V/s. The mobility of the FAP– anion is taken from Fernandez de la Mora and Barrios (Citation2017). Note that these mobilities are adequate for approximate inference of flow rates, but not appropriate to be used as mobility standards. The most relevant finding is that the level of laminarization obtained by the various elements inserted in the second prelaminarization stage [5] was indistinguishable based on the resolving power obtained at a given DMA voltage. One can therefore safely use screens with 28% open area in [5] to minimize the entry flow resistance. On the other hand, shifting in [5] from a 22% to a 28% open area screen did not have a measurable effect on the flow rate, showing that the pressure drop is dominated by the sheath exhaust holes [13]. Particularly surprising was that the 14 perforations introduced in the downstream cone [16] increased the flow rate by less than 20%, even though the open area is increased from 18 to (18 + 14) 5 mm holes (77.78%). Apparently the additional 14 holes are strongly constrained by the two nearby cylindrical electrodes, as well as by interference among themselves and with the neighboring 18 lateral orifices, resulting in relatively small discharge coefficients. Future models of the instrument may easily introduce geometrical improvements to decrease the outlet flow resistance.
5. Sizing large particles at moderate Q/q ratios
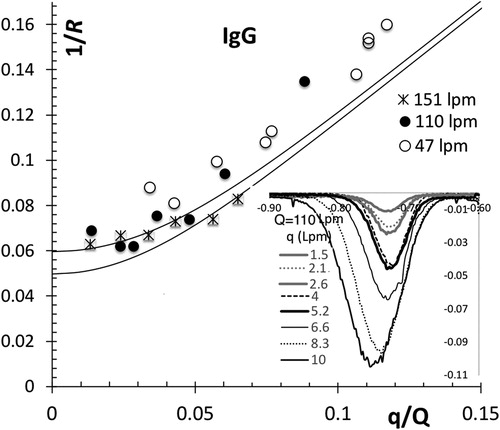
In this section we report a preliminary study of the Perez DMA at low flow rates typically required to classify large particles (67.2 nm at Q∼30 Lit/min). This test cannot be carried out properly with cluster ions, whose large diffusive broadening at such small flow rates precludes isolating clusters beyond the smallest ones (monomer, dimer), and those produce excessively broad peaks. We have therefore carried out low flow rate tests with the large protein immunoglobulin G (IgG), whose intrinsic width, unfortunately, sets an upper limit of about 16 to the measurable resolving power. The methodology is described in detail by Fernandez de la Mora (Citation2017), where the intrinsic width of the IgG peak was measured with a Half-Mini DMA run at high flow rates, with a resolving power larger than 32. Essentially all the mobility variation of IgG was due to a distribution of its shapes, which was well described by a Gaussian with about FWHM = 6%. While the analysis ignores Brownian diffusion, its effects will be estimated later. The protein peak (inset to ) was characterized through its FWHM, plotted in in terms of the aerosol to sheath flow ratio q/Q. The shift of the protein peaks to the left at increasing q (inset) is due to the associated uncorrected increase in DMA pressure. shows an approximately ideal response at sheath gas flow rates Q of 151 and 110 Lit/min, provided that q/Q ≤ 5%. Nonidealities are apparent at Q = 47 Lit/min, even at q/Q < 5%. However, the anomalous increased peak width observed at 47 Lit/min is largely the result of having ignored diffusive broadening. We can estimate this effect by assuming the linear dependence obtained experimentally in : FWHMDiff = 1.32−1 (Volt1/2) V−1/2. At 47 Lit/min the IgG peak voltage was 310 Volt, with FWHMDiff = 4.3%. Using a quadratic superposition principle (Stolzenburg Citation2018; Stolzenburg and McMurry Citation2018), FWHM for combined diffusion and intrinsic width would be (0.062 + 0.0432)1/2 = 7.4%. If we took FWHM = 7.4% to be the effective intrinsic width of the IgG peak at that flow rate, the corresponding theoretical line would agree approximately with the experimental curve. Therefore, in spite of the crude theoretical calculation at the smallest flow rate, these tests support the proposition that the DMA behaves approximately ideally down to 47 Lit/min. No tests were carried out at the design flow rate of 30 Lit/min at which even the large protein IgG is excessively diffusive.
Figure 6. Peak width FWHMz for charge-reduced immunoglobulin G ions, used as a test aerosol of finite intrinsic width, at three moderate values of the sheath gas flow Q and several aerosol flow rates q. The continuous lines in the main figure are theoretical widths convoluting the Knutson Whitby triangular transfer function for a (non-diffusing) monodisperse aerosol with a Gaussian mobility distribution with widths (FWHMZ) of 5% and 6%. The inset shows measured raw mobility peaks for Q = 110 Lit/min.
A more refined experimental evaluation of the DMA characteristics at moderate Q is presently complicated by the lack of narrow calibration standards. We may however expand the incomplete picture experimentally available on the basis of theoretical and numerical considerations. Under strictly axisymmetric conditions with matched aerosol flows, the flow field is controlled primarily by a fixed geometry and two Reynolds numbers for the aerosol and the sheath gas flow. For a given gas, temperature and pressure (ambient air), these two Reynolds numbers are controlled just by Q and q. Defining the Reynolds number in the main channel and the aerosol inlet slit as
at Q = 30 Lit/min, q = 1 Lit/min ReQ = 353, and Req = 8.84.
One could object that the boundary layer thickness δ of the sheath gas flow in the vicinity of the outer electrode would also play a role. But the Reynolds number based on the mean sheath gas velocity and δ is a quantity of order unity, and cannot alter the stability of the mixing region. Therefore, given the small calculated Req =8.8, the flows would tend to be highly stable, even if there were substantial mismatch between the mean velocities of the aerosol and the sheath gas. This point is clear from the observation that the main flow is completely stable at Q values 40 times larger, when the mean velocity of the sheath gas greatly exceeds that of the aerosol. This experimental observation fits within the general notion that localized low Re features immersed in a stable flow with a much larger global Re do not destabilize the larger flow. For instance, a laminar flow over a rough wall will not become turbulent unless the Reynolds number formed by the dimensions of the roughness and the local velocity at the obstacle is large enough. Similarly, the unsteady Karman vortex street behind a cylinder does not form below Reynolds numbers of 40. The same holds for many interacting cylinders in a grid when the local Reynolds number is based on the grid wire diameter and the mean velocity through the openings. Even if these examples were not directly applicable to the mixing region of a DMA, there is the experimental evidence that no instability arises in the Perez DMA at small q, no matter how large Q may be, which by itself refutes the notion that a large disparity in velocities between the aerosol stream and the sheath gas suffices to produce instabilities. Accordingly, achieving ideal DMA behavior at modest Q amounts to delivering a highly cylindrically symmetric aerosol stream at the inlet slit. We have modeled numerically the flow field in the region upstream and downstream the circularizer, and seen that all 24 jets [10] carry very much the same flow rate, producing a completely axisymmetric flow at the slit. At aerosol inlet flow rates q from 1 to 10 Lit/min, each of the 24 jets [10] is seen to decay completely shortly after their impact on the surface opposing the nozzles, well before reaching the aerosol inlet slit, (Khana et al., in preparation). Although the calculations assume that the jets remain laminar, the mixing with the surrounding gas would be even better for turbulent or transitional jets
6. Discussion and conclusions
6.1. Concentricity
Having achieved a resolving power approaching 30 even at a single flow condition shows that the instrument is relatively free from geometrical imperfections. Furthermore, the instrument was repeatedly disassembled and reassembled to test multiple configurations, without any evidence that the assembly process introduces random variations in the maximal resolution achievable. These findings validate our mechanical solution to the centering problem.
6.2. Stability of the flow
The DMA has also shown an ability to keep the flow laminar at the design q/Q range with flow rates considerably larger than those required in its intended size range. While these tests have been incomplete for Q < 100 Lit/min, combined with numerical and theoretical considerations they suggest that the DMA performance will be ideal at Q = 30 Lit/min, q = 1 Lit/min.
6.3. Comparison with the 10 cm Herrmann DMA
A comparison with a recent evaluation of a 10 cm long Herrmann DMA () carried out with the same EMI-Methide ions used here is of interest, as it illuminates the issues of laminarization and concentricity for both instruments. That long Herrmann DMA had its bullet-shaped inner electrode supported only on its lower end. Yet, the maximum resolving power it attained exceeded 30, with the peaks in the third modulation clearly better defined than here ( of Fernandez de la Mora and Barrios Citation2017). Since the voltages corresponding to the same peaks in both studies are almost identical, we conclude that the performance of the Herrmann DMA was slightly better than that of the Perez DMA at the same voltage. This comparison by itself reveals that the Perez DMA exhibits at least a slight level of non-ideality. It is certainly surprising that a single point of inner electrode support and a considerably smaller gap between cylinders (0.5 cm in the Herrmann DMA versus 1 cm here) would achieve a concentricity level as good as in the Perez DMA. Therefore the slightly superior performance of the Herrmann DMA is unlikely to be due to a better centering. Far more probable is that the much larger laminarization trumpet of the Herrmann DMA provides a more steady and radially uniform flow. Although the two instruments are not directly comparable in terms of weight and range (a factor 2–3 smaller minimum mobility in favor of the Perez DMA), this contrast suggests that a wider laminarization trumpet in the Perez DMA would have clear advantages, which might perhaps compensate for the associated increase in weight and size. The other interesting conclusion is that, after all, a 10 cm long DMA with a 5 mm gap between electrodes can be assembled (in the shop) with excellent concentricity. However, when the Herrmann DMA was later disassembled and put together (in the lab) in an attempt to increase the maximum achievable voltage difference and the symmetry of the aerosol inlet flow, it no longer reached a resolution of 30. This finding confirms the difficulty to reproducibly center a long Reischl-type bullet inner electrode, and the interest of supporting it both upstream and downstream, as done here.
Upon testing the 10 cm Herrmann DMA with viral particles at moderate Q, we found a substantially non-ideal resolving power, and therefore proceeded to build the Perez DMA. In the mean time two developments took place. (i) a bipolar source became available producing isolated ions large enough to show that the Herrmann DMA run at large Q/q exceeded a resolution of 30 with cluster ions (Fernandez de la Mora and Barrios Citation2017). (ii) The source of the poor performance of many DMAs at moderate Q/q ratios was identified (asymmetries in the aerosol flow) and corrected (Fernandez de la Mora Citation2017). The poor performance of the Herrmann DMA with viral particles was evidently due to undiagnosed and uncorrected asymmetries in the aerosol flow at the inlet slit.
From the preceding comparisons the following contributions of the present study may be noted.
A first contribution is the identification of a stringent aerosol flow symmetry requirement, and its solution by a method with fewer inlet losses than previously tested approaches. Our circularizer solution may in principle be implemented in any DMA, and although first introduced in the present design, it was previously tested in a modification of the Half-Mini DMA
A second contribution is a highly portable instrument weighing 3 times less than the Herrmann DMA.
A third contribution is a centering system that is more reproducible than that based on supporting the inner electrode only downstream. This advantage would be even greater in longer DMAs required to cover at high resolution all the size range relevant to viral particles, extending to about 200 nm.
A fourth advantage of the wide dimensions of the Perez DMA is its ability to pass large flow rates of sheath gas (>1200 Lit/min demonstrated here), as well as rather large aerosol flows at very high size resolution. Hontañón and Kruis (Citation2009) have discussed the practical interest of high aerosol flow DMAs to generate high-value particles with narrowly defined sizes. They have developed an instrument for this purpose, whose uncommonly large dimensions (R1 = 7.8 cm, R2 = 12 cm; L = 10 cm) keep the Reynolds number below 2000. The Perez DMA covers a wider range of sheath gas flows and may be easily held in one hand (5 Kg). Note that the ability to collect a large sample for biological or electron microscopy analysis is also of interest in viral particle applications. A Herrmann DMA could perhaps be made as light as the Perez DMA, but its lower cross section would not handle comparable flow rates. Additionally, the wider radial dimensions of the Perez DMA enables the use of higher voltage differences, extending its particle size range beyond that for the 10 cm Herrmann DMA (but not as much as in the much wider Hontañon-Kruis DMA).
6.4. Comparison with other DMAs covering the 20–70 nm size range
Many DMAs are available that cover the 20–70 nm size range of interest in viral studies, so a discussion of their advantages and disadvantages over the Perez DMA is appropriate here. The comparison is naturally clouded by the difficulty already discussed to produce monodisperse particles in that size range, as a result of which not many studies have focused on DMA resolving power at tens of nm. Probably the most widely used DMAs are those commercialized by TSI, whose sheath gas flow rates are limited by flow stability issues to about 30 Lit/min. The earliest DMA model, the long TSI 3071, has been previously investigated with IgG ions, achieving at best FWHM = 0.16. This could be reduced to 0.082 (0.072 for IgG’s dimer and trimer) by improving the laminarization screens (Fernandez de la Mora, Gao, and Perez-Lorenzo Citation2017), still showing a substantial level of non-ideality. Chen et al. (Citation1998) have studied the resolving power of a much shorter instrument that became TSI’s 3085 model. Two DMAs were operated in tandem, with the first at a fixed voltage and the second scanning over voltage. The resulting mobility spectrum was inverted by assuming identical triangular response functions for both DMAs, yielding an inferred value for their individual FWHM. They used diffusing as well as non-diffusing particles of up to 50 nm, and investigated q/Q ratios as small as 1/20 and 1/30. Their lowest FWHM were about 0.06 (ideally 0.05) and 0.05 (ideally 0.033). The smallest reported FWHM we have seen for TSI’s 3085 is 0.047, obtained for a purified sample of the PP7 virus (24.6 nm; You et al. Citation2014). This relatively small value is the raw measured width, without any inversion accounting for the (unknown) finite mobility distribution of the viral particles. They operated under heroic conditions, with Q = 30 L/min, Q/q = 42, stepping the voltage with a particle diameter step of 0.2 nm, and dwelling for 25 s at each voltage. Scanning over a 20 nm interval therefore would have taken 2,500 s (∼42 min). Besides its interest related to the performance of the 3085 DMA, this study also suggests that purified viral particles could provide excellent standards for DMA testing, certainly better than IgG.
The viral literature includes another most relevant study by Kallinger et al. (Citation2013) reporting FWHMZ = 0.039 for the purified human rhinovirus (29.7 nm; see their ). Again, this width is due to the (unknown) intrinsic width of the viral particle distribution as well as the response function of the DMA. The DMA they used will be referred here as the UDMA. It had the same general design as a previously described Reischl type DMA (Steiner et al. Citation2010), though with slightly different electrode radii and a column length L ten times larger. The very short DMA of Steiner et al. (Citation2010) had shown excellent resolving power with molecular ions when operating at Q = 750 Lit/min. Kallinger et al. (Citation2013) operate at Q and q of 50 and 0.6 Lit/min, and contribute a highly relevant evaluation by the tandem DMA method, going up to about 60 nm (their Figure 3). The second column of our collects their reported FWHMD (with particle diameter rather than mobility used as variable in the spectrum) as a function of particle diameter D. The poor precision with which we read D from their Figure 3 is relatively inconsequential because the peak width changes rather slowly with D. Column 3 in uses the Millikan formula to recalculates these peak widths in terms of the mobility variable, to yield FWHMZ. Kallinger et al. (Citation2013) give little detail, but it appears that what they report in their Figure 3 is the measured peak widths on the second DMA, without correcting for the finite width of the aerosol delivered by the first DMA. If this interpretation were correct, using the quadratic additive rule, the intrinsic FWHMZ of this UDMA would be given approximately as the reported value divided by √2. This quantity is included as the fourth column of , showing a resolution slightly above 30 for particles of about 60 nm. This datum by itself reveals that the two UDMA prototypes used are both fairly well centered, even though all mating surfaces were cylindrical.
Table 4. Peak width for the Vienna UDMA (Kallinger et al. Citation2013).
Note that that the uncorrected mobility peak width of 0.039 reported by Kallinger et al. (Citation2013) for the human rhinovirus (29.7 nm) is slightly less than the corrected 0.0426 width included in for their 29 nm TDMA particles. This is of course impossible, but allowing for slight measurement errors in both width determinations and in the crude inversion performed via a division by √2, one would come to the striking conclusion that these viral particles were essentially monodisperse!
In conclusion, comparison with existing DMAs covering a size range from 10 to 70 nm, the Perez DMA performs far more ideally than either TSI’s 3071 or 3085 DMAs. A comparison with the Vienna UDMA of Kallinger et al. (Citation2013) shows the later’s inferior performance with molecular clusters, though this may change if the UDMA were to behave ideally at Q much larger than the 50 Lit/min already tested. Both the Perez and the long UDMA reach a resolving power of about 30 under the best conditions under which they have been tested. The comparison, however involves very different particle sizes and does not correct for diffusive broadening. If diffusive corrections were included, the highest resolution of the Perez DMA would be considerably better than that of the UDMA. This does not necessarily imply a better performance of the Perez DMA in the viral size range, where our IgG standard precludes a direct measurement of uncorrected resolutions above 16, while the UDMA has directly measured an uncorrected resolution of 22.2 at 60 nm.
Conflict of interest
Following Yale rules, Juan Fernandez de la Mora declares an interest in the companies NanoEngineering and SEADM commercializing several of the instruments used in this research.
Acknowledgment
We are very much indebted to Dr. Mark Stolzenburg for innumerable significant corrections and improvements in the article, particularly in Appendix A and on the effect of diffusion in .
Additional information
Funding
References
- Amo-Gonzalez, M., and S. Perez. 2018. Planar differential mobility analyzer with a resolving power of 110. Anal. Chem. 90 (11):6735–6741.
- Attoui, M., and J. Fernandez de la Mora. 2016. Flow driven transmission of charged particle against an axial field in antistatic tubes at the sample outlet of a differential mobility analyzer. J. Aerosol. Sci. 100:91–96. doi:10.1016/j.jaerosci.2016.06.002.
- Bereszczak, J. Z., M. Havlik, V. U. Weiss, M. Marchetti-Deschmann, E. van Duijn, N. R. Watts, P. T. Wingfield, G. Allmaier, A. C. Steven, and A. J. R. Heck. 2014. Sizing up large protein complexes by electrospray ionisation-based electrophoretic mobility and native mass spectrometry: morphology selective binding of fabs to hepatitis B virus capsids. Anal. Bioanal. Chem. 406 (5):1437–1446. doi:10.1007/s00216-013-7548-z.
- Chen, D.-R., D. Y. H. Pui, D. Hummes, H. Fissan, F. R. Quant, and G. J. Sem. 1998. Design and evaluation of a nanometer aerosol differential mobility analyzer (Nano-DMA). J. Aerosol Sci. 29(5–6):497–509. doi:10.1016/S0021-8502(97)10018-0.
- Fenn, J. B., M. Mann, C. K. Meng, S. F. Wong, and C. M. Whitehouse. 1989. Electrospray ionization for mass spectrometry of large biomolecules. Science 246 (4926):64–71. doi:10.1126/science.2675315.
- Fernandez de la Mora, J. 2002. Diffusion broadening in converging differential mobility analyzers. J. Aerosol Sci. 33:411–437.
- Fernandez de la Mora, J. 2017. Expanded flow rate range of high-resolution nanoDMAs via improved sample flow injection at the aerosol inlet slit. J. Aerosol Sci. 113:265–275. doi:10.1016/j.jaerosci.2017.07.020.
- Fernandez de la Mora, J., and C. Barrios. 2017. A bipolar electrospray source of singly charged salt clusters of precisely controlled composition. Aerosol Sci. Technol. 51 (6):778–786.
- Fernandez de la Mora, J., P. Gao, and L. J. Perez-Lorenzo. 2017. Eliminating the main source of instability and turbulence in TSI’s 3071 DMA. Aerosol Sci. Technol. 51 (7):896–902. doi:10.1080/02786826.2017.1316828.
- Fernandez de la Mora, J., and J. Kozlowski. 2013. Hand-held differential mobility analyzers of high resolution for 1-30 nm particles: Design and fabrication considerations. J. Aerosol Sci. 57:45–53. doi:10.1016/j.jaerosci.2012.10.009.
- Fernandez de la Mora, J., L. J. Perez-Lorenzo, G. Arranz, M. Amo-Gonzalez, and H. Burtscher. 2017. Fast high-resolution nanoDMA measurements with a 25 ms response time electrometer. Aerosol Sci. Technol. 51 (6):724–734. doi:10.1080/02786826.2017.1296928.
- Fernández García, J., S. Compton, C. Wick, J. Fernandez de la Mora. 2019. Virus size analysis by gas phase mobility measurements: Resolution limits. Anal. Chem. 91 (20):12962–12970.
- Gamero-Castaño, M., and J. Fernandez de la Mora. 2000a. Modulations in the abundance of salt clusters in electrosprays. Anal. Chem. 72 (7):1426–1429. doi:10.1021/ac991095u.
- Gamero-Castaño, M., and J. Fernández de la Mora. 2000b. Mechanisms of electrospray ionization of singly and multiply charged salt clusters. Anal. Chim. Acta 406 (1):67–91. doi:10.1016/S0003-2670(99)00596-6.
- Hontañón, E., and F. E. Kruis. 2009. A DMA for size selection of nanoparticles at high flow rates. Aerosol Sci. Technol. 43 (1):25–37. doi:10.1080/02786820802446812.
- Hoppel, W. A. 1970. Measurement of the mobility distribution of tropospheric ions. Pure Appl. Geophys. 81 (1):230–245. doi:10.1007/BF00875030.
- Kallinger, K., V. U. Weiss, A. Lehner, G. Allmaier, and W. W. Szymanski. 2013. Analysis and handling of bio-nanoparticles and environmental nanoparticles using electrostatic aerosol mobility. Particuology 11 (1):14–19. doi:10.1016/j.partic.2012.09.004.
- Kaufman, S. L., J. W. Skogen, F. D. Dorman, F. Zarrin, and K. C. Lewis. 1996. Macromolecule analysis based on electrophoretic mobility in air: Globular proteins. Anal. Chem. 68 (11):1895–1904.
- Khana, V., L. J. Perez-Lorenzo, and J. Fernandez de la Mora. Numerical modeling of the flow at the aerosol inlet slit of a DMA with a perforated circularizer ring (in preparation).
- Knutson, E. O., and K. T. Whitby. 1975. Aerosol classification by electric mobility: Apparatus theory and applications. J. Aerosol Sci. 6 (6):443–451. doi:10.1016/0021-8502(75)90060-9.
- Martínez-Lozano, P., and J. Fernández de la Mora. 2006. Resolution improvements of a nano-DMA operating transonically. J. Aerosol Sci. 37 (4):500–512. doi:10.1016/j.jaerosci.2005.05.009.
- Reischl, G. P., J. M. Mäkelä, and J. Necid. 1997. Performance of Vienna type DMA at 1.2-20 nanometer. Aerosol Sci. Technol. 27 (6):651–672. doi:10.1080/02786829708965503.
- Steiner, G., M. Attoui, D. Wimmer, and G. P. Reischl. 2010. A medium flow, High-Resolution Vienna DMA running in recirculating mode. Aerosol Sci. Technol. 44 (4):308–315. doi:10.1080/02786821003636763.
- Stolzenburg, M. R. 2018. A review of transfer theory and characterization of measured performance for differential mobility analyzers. Aerosol Sci. Technol. 52 (10):1194–1218.
- Stolzenburg, M. R., and P. H. McMurry. 2018. Accuracy of recovered moments for narrow mobility distributions obtained with commonly used inversion algorithms for mobility size spectrometers. Aerosol Sci. Technol. 52 (6):614–625.
- Stuart, J. T. 1988. Hydrodynamic stability (see section 5.1). In Laminar boundary layers, ed. L. Rosenhead, 540–542. New York: Dover.
- Wick, C. H. 2015. Integrated virus detection. Boca Raton, FL: CRC Press.
- You, R., M. Li, S. Guha, G. W. Mulholland, and M. R. Zachariah. 2014. Bionanoparticles as candidate reference materials for mobility analysis of nanoparticles. Anal. Chem. 86 (14):6836–6842. doi:10.1021/ac403503q.
Appendix A: Estimate of the DMA constant and the experimental flow rates
Knutson and Whitby [Citation1975, equation (7)] provided an expression giving the centroid mobility of the transfer function in terms of the ratio of the flow rate Q and the change in electric flux function between the inlet and outlet. This expression is not restricted to a cylindrical geometry, being completely general for axisymmetric flows. In order to approximate the electric flux function, at every axial position x we model the radial and axial electric fields as if the geometry were cylindrical with local radii R2, R1(x):
(A1, A2)
(A1, A2)
In this special case, the corresponding approximate electrical flux function is the primitive function of γ(x), ∫ γ(x)dx, in terms of which the Knutson-Whitby result is approximated by
(A3, A4)
(A3, A4)
The first of these equalities (A3) indicates that the result Q/(2πZVL) = 1/ln(R2/R1) applying to cylindrical DMAs still holds approximately for other slowly varying geometries, as long as one substitutes the usual inverse logarithmic term by its average over the axial length. The second equality (A4) introduces the new variable s = R1(x)/R2, and makes use of the fact that dR1/dx is constant for a conical geometry. Accordingly, the ratio defined in (A5) is the purely geometric constant defined in (A6). This ratio is unity in cylindrical DMAs, but may take other values k* ≠ 1 in other geometries:
(A5, A6)
(A5, A6)
For the dimensions of our instrument given in , k* as determined from (A6) is
(A7)
(A7)
In conclusion, the DMA behaves as if it were cylindrical with the outlet slit inner radius and an effective length L*=0.8693*11.6 cm = 10.084 cm. The value of k* given by (A7) has been used to give an estimated value to the flow rates in various experiments reported in this study.
Appendix B: Stabilizing role of flow acceleration
The role of mean flow acceleration dU/dx to increase the critical Reynolds number Rc = Uδ2/ν for turbulent transition is discussed among others by Stuart (Citation1988). The problem is controlled by the acceleration parameter λ = (δ22/ν)dU/dx, where δ2 is the momentum boundary layer thickness. For the unaccelerated flow at velocity U at the end of a flat plate of length L, δ2 = 0.664(νL/U)1/2, and Rc = 0.664(UL/ν)1/2. For this flow Rc ∼316 (Fig IX 14 of Stuart [Citation1988]), whence ReL*= U*L/ν∼230,000 and Q*=U*π(R22 – R12)∼1625 Lit/min. This critical flow exceeds all our tested values, suggesting that acceleration is unnecessary. However, Rc will be typically smaller than assumed because it depends strongly on the level of ingested free stream turbulence, which is unlikely to be exceptionally small given the modest inlet trumpet [17] used. An unaccelerated design hence involves a certain risk. On the other hand, Rc can be greatly increased by a slight acceleration. For instance, with a 1° cone angle the relative change in speed over the working section is 12%. Using the same δ2 expression as for a flat plate, λL = 0.6642*0.12 = 0.053. At this level of acceleration Rc has increased by about 15-fold over the unaccelerated case (Fig. IX 14 of Stuart [Citation1988]). This increases the critical flow rate by a factor of about 152, providing high confidence that no transition will take place at any flow rate attainable in practice.