
 ?Mathematical formulae have been encoded as MathML and are displayed in this HTML version using MathJax in order to improve their display. Uncheck the box to turn MathJax off. This feature requires Javascript. Click on a formula to zoom.
Abstract
Inhalation exposure chambers may be used for in vivo drug delivery or toxicological assessments among other applications. Nose-only exposure chamber (NOEC) systems limit non-respiratory aerosol exposure pathways that may affect biological response analyses in mice. Uniform aerosol delivery between all ports is desired, but any exposure system design may introduce variability. The aerosol flow characteristics in a commercially available NOEC system were assessed computationally and experimentally to estimate the particle size-dependent non-uniformities of the aerosol sampled at each exposure port. Only dilute non-evolving aerosols are considered in the present study. The experimental measurements recorded a flow velocity variability of up to 20% between ports. Sampling variability between ports was experimentally verified to be within 10% for particles >0.56 µm and <1.7 µm at controlled velocity dictated by the animal’s respiratory flow rate. This smaller particle number density variability at the exposure port was also predicted computationally. Main source of flow variability was associated to a recirculation inside the inner plenum. Sedimentation of larger particles (>3 µm) was observed inside the ports, causing visible aerosol separation on the top of the channel delivering the aerosol to the exposure trumpet. As the effect was minor and applied to particles beyond the size range recommended for mouse inhalation studies, it should have no influence on the dosimetry of inhaled aerosols. In the range of aerosol particle sizes and flow rates considered, a good agreement between computational and experimental results was found, confirming the suitability of the system for mouse inhalation studies, and the insights obtained may give rise to further improvements in the system design.
Editor:
Introduction
A variety of inhalation exposure chambers are used for in vivo drug delivery or toxicological and safety assessments in rodents. The chambers differ by the portion of the animal body that is in direct contact with the exposure atmosphere (Phalen Citation1997). Test guidelines published by the Organization for Economic Co-operation and Development (OECD) expressly mention two types of exposure systems: whole-body exposure chambers (WBEC) and nose-only exposure chambers (NOEC) (OECD GD 39, OECD TG 403). In the whole-body exposure chamber, the animal is free to move inside a restraining cage of defined area and volume while the entire body is exposed to the test atmosphere. In the NOEC, the animal’s movements are restricted, and the system apparatus is constructed so that, optimally, only the nose/snout is in contact with the test atmosphere. In the WBEC chamber, animals are in less stressful conditions, and a large number of subjects can be exposed with relatively low labor effort, although this model requires large quantities of test material. The aerosol in the WBEC is in contact with the animal environment and can be altered by the animal’s activities and bodily output or absorbed by non-respiratory routes, leading to a dose alteration and potentially affecting analyses of biological responses. The NOEC allows for more efficient and targeted exposure, minimizing the quantities of test aerosols required for the exposure, offering control of non-respiratory aerosol exposure. OECD test guidelines 403, 412, and 413 therefore recommend nose-only exposure in studies of liquid or solid aerosols and vapors that may condense to form aerosols. The main disadvantages of NOEC systems are the constrained conditions that stress the animals and the intensive labor required to position the animals correctly in the restrainers (Phalen Citation1997; Phalen, Mendez, and Oldham Citation2014). Additional work may be required to reduce the stress experienced by the animals. Mice can be acclimatized so that they remain calm in the restraint tubes (Kuehl et al. Citation2012).
Any exposure system introduces variability that is caused either by the system design and functionality principles or by the limited ability to control the animal’s behavior. In this regard, actual aerosol concentrations in the chamber should not deviate from the mean chamber concentration by more than 10% for gases and vapors, and by more than 20% for liquid or solid aerosols (OECD GD 39, principle 114). In the process of validation (installation, operational, or performance qualification), the system should be characterized to ensure correct or optimal system operation during the experiments and to elucidate the physical mechanisms that affect system function. System characterization is therefore expected to yield improved operational procedures or even physical modifications and better chamber designs.
NOEC systems are established for rodent inhalation exposures and are the subject of several reviews (MacFarland Citation1983; Drew Citation1985; Yeh et al. Citation1990, Cheng and Moss Citation1995; Wong Citation2007). A number of NOEC systems are available from different vendors: CH Technologies (Westwood, NJ, USA), TSE Systems (Bad Homburg, Germany), EMMS (Hampshire, UK) and DSI (St. Paul, MN, USA) among others. Commercially available systems are based on a direct-flow design where the test atmosphere is dynamically delivered to each exposure port and the air exhaled by the animal is immediately exhausted, limiting the possibility of rebreathing (Pauluhn and Thiel Citation2007). Although most systems have converged to similar characteristics, they present variations in system configuration, dimensions or design details that may affect the aerosol delivery. Thus, each available system needs to be validated and tested separately.
Few studies report and discuss aerosol homogeneity at different port locations within the chamber. Yeh et al. (Citation1990) analyzed a 96-port system similar to the design of Raabe et al. (Citation1973). They reported spatial and temporal aerosol variations in between the ports both with and without the animals. Two different aerosols with TiO2 or Cu-Zi particles were tested, both with a mass median aerodynamic diameter (MMAD) of approximately 1.1 µm. In all cases a variation lower than 10% was reported in the aerosol concentration (mg/m3). Pauluhn (Citation1994) validated a 100-port (five-tier) system designed to host rats. He analyzed the concentration of Cyfluthrin transported in an aerosol generated from a 50:50 (v/v) mixture of polyethylene glycol and ethanol. The aerosol was measured to have a MMAD of 1.1 µm and a geometric standard deviation (GSD) of 1.4. The Cyfluthrin concentration was measured at different ports of all five tiers of the system. The overall variation between the locations was 7.7%, which was attributed to the day-to-day variability of the solution (3.1%) and to the variability of the analytical method used for the Cyfluthrin determination (3.9%). Oldham, Phalen, and Budiman (Citation2009) analyzed a 24-port (three-tier) system and measured the particle count at each port for monodispersed polystyrene latex (PSL) sized 0.5 µm, 1.0 µm, and 2.0 µm (nominal diameter), reporting a spatial uniformity within ±10%. Mainelis et al. (Citation2013) studied a small 5-port NOEC (CH Technologies, Westwood, NJ, USA) and evaluated the aerosol mass uniformity of liposomal drug carrier systems (DCS) and PSL particles. Aerosol sizes investigated were 130 nm for the count mean diameter of the DCS and 0.2, 0.5, and 1.2 µm for the nominal diameters of the PSL particles. Mainelis et al. found a coefficient of variation of 12% between the ports. Moreover the measured size distribution showed no size variation between ports for the liposomal DCS. Tuttle et al. (Citation2010) measured port-to-port homogeneity for PSL particles with a nominal diameter of 1.0 µm, 1.8 µm, and 3.0 µm in a similar five-port system (CH Technologies, Westwood, NJ, USA) and concluded that there was only slight port variability. Saini et al. (Citation2009) analyzed a 36-port system (three-tier) in a bottom-up flow configuration and 350 nm PSL particles. Their system was similar to the one examined in this report and designed by the same producer (CH Technologies, Westwood, NJ, USA). They reported that particle number density varied from 1500 particles/cc in the first tier to 2400 particles/cc in the third tier.
Computational fluid dynamics (CFD) was used for the first time by Oldham et al. (Citation2004) to evaluate the flow uniformity inside an exposure system. Simulations were used to verify that in a whole-body system mixing was adequate in all compartments and no stagnations zones were present in the system.
Jeon, Yu, and Ahn (Citation2012) evaluated a custom made direct-flow-type NOEC similar to the system of Cannon, Blanton, and McDonald (Citation1983). The system was designed for nanoparticles, with 36 ports distributed along six tiers operated in a top-down configuration. A 36 L/min flow entered the inner chamber from a nozzle placed at the top of the chamber. An additional 20 L/min sheath flow was added to the outer chamber. The inlet flow was loaded with nanoparticles with an average diameter of 72 nm and GSD equal to 1.5. The researchers performed both computational fluid dynamics (CFD) and experimental investigations and reported maximum variations between the ports of 20% for flow velocity and 10% for particle number density.
The NOEC systems produced by CH Technologies (Westwood, NJ, USA) and their components were previously investigated only in a standard bottom-up configuration (Saini et al. Citation2009, Tuttle et al. Citation2010, and Mainelis et al. Citation2013). Tuttle et al. (Citation2010) and Mainelis et al. (Citation2013) analyzed a 5-port directed-flow system, while Saini et al. (Citation2009) analyzed a multitier system with 36 ports.
The objective of the present study was to characterize aerosol transport, sampling, and deposition in a 60-port stainless steel NOEC system produced by CH Technologies (Westwood, NJ, USA) in a top-down configuration. The investigation was performed both experimentally and numerically (CFD). We focused mainly on the spatial homogeneity of the aerosol flow between the exposure ports and on the causes of non-homogeneity. We evaluated the influence of aerosol sampling and the effect of the mouse inhalation flow on the exposure. To the best of our knowledge, investigations combining CFD and experimental data acquisition have not yet been performed on a commercially available NOEC system. Such data and insight achieved can be used to propose design changes to improve NOEC system flow homogeneity and associated delivery performance.
Materials and methods
NOEC
The NOEC investigated in the present work was a 60-port stainless steel system produced by CH Technologies (Westwood, NJ, USA) for murine nose-only exposures. During operation, sealed glass exposure tubes are tightly fitted to the connector cone and assembled to the outer chamber (see , top). There are five tiers of 12 ports each. Staggering the exposure ports by 30 degree between tiers is expected to improve air flow around each animal’s restraint tube and facilitates experimental operations (loading and unloading) as well as improving animal observations. Each port was identified by a letter denoting the tier (A–E) and a number (1–12). For example, the notation C5 referred to port 5 on the third tier from the top. Each port is loaded with a closed glass tube that may or may not host a mouse.
Figure 1. NOEC produced by CH Technologies (Westwood, NJ, USA) (top). Schematic of flow inside a one-tier 12-port NOEC (bottom).
Various versions of glass tubes with differing geometrical characteristics can be used in this design. It conforms to the port size of the Battelle NOEC System (Cannon, Blanton, and McDonald Citation1983). The tube aperture that fits the mouse nose measures 6.35 ± 0.01 mm. The cone angle varies from 70° to 73°, the conical height of the cone is 8.5–11.5 mm, and the outer tube diameter is 27.43–28.00 mm. A slight geometrical variability between glass tubes is possible even within the same make and model because of manufacturing processes; these variations are detectable by visual inspection. When the mouse is hosted within the glass tube, only the tip of the nose and the nostrils extend from the tube.
The flow through a single-tier 12-port NOEC slice is illustrated in (bottom). When the NOEC includes multiple tiers, the same flow pattern can be extended to the added components. The system uses the flow-past chamber concept introduced by Cannon, Blanton, and McDonald (Citation1983). The aerosol flow enters the inner chamber of the NOEC from the top and exits the outer chamber through the bottom of the NOEC. In flowing from the inner to the outer chamber, the aerosol passes through the exposure port constituted by the assembly of an exposure trumpet, an exposure glass tube, and a surrounding connector cone. When the mouse is hosted within the exposure tube, the mouse nose inserts into the entrance of the exposure tube and samples the aerosol that is delivered by the exposure trumpet. The inner chamber is maintained at a positive pressure of 50–70 Pa relative to room pressure using a suitably sized orifice in the exhaust opening and an open coupling placed at the NOEC outlet that connects to the exhaust line. The gap across the open coupling was set at a distance that prevented the exhaust line pressure from affecting the flow inside the chamber. Pressure fluctuations in the exhaust line therefore did not influence the inner and outer chamber pressures relative to the environment, and stable pressure values were maintained.
Experimental setup
The experimental parameters used are representative of the operative conditions during mouse in vivo inhalation studies. As recommended by Moss et al. (Citation2006), an average volumetric flow rate of 0.5 L/min, which corresponds to at least five times the average respiratory minute volume, was delivered at each port in order to limit aerosol rebreathing by the mice. The resulting net flow rate (i.e., after accounting for any sampling or waste prior to NOEC entry) supplied to the 60 ports was 30 L/min. The total flow rate supplied to the chamber was 33 L/min to guarantee a 10% buffer.
shows the experimental setup for measuring PSL particle distributions in the NOEC. The aerosol containing PSL particles was generated using a TSI constant output atomizer (TSI Model 3076; Shoreview, MN, USA). The aerosol was formed by atomizing the liquid solution containing PSL particles with compressed air. The aerosol flow rate of 3 L/min leaving the generator was then diluted with 30 L/min of filtered air with 60% ± 5% relative humidity at 22 ± 3 °C to achieve the flow rate of 33 L/min required for evaluating the NOEC performance under conditions equivalent to animal exposure. lists the air conditions measured in the chamber. PSL particles with geometrical diameters of 0.56 μm, 1.0 μm, and 1.6 μm were generated. The density correction for the MMAD is proportional to the square root of density of the particle; the correction for the particles (ρPSL = 1.05 g/cm3) was on the order of 2.5%, resulting in MMADs of 0.57 μm, 1.0 μm, and 1.6 µm. This size range is considered appropriate in representing ‘respirable particle size (MMAD < 2 µm)’ (OECD TG 413; OECD GD 39, 7.1.4). Herein we will refer only to the geometrical particle diameter d. The dilution factor applied using filtered air with 60% relative humidity was approximately 10. The resulting air and flow conditions were considered enough to dry the particles, and therefore an additional dryer was not installed. During the experiment, all 60 exposure ports were loaded with glass exposure tubes, which were closed with stoppers and plungers.
Figure 2. Schematic of NOEC experimental setup for measurement of aerosol homogeneity at different ports.
Table 1. Average air conditions during testing.
Flow homogeneity
Flow velocity was measured at the exposure ports using a ThermoAir3 thermoelectric anemometer (Schiltknecht, Gossau, Zürich, Switzerland). The ThermoAir3 has a flow accuracy of 1% full scale and ±1.5% reading. It performs temperature compensation but no pressure compensation. The probe was inserted into a glass exposure tube to replicate as much as possible the conditions during exposure (online supplemental information, Figure S1, top). To sample the velocity inside the exposure trumpet that delivers the aerosol from the inner chamber to the mouse, the probe was positioned 8 mm in front of the exposure tube (Figure S1, bottom). The air velocity at each exposure port was measured in the order of A1 to E1, A2 to E2, all the way to A12 to E12. This vertical sequence was preferred over a horizontal one (i.e., measuring all ports in a single tier before moving to the next tier) to avoid artifacts at a given tier from temporal variability. This temporal variability had to be considered and minimized, as it took approximately four hours to complete the measurements. To reduce variability from mechanical constraints and to improve repeatability, the entire glass exposure tube and probe assembly was moved from port to port. The adapter, designed in-house, allowed the probe to be retracted before removal from the port. This protected the probe from damage from accidental contact during removal. Upon insertion at the next port, the probe was extended to the required position, which was maintained for 20 seconds, and a mean value was measured using the averaging function on the probe transmitter. The corresponding minimum and maximum values at each position were also recorded by probe transmitter.
This experiment was performed first using a standard chamber configuration with a 16.5 mm inlet diameter. Based on the initial computational and experimental results, the standard inlet disk of the NOEC was replaced with a custom inlet disk with a 49 mm inlet diameter to improve flow homogeneity. The measurement series was then repeated with the same procedure outlined above.
Aerosol sampling
To determine the homogeneity of the aerosol sampling at different ports, we used a TSI Aerodynamic Particle Sizer (APS) to measure PSL particle number density at ports A1, A5, A9, C1, C5, C9, E1, E5, and E9 for three aerosols with differing particle diameters. A fixed sampling point was set at the inlet of the NOEC, where the average measured particle number density was 13.0 particles/cm3, 18.6 particles/cm3, and 1.46 particles/cm3 for the 0.56 μm, 1.0 μm, and 1.6 μm PSL sizes, respectively (). The device used for port sampling was a closed glass exposure tube fitted with a stainless-steel sampling rod that extended from the exposure tube to mimic the position of the animal’s nose during exposure (Figure S1 and Figure S2). Three samples were taken at each port, and each sampling interval lasted two minutes to enable the sampling of >1000 particles per sample. To assess the temporal stability of the system two sets of data were collected per test section. The first set of data was collected within two hours of aerosol generation, and the second set was collected four to six hours after aerosol generation commenced. The sampling flow rate from the port was maintained at 0.5 L/min by supplying a compressed air flow of 4.5 L/min to the APS, which samples at 5 L/min. Three measurement repetitions were performed for each particle size at each position.
Table 2. Particle number density normalized by its value at the inlet of the NOEC.
CFD modeling
For the simulations, we employed a solver based on the publicly available AeroSolved simulation platform (AeroSolved Citation2017). The AeroSolved code was developed to study aerosol dynamics from aerosol generation through its evolution, transport, and deposition. The transport and deposition of the aerosol are mathematically described by a system of multiphase transport equations. The computational framework is applicable to a large number of species with relatively low computational effort and adopts an Eulerian-Eulerian approach, where gas and aerosol particles are modeled as continuous fields (Winkelmann et al. Citation2018; Frederix Citation2016). The code is implemented using OpenFOAM (Citation2015). A sectional method is used to discretize the aerosol size distribution of an arbitrary shape (Gelbard, Tambour, and Seinfeld Citation1980). In this method, the size distribution is discretized in a number, Q, of sections that represent separate diameters. The present sectional method formulation closely follows the approach presented by Kumar and Ramkrishna (Citation1996).
The particle velocity, v, model (Frederix Citation2016) assumes that the particle’s Reynolds number is small enough for the Stokes drag to be assumed. The Brownian diffusivity of aerosol particles, D, is modeled using the Stokes-Einstein equation, yielding the size-dependent diffusion coefficient (Hinds Citation1999):
where kB is the Boltzmann constant, T is temperature, μ is viscosity, and d is the particle diameter derived from the particle mass assuming spherical particles. The Cunningham correction factor Cc is incorporated to account for surface slip of small particles.
In the present model, two mechanisms allow for particle deposition at the boundaries: an inertial/sedimentation mechanism resulting in a non-zero drift velocity ul, and a diffusion mechanism driven by a particle number density gradient at the wall. A Lagrangian sub-grid model boundary treatment approach proposed by Longest and Oldham (Citation2008) is used to predict the inertial particle velocity at the wall. This improved approach (Frederix et al. Citation2017) captures the deposition on realistic computational grids by deriving semi-analytically the particles velocity in the proximity of the domain walls. The code was verified against several benchmark cases that are freely available in the code repository (GitHub Citation2017) and published (Frederix et al. Citation2017).
For this study a steady state version of the AeroSolved (Citation2017) was used, where the aerosol quantities (i.e., particle velocities and particle number density) are computed over the converged fields of the carrier gas. Equations were iterated until a convergence of 10−6 was reached. This procedure assumes the aerosol to be diluted and therefore can be modeled in a one-way coupling formulation, where particles are transported by the flow and can drift from the flow trajectories but cannot change the flow field because of their overall low mass concentration. The assumption is considered valid for mass fractions lower than 0.001 (Elghobashi Citation1994).
Particle mass fraction at the inlet was set to 10–5 for all simulations. The size distribution was discretized by 24 non-interacting sections covering a particle diameter range from 0.02 μm to approximately 5 μm. To facilitate the analysis of various particle sizes, a constant particle number density was assumed for each section. Therefore, the inlet particle number density, Min, for each section (i.e., particle diameter) was calculated as 90 (particles/cm3/kg).
The steady state approach was used to simulate the flow inside the inner chamber, while the standard transient AeroSolved (Citation2017) solver was used for the detailed simulations of the exposure port and nostril region. We refer to Frederix (Citation2016) for a comprehensive description of the AeroSolved solver and its models.
Case descriptions
This section describes the domain-geometry, mesh, and simulation parameters selected for the computational investigation of the NOEC. The main purpose of the simulations was to investigate and quantify the processes involved in aerosol transport within the NOEC. Moreover, detailed simulations were performed to analyze the most critical components of the system and verify that they did not compromise aerosol delivery.
Inner chamber
A simulation was performed to analyze the inner chamber flow and its effect on the flow and aerosol distribution between the ports. The inner chamber geometry is shown in . The 12-port NOEC has a rotational symmetry with a base sector of 30°. Considering that in the controlled and idealized environment of the simulation, no variation between ports of the same tier is expected, we simulated only a 90° portion of the inner chamber. The domain geometry consisted of an inlet pipe 16.5 mm in diameter and 150 mm long. The cylindrical inner chamber was 110 mm in diameter and 490 mm long, for a total volume of approximately 4.6 L. The exposure ports were represented by pipes of 6 mm in diameter that extended radially for approximately 20 mm.
Figure 3. Inner chamber computational domain. Simulations were performed in only a 90° segment of the domain.
The Reynolds number of the flow in the inlet was 2600, based on the 16.5 mm diameter of the inlet pipe and a flow rate of 30 L/min. Therefore, turbulence k-epsilon model was used. The turbulent diffusivity was added to the particle diffusivity to correct for the increased particle dispersion from turbulence. Total pressure was fixed at 105 Pa at each of the exposure pipe outlets.
Exposure port and nostrils
A detailed simulation of flow sampling at the mouse nostril from the aerosol delivered by the exposure port was performed to verify and quantify any possible preferential sampling in the aerosol inhaled by the mice. The domain (Figure S4) is formed by the exposure trumpet, the channel delivering the aerosol, and the expansion cone assembled with the exposure glass tube. The glass exposure tube is closed by a spherical section in which two semi-circular cuts were made to model the mouse nostrils.
A constant 500 mL/min aerosol flow was imposed at the inlet of the exposure trumpet. The corresponding Reynolds number of 100 indicated laminar flow conditions, so no turbulence model was used. Particle number density at the inlet was assumed constant and uniform following the same assumptions made for the inner chamber setup, specifically, a total particle mass fraction of 10−5 resulting in particle number density of 90 particles/cm3/kg for each particle size. Three simulations were performed imposing constant flows at the nostril of 50 mL/min, 150 mL/min, and 450 mL/min. These flow rates were chosen conservatively to represent different phases of the breathing cycle of mouse with a mean minute volume of 75 mL/min (Fairchild Citation1972; Hodge-Bell et al. Citation2007). Each simulation was integrated for up to one second of physical time, guaranteeing that final steady conditions within the exposure port were reached.
Computational mesh
Meshes were built using cfMeshPro, a software developed by Creative Fields (Zagreb, Croatia). The total mesh of the inner Chamber was of approximately 4.4 million cells and consisted mostly of hexahedra cells (4.2 million) while 1.5 million cells were used for the exposure port domain (Figure S4). Four layers of boundary cells were added at the walls. The average thickness of the first cell was 0.4 y+ wall units, while the maximum thickness was 6.3 y+ units, allowing the use of a low Reynolds number turbulent-wall function at each wall.
Results
Experiments
The average velocity measured within the exposure trumpet was of 0.41 ± 0.07 m/s and 0.48 ± 0.09 m/s for the 16.5 mm and 49 mm inlet diameter configurations, respectively. The theoretical mean velocity calculated from a 0.55 L/min/port volumetric flow rate is 0.34 m/s. This is consistent with the measured values when one consider the presence of the velocity profile and that the velocity was sampled in the central region of the trumpet where the velocity is maximum.
shows the measured air velocity averaged over all ports in each tier and expressed as a percentage of the mean air velocity from all ports. Measures for both the standard inlet (16.5 mm) and modified inlet (49 mm) are shown. For both cases, flow rates through the ports of the lower part of the chamber were higher than the flow rate through the ports of the upper part. Port velocity varied between 82% of the average in tier B and 119% of the average in tier E for the standard configuration. Standard deviations between ports of the same tier varied between 8% and 14%. The modified inlet configuration yielded a more uniform average velocity between ports, which varied between 93% and 105% overall, but a much greater variability between ports of the same tier, resulting in standard deviations in the range of 17%–21%. The overall standard deviation between all ports in all tiers was 18% for the standard configuration and 19% for the modified configuration.
Figure 4. Mean air velocity from all ports of Tiers A–E expressed as a percentage of mean air velocity from all ports. The velocity sampling probe was positioned 8 mm outside the exposure tube.
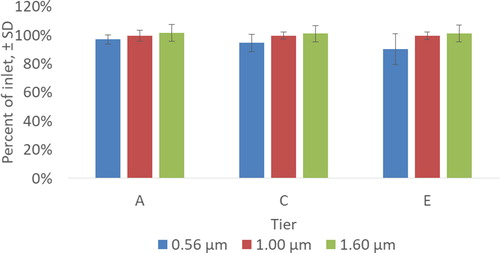
Number densities of PSL particles at the inlet and at each tier are reported in . illustrates average particle number density at each sampled tier normalized by the number density at the inlet. Despite the variabilities seen in velocity, particle number density at each tier were within 10% of the inlet value. The largest deviation was observed for 0.56 μm particles at Tier E (90% of the inlet value, with a standard deviation of 10%). Average number densities of the 1.0 μm and 1.6 μm particles were within 1% and 2% of the inlet values, with a standard deviation of 3% and 6%, respectively. No plausible physical explanation was suggested for the lower number densities of 0.56 μm particles. At the same time, the larger standard deviation of the number density of smaller particles (0.56 μm) could be due to instrument limitations, as the TSI APS has a measurement limit of 0.5 μm, as indicated by the manufacturer (TSI Citation2012).
Figure 5. Average particle number density expressed as a percentage relative to its value at the inlet of the NOEC. Averages for ports 1, 5, and 9 of Tiers A, C, and E are plotted. PSL particles (diameters 0.56 μm, 1 μm, and 1.6 μm) were tested.
CFD simulations
Inner chamber
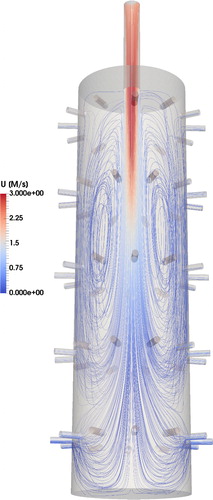
The overall flow structure inside the inner chamber is visualized in . We can see that the inlet forms a steady jet flow at the center of the chamber that reaches the level of the lower tiers. Close to the inner chamber wall, a region of upward (i.e., negative) vertical velocities is observed. The combined effect of the jet inertia and the presence of the exposure ports, where the aerosol is sampled from the inner chamber, creates a recirculation zone. Having reached the bottom part of the chamber, the jet bent upward to form an annulus flow, which then moved toward the inlet of the chamber, feeding the recirculation. In the inner chamber core the jet expands radially. In the top part of the chamber the flow moves from the outer part of the chamber toward the center producing a region with negative radial velocity (Figure S5).
Figure 6. Visualization of the flow inside the inner chamber. Flow streamlines are plotted and colored by the magnitude of the flow velocity.
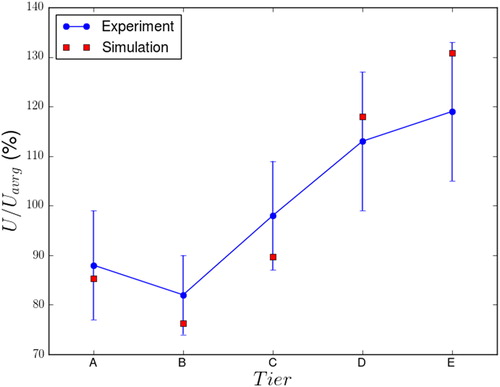
The average velocity at each tier, normalized by the average value and expressed as a percentage, is shown in , where the simulation results are compared against the experimental data. The computational predictions are within one standard deviation from the experimental measurements and yield a higher variation between the tier averages, from 75% at Tier B to 130% at Tier E. The velocity dependency on the tier position can be explained by the flow structure discussed in the previous paragraph. The flow close to the inner chamber wall moving from the bottom to the top () indicates that the pressure in front of the exposure ports was higher in the bottom tiers and lower in the top tiers, causing the higher flow through the ports of the bottom tiers.
Figure 7. Comparison of computational and experimental results for the normalized port velocity at each tier expressed as a percentage of the average values.
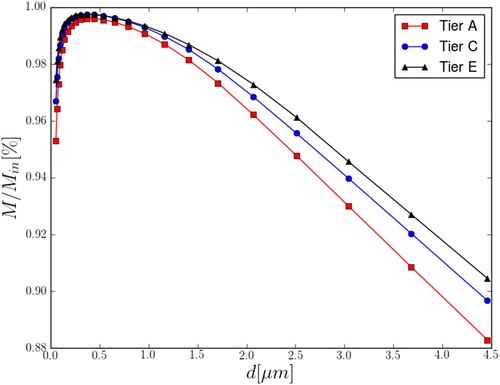
Particle number density normalized by the inlet values (M/Min) are plotted in . CFD simulations predicted maximum variations of approximately 0.5% (0.56 μm particles), 1.0% (1.0 μm particles), and 2.0% (1.6 μm particles) from the inlet values. All CFD predictions were within one standard deviation of the experimental values. The bigger deviations were observed for the 0.56 μm particles and may have resulted from quantification limits. These particles should have less inertia than 1.0 μm and 1.6 μm particles and should therefore affect the sampling to a lesser extent, although they were not large enough to be deposited by diffusion. From this perspective, the 0.56 μm particles are expected to yield less port variability than the larger particles. shows that the drop in particle number density was larger in ports in the upper part of the chamber (Tiers A and B). The drop increased with particle diameter and was limited to approximately 0.5%. This finding can be explained by a filtering effect of particle sedimentation, which, combined with the flow recirculation (), removed particles from the top of the NOEC.
Figure 8. Particle number density M normalized by the average inlet value. Values are computed inside the exposure trumpet of each port, 8 mm in front of the exposure tube.
plots normalized particle number density, M/Min, against particle diameter in Tiers A, C, and E. Only particles >0.02 μm and <4.5 μm in diameter were analyzed. CFD simulations predicted increased losses for both smaller and larger particles. Losses for small particles (d < 0.1 μm) are due to Brownian diffusion deposition and were predicted to reach 5% inside the inner chamber. Losses for larger particles (d > 4 μm) are due to inertial effects, such as deposition by sedimentation or impaction, as well as sampling at the port inlet, and were predicted to exceed 10% under the tested conditions.
Figure 9. PSL particle number density M normalized by the inlet value Min in the inner chamber plotted against particle diameter. Profiles for Tiers A, C, and E are shown.
An analysis of the deposition fluxes (Figure S6) shows that small particles (0.05 μm) can also deposit on the exposure trumpet and at the middle of the inner chamber wall, where the inlet jet flowed after turning upward (). As expected from the particle number density analyses, deposition fluxes were more intense for large particles (4.5 μm) and were concentrated on the horizontal surfaces of the chamber, specifically the exposure trumpet pipe and the chamber’s bottom wall (Figure S6).
Differences in particle distributions, which can be observed in the cross section plane of the exposure trumpet pipe (Figure S7), reflect the transport and deposition mechanisms. Small particles that deposit by diffusion had a lower particle number density around walls, while large particles that deposit by sedimentation had a reduced particle number density only in the top region. Particles of intermediate size (d = 0.5 μm) exhibited the weakest deposition mechanisms, being too large to be affected by diffusion and too small to sediment. These particles had reduced loss in the inner chamber ( and Figure S6) and presented a more uniform distribution inside the exposure port trumpet (Figure S7).
Exposure port and nostrils
Flow streamlines inside the exposure port are visualized in , representing a 150 mL/min sampling flow from the nostrils. Streamlines ending in the nostril were relatively straight and originated in the lower region of the exposure trumpet pipe. Main deviations from the straight trajectories were observed in proximity to the nose tip, where the flow hit the nose and flowed over it to be sampled by the nostril. Streamlines that were not sampled by the nostril but were directed to the outer chamber originated in the flow layer close to the trumpet pipe wall and from its upper region, where the main values for local particle losses were observed (Figure S7).
Figure 10. Visualization of CFD predictions in the nose-port assembly. Flow streamlines (left) and velocity [m/s] contours (right) in a steady 150 mL/min respiratory minute volume are shown.
![Figure 10. Visualization of CFD predictions in the nose-port assembly. Flow streamlines (left) and velocity [m/s] contours (right) in a steady 150 mL/min respiratory minute volume are shown.](/cms/asset/c56179a4-6c1d-4fb6-a6fb-25ea937a29d5/uast_a_1687843_f0010_c.jpg)
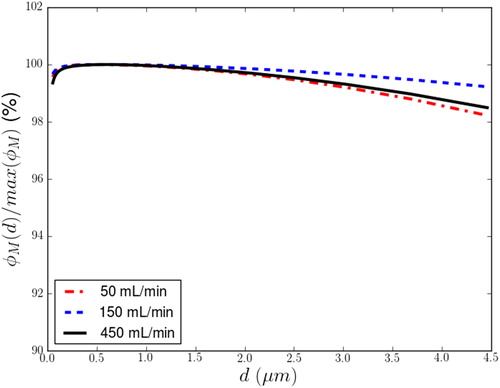
Sampling efficiencies, φ(M)/φ(Min), between the port inlet and the mouse nose for each particle diameter are plotted in for three sampling flows at the nostril of 50 mL/min, 150 mL/min, and 450 mL/min. For all particle sizes analyzed, losses from the exposure port inlet to the nostril were less than 2%.
Figure 11. Sampling efficiencies in the nose-port assembly for constant respiratory flows of 50 mL/min, 150 mL/min, and 450 mL/min.
Discussion
CFD simulations were performed to investigate the CH Technologies NOEC system and to identify factors that may affect aerosol homogeneity. A 90° section of the inner chamber was modeled to analyze the complex flow structure inside the NOEC. The main central jet was observed to recirculate upward, resulting in a higher pressure at the bottom of the chamber that caused a relatively higher flow through the ports of the lower tiers. Deposition losses were localized mainly at the port entrances and on the horizontal wall surfaces. Simulation results were always within the experimental error ranges, and main deviations could be explained by the experimental variability, the modeling assumptions, and measurement limitations.
Port variability in air flow velocity did not cause significant variability in particle number density. The flow velocity variability, however, translates directly to a volumetric flow variability that may impact the animal’s well-being and consequently affect dosimetry and biological endpoints. A good practice in using the NOEC system would be to rotate the mice from port to port periodically to improve the uniformity of the exposure conditions (Keller et al. Citation2014; Wong et al. Citation2016).
We modeled the exposure port and nose assembly to assess nostril-area sampling. Constant flow was assumed to facilitate the simulations, and flow rates up to an equivalent instantaneous inspiration flow peak of 450 mL/min were analyzed. Sedimentation of larger particles (>3 µm) was observed inside the ports, causing visible aerosol separation at the top of the trumpet, the channel delivering the aerosol to the exposure trumpet. As the effect was minor and applied to particles beyond the size range recommended for mouse inhalation studies, this sedimentation should have no influence on the dosimetry of inhaled aerosols even if the animals sample from the top region of the port by turning themselves inside the exposure glass tube.
Conclusions
Flow and aerosol sampling were investigated both experimentally and computationally, with a good agreement between methods.
No in or ex vivo analyses were performed. Only dilute non-evolving aerosols were considered. Steady State numerical simulations were performed using a one-way coupling assumption with constant inlet conditions.
Under operational conditions, the maximum flow variability between ports was 20% when measured experimentally and 30% when predicted computationally.
Sampling variability between ports was experimentally verified to be within 10% for particles >0.56 μm and <1.6 µm. The maximum sampling variation was observed for smaller particles, where quantification was near the lower limit of the instrument measuring particle size measurement.
Losses greater than 10% were predicted inside the inner chamber for particles larger than 3 μm.
By analyzing the exposure port and nose assembly and assuming a constant inhalation flow, we computationally verified a very small (<2%) preferential aerosol sampling difference at the mouse nose (nares).
Rotating the experimental animals between the NOEC ports may improve the homogeneity of the exposure during sub-chronic studies.
Declaration of interest statement
All authors except Rudolph Jaeger are employees of Philip Morris International. Rudolph Jaeger is affiliated with CH Technologies, producer of the analyzed system. Philip Morris International is the sole source of funding and sponsor of this research.
Supplemental data for this article is available online at https://doi.org/10.1080/02786826.2019.1687843
Download MS Word (5 MB)Related Research Data
References
- AeroSolved. 2017. Computational fluid dynamics code. http://www.aerosolved.com.
- Cannon, W. C., E. F. Blanton, and K. E. McDonald. 1983. The flow-past chamber: An improved nose-only exposure system for rodents. Am. Ind. Hyg. Assoc. J. 44 (12):923–8. doi:10.1080/15298668391405959.
- Cheng, Y. S., and O. R. Moss. 1995. Inhalation exposure systems. In Concepts inhalation toxicology, ed. R. O. McClellan, 25–66. Boca Raton, FL: CRC Press.
- Drew, R. T. 1985. The design and operation of systems for inhalation exposure of animals. In Toxicology of inhaled materials: Handbook of experimental pharmacology, eds. H. Witschi and J. D. Brain. Vol. 75. Berlin, Heidelberg: Springer.
- Elghobashi, S. 1994. On predicting particle-laden turbulent flows. Appl. Sci. Res. 52 (4):309–29. doi:10.1007/BF00936835.
- Fairchild, G. A. 1972. Measurement of respiratory volume for virus retention studies in mice. Appl. Microbiol. 24 (5):812–818.
- Frederix, E. 2016. Eulerian modelling of aerosol dynamics. PhD thesis, University of Twente.
- Frederix, E., A. Kuczaj, M. Nordlund, A. Veldman, and B. Geurts. 2017. Eulerian modeling of inertial and diffusional aerosol deposition in bent pipes. Comput. Fluids 159:217–231.
- Gelbard, F., Y. Tambour, and J. H. Seinfeld. 1980. Sectional representations for simulating aerosol dynamics. J. Colloid Interface Sci. 76 (2):541–556. doi:10.1016/0021-9797(80)90394-X.
- GitHub. 2017. AeroSolved repository. https://github.com/pmpsa-cfd/aerosolved.
- MacFarland, H. N. 1983. Designs and operational characteristics of inhalation exposure equipment - A review. Fundam. Appl. Toxicol. 3 (6):603–13. doi:10.1016/S0272-0590(83)80110-9.
- Hinds, W. 1999. Aerosol technology: Properties, behavior, and measurement of airborne particles. 2nd ed. New York: John Wiley & Sons Inc.
- Hodge-Bell, K. C., M. Lee, R. A. Renne, K. M. Gideon, S. J. Harbo, and W. J. McKinney. 2007. Pulmonary inflammation in mice exposed to mainstream cigarette smoke. Inhal. Toxicol. 19 (4):361–76. doi:10.1080/08958370601144076.
- Jeon, K., I. J. Yu, and K.-H. Ahn. 2012. Evaluation of newly developed nose-only inhalation exposure chamber for nanoparticles. Inhal. Toxicol. 24 (9):550–6. doi:10.3109/08958378.2012.696742.
- Keller, J., W. Wohlleben, L. Ma-Hock, V. Strauss, S. Gröters, K. Küttler, K. Wiench, C. Herden, G. Oberdörster, B. van Ravenzwaay, et al. 2014. Time course of lung retention and toxicity of inhaled particles: Short-term exposure to nano-Ceria. Arch. Toxicol. 88 (11):2033–59. doi:10.1007/s00204-014-1349-9.
- Kuehl, P. J., T. L. Anderson, G. Candelaria, B. Gershman, K. Harlin, J. Y. Hesterman, T. Holmes, J. Hoppin, C. Lackas, J. P. Norenberg, et al. 2012. Regional particle size dependent deposition of inhaled aerosols in rats and mice. Inhal. Toxicol. 24 (1):27–35. doi:10.3109/08958378.2011.632787.
- Kumar, S., and D. Ramkrishna. 1996. On the solution of population balance equations by discretization-I. A fixed pivot technique. Chem. Eng. Sci. 51 (8):1311–32. doi:10.1016/0009-2509(96)88489-2.
- Longest, P. W., and M. J. Oldham. 2008. Numerical and experimental deposition of fine respiratory aerosols: Development of a two-phase drift flux model with near-wall velocity corrections. J. Aerosol Sci. 39 (1):48–70.
- Mainelis, G., S. Seshadri, O. B. Garbuzenko, T. Han, Z. Wang, and T. Minko. 2013. Characterization and application of a nose-only exposure chamber for inhalation delivery of liposomal drugs and nucleic acids to mice. J. Aerosol Med. Pulm. Drug Deliv. 26 (6):345–54.
- Moss, O. R., R. A. James, and B. Asgharian. 2006. Influence of exhaled air on inhalation exposure delivered through a directed-flow nose-only exposure system. Inhal. Toxicol. 18 (1):45–51. doi:10.1080/08958370500282555.
- OECD GD 39. Retrieved in October 2018. Series on testing and assessment number 39: Guidance document on acute inhalation toxicity testing. Paris: OECD.
- OECD TG 403. Retrieved in October 2018. OECD guideline of the testing of chemicals 403: Acute inhalation toxicity testing. Paris: OECD.
- OECD TG 412. Retrieved in October 2018. OECD guideline of the testing of chemicals 412: Subacute inhalation toxicity testing. Paris: OECD.
- OECD TG 413. Retrieved in 10/2018. OECD guideline of the testing of chemicals 413: Subchronic inhalation toxicity testing. Paris: OECD.
- Oldham, M. J., R. F. Phalen, and T. Budiman. 2009. Comparison of predicted and experimentally measured aerosol deposition efficiency in BALB/C mice in a new nose-only exposure system. Aerosol Sci. Technol. 43 (10):970–97. doi:10.1080/02786820903082029.
- Oldham, M. J., R. F. Phalen, R. J. Robinson, and M. T. Kleinman. 2004. Performance of a portable whole-body mouse exposure system. Inhal. Toxicol. 16 (9):657–62. doi:10.1080/08958370490464670.
- OpenFOAM. 2015. OpenFOAM 2.3.x. Accessed 8 September 2015. http://www.openfoam.org.
- Phalen, R. F. 1997. Methods in inhalation toxicology. In Inhalation exposure methods, ed. R. F. Phalen, 69–84. Boca Raton, FL: CRC Press.
- Phalen, R. F., L. B. Mendez, and M. J. Oldham. 2014. Nose-only aerosol exposure systems: Design, operation, and performance. In Inhalation toxicology, eds. H. Salem and S. A. Katz. 3rd ed. Boca Raton, FL: CRC Press.
- Pauluhn, J. 1994. Validation of an improved nose‐only exposure system for rodents. J. Appl. Toxicol. 14 (1):55–62. doi:10.1002/jat.2550140111.
- Pauluhn, J., and A. Thiel. 2007. A simple approach to validation of directed‐flow nose‐only inhalation chambers. J. Appl. Toxicol. 27(2):160–167. doi:10.1002/jat.1188.
- Raabe, O. G., J. E. Bennick, M. E. Light, C. H. Hobbs, R. L. Thomas, and M. I. Tillery. 1973. An improved apparatus for acute inhalation exposure of rodents to radioactive aerosols. Toxicol. Appl. Pharmacol. 26 (2):264–73. doi:10.1016/0041-008X(73)90261-5.
- Saini, D., R. M. Buller, A. S. Biris, and P. Biswas. 2009. Characterization of a nose-only inhalation exposure system for ectromelia virus infection of mice. Particul. Sci. Technol. 27 (2):152–65. doi:10.1080/02726350902776143.
- TSI. 2012. Model 3321 aerodynamic particle counter® spectrometer operation and service manual. Accessed 10 June 2017.
- Tuttle, R. S., W. A. Sosna, D. E. Daniels, S. B. Hamilton, and J. A. Lednicky. 2010. Design, assembly, and validation of a nose-only inhalation exposure system for studies of aerosolized viable influenza H5N1 virus in ferrets. Virol. J. 7 (1):135. doi:10.1186/1743-422X-7-135.
- Winkelmann, C., A. Kuczaj, M. Nordlund, and B. Geurts. 2018. Simulation of aerosol formation due to rapid cooling of multispecies vapors. J. Eng. Math. 108 (1):171. doi:10.1007/s10665-017-9918-6.
- Wong, B. A. 2007. Inhalation exposure systems: Design, methods, and operation. Toxicol. Pathol. 35 (1):3–14. doi:10.1080/01926230601060017.
- Wong, E. T., U. Kogel, E. Veljkovic, F. Martin, Y. Xiang, S. Boue, G. Vuillaume, P. Leroy, E. Guedj, G. Rodrigo, et al. 2016. Evaluation of the tobacco heating system 2.2. Part 4: 90-day OECD 413 rat inhalation study with systems toxicology endpoints demonstrates reduced exposure effects compared with cigarette smoke. Regul. Toxicol. Pharmacol. 81 (2):S59–S81. doi:10.1016/j.yrtph.2016.10.015.
- Yeh, H. C., M. B. Snipes, A. F. Eidson, C. H. Hobbs, and M. C. Henry. 1990. Comparative evaluation of nose-only versus whole-body inhalation exposures for rats—Aerosol characteristics and lung deposition. Inhal. Toxicol. 2 (3):205–21. doi:10.3109/08958379009145255.