
 ?Mathematical formulae have been encoded as MathML and are displayed in this HTML version using MathJax in order to improve their display. Uncheck the box to turn MathJax off. This feature requires Javascript. Click on a formula to zoom.
Abstract
The resuspension rate of particles from surfaces is significantly dependent on surface roughness. Existing models only consider the case of surface asperities much smaller than particle diameter, but often particle sizes of interest are comparable or smaller than substrate roughness. In this study, a model for particle removal from large-scale roughness is described. Substrate roughness is described using a 2D sinusoidal profile. The critical shear velocity is determined considering rolling detachment of particles with JKR adhesion model and hydrodynamic moments on particles residing on the rough substrates. Our model results show that the effect of surface roughness on critical shear velocity is strongly dependent on the value of roughness amplitude and wavelength relative to particle size. The model predicts four primary removal regions based on relative particle-surface characteristics: easier-to-remove than smooth substrate, more difficult to remove than smooth substrate, not possible to remove, and similar behavior as smooth surface. The model performance is validated by comparison of predictions with published experimental results for highly rough substrates.
Copyright © 2019 American Association for Aerosol Research
1. Introduction
Particle resuspension, the phenomenon of detachment and transport of particles from surfaces into the air via external forces, affects a wide range of applications. From an environmental perspective, particle resuspension is important for both outdoor (Pant and Harrison Citation2013) and indoor (Thatcher Citation1995) air quality. In the outdoor environment, wind-blown dust and resuspension from moving vehicles are principal sources of resuspension (Pant and Harrison Citation2013). Indoors, walking and cleaning activities easily resuspended particles and resuspension can contribute significantly to increased indoor PM concentrations (Thatcher Citation1995; Ferro, Kopperud, and Hildemann Citation2004; Kopperud, Ferro, and Hildemann Citation2004). These activities increase exposure to dust and components of the dust, including organic pollutants, fungi and bacteria (Qian et al. Citation2012), which may increase the occurrence of allergic, infectious, and other diseases (Carrer et al. Citation2001).
From an industrial perspective, particle adhesion and removal have important roles in microelectronic processes to gain contamination-free-manufacturing (CFM). For instance, after chemical-mechanical planarization (CMP) of wafer surfaces during semiconductor fabrication, remaining submicron particles on the surface must be removed to avoid device failure (Cooper, Gupta, and Beaudoin Citation2001; Eichenlaub, Gelb, and Beaudoin Citation2004). In addition, cleaning of the deposition chamber from particle contaminants is important to prevent defects in circuit patterns in chemical vapor deposition (CVD) in thin-film material processing technology (Dobkin and Zuraw Citation2003). For the purpose of surface cleaning, air jet impingement is an efficient cleaning process to remove submicron particles from the surfaces (Otani, Namiki, and Emi Citation1995; Kesavan et al. Citation2017). Moreover, particle resuspension impacts efficiency of some engineered systems, such as solar panels in dusty environments (Mani and Pillai Citation2010) and heat exchangers fouled by colloidal particles (Schwarz Citation2001).
The behavior of particle-substrate contact is an important aspect of particle resuspension. The fundamental study of contact mechanics was introduced by Hertz (Citation1896) for two elastic spherical bodies. Johnson, Kendall, and Roberts (Citation1971) modified the Hertz theory to take into account the attractive surface forces. Their model, known as JKR, is able to evaluate the pull-off force of spherical particle from a smooth surface considering the adhesion energy. Later, Derjaguin, Muller, and Toporov (Citation1975) proposed an alternative adhesion model (DMT) by assuming the same contact profile as the Hertzian contact model. The DMT model accounts for attractive surface forces outside of the contact area as well. Later study by Tabor (Citation1977) suggested a continuous transition between JKR and DMT models, discussed by Muller, Yushchenko, and Derjaguin (Citation1980), based on adhesion and stiffness properties of materials. However, the difference in the predictions between the JKR and DMT models are relatively insignificant compared to the large variation in the experimentally obtained particle resuspension results (Nasr, Dhaniyala, and Ahmadi Citation2017).
The initial theories considered adhesion of a particle on a smooth surface, however, real surfaces are rough. Greenwood and Williamson (Citation1966) developed a surface roughness model that considered a surface covered by number of asperities with constant radius but with randomly distributed heights that follow a Gaussian distribution. Later, an adhesion model including the Greenwood’s surface roughness model was proposed to evaluate the adhesion force of particle on surface with nanoscale roughness with respect to particle size (Fuller and Tabor Citation1975). Using Fuller and Tabor (Citation1975) approach, Soltani et al. (Citation1995) suggested an analytical solution to determine the particle pull-off force from rough surfaces. Soltani et al. (Citation1995) found that nanoscale surface roughness significantly decreases the net pull-off force required to detach the particle from the rough surface. Rabinovich et al. (Citation2000a) developed a model of adhesion force as function of root-mean-square value of the surface roughness. Theoretical studies (Soltani et al. Citation1995; Rabinovich et al. Citation2000a) along with experimental findings (Rabinovich et al. Citation2000b; Götzinger and Peukert Citation2004) show that resuspension of micron-sized particles from surfaces with nanoscale roughness is significantly easier than from smooth surfaces.
Typically, in indoor and outdoor environments, particle resuspension occurs when hydrodynamic forces acting on them are greater than the adhesion force (Nicholson Citation1988). In this process, the near-wall turbulent flow structures contribute significantly to particle detachment from surfaces (Cleaver and Yates Citation1973). Soltani and Ahmadi (Citation1994) developed a mechanistic model for particle removal from smooth surfaces in turbulent flows. This model was later extended to predict particle removal from surfaces with nanoscale roughness (Soltani and Ahmadi Citation1995). Taking a different approach, Reeks and Hall (Citation2001) introduced an energy accumulation model, called the “Rock’n’Roll” model, to determine rolling detachment using a kinetic PDF approach accounting for the distribution of adhesion and aerodynamic forces. Recently, Brambilla et al. (Citation2018) modified the Rock’n’Roll model accounting for complex arbitrary shape adhesion force distributions based on experimental adhesion force AFM measurements (Rush et al. Citation2018). The evolution of different adhesion and resuspension models have been captured in two recent review articles (Henry and Minier Citation2014; Nasr et al. Citation2019).
In real-world conditions, surface roughness can be of the same length-scale or larger than particles. Jiang et al. (Citation2008) investigated particle removal in turbulent channel flow for several surface roughness scales. They found that air velocity required for particle removal increases with increase in the micron-scale surface roughness. Analysis of the experimental results against available particle removal models showed that the nanoscale roughness models are not capable of describing the experimental results for surface roughness that are larger than the particle size (Nasr et al. Citation2019). Also, particle resuspension from rough surfaces at this scale cannot be properly captured using the standard surface roughness measurements such as Rrms. Additional information regarding the spatial distribution of the roughness (e.g., spacing, wavelength) is required to represent the surface roughness accurately (Henry and Minier Citation2018). The inability of current models to describe particle removal from large-scale surface roughness suggests that a new modeling approach is required.
In this study, a parameterized representation of surface roughness is considered, and a model for particle removal characterization under turbulent flow is developed as a function of roughness length scale. A geometric approach is used to represent particle surface roughness as a sinusoidal wave function, and particle removal behavior is investigated as a function of wavelength and roughness amplitude. We analyze the force balance of adhesion and hydrodynamic moment to determine the critical shear velocity required to detach a particle based on the rolling mechanism (Ibrahim, Dunn, and Brach Citation2003; Ziskind Citation2006). The predictions of the proposed model are analyzed against the available experimental results.
2. Particle adhesion and removal: A large-scale roughness model
2.1. JKR adhesion model
Particles adhere to a surface due to the van der Waals forces caused by the intermolecular attraction between molecules of particle and substrate. Taking into account the effect of surface energy, Johnson, Kendall, and Roberts (Citation1971) studied the adhesion and detachment of particles in contact with surfaces and developed the so-called JKR model. Accordingly, the force needed to separate an elastic sphere from another elastic sphere (the pull-off force) is given as,
(1)
(1)
where
is the thermodynamic work of adhesion (or Dupré adhesion energy) that has the units of energy per unit area.
represents the energy per unit contact area of two surfaces, and
is the equivalent radius, defined as,
(2)
(2)
where
and
are radii of the particle and the surface curvature, respectively. For a flat substrate,
.
According to the JKR model, the contact radius between a particle and a flat surface at the moment of detachment is given as,
(3)
(3)
where
is the contact radius in the rest condition (in absence of external forces), given as,
(4)
(4)
where,
is particle diameter, and
is the composite Young’s modulus defined as,
(5)
(5)
where
is the Young’s modulus, and
is the Poisson’s ratio of particle and substrate (
for particle and
for substrate).
2.2. Particle on a sinusoidal surface
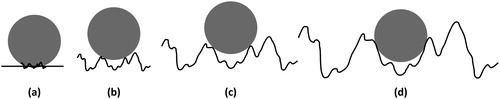
A schematic diagram illustrating particles residing on surfaces of different roughness lengths is shown in . In this study, a simplified model for particle removal from rough surfaces is introduced. For a parametric representation of the rough surface, a 2D sinusoidal profile is considered, and particle removal is determined as a function amplitude and wavelength of the profile.
Figure 1. Schematic of particle on a substrate under different surface roughness sizes.
A schematic diagram of the particle in contact with the wavy sinusoidal surface is shown in . In this figure, the wavelength and amplitude are comparable to particle size. The particle, therefore, rests in the trough and is in contact with the surface at two points ().
Figure 2. Schematic of a spherical particle in contact with a sinusoidal surface.
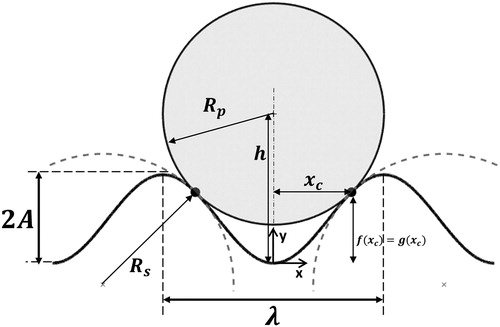
The height of the sinusoidal surface is given as,
(6)
(6)
where
is the amplitude and
is the wavelength of the surface.
To determine the contact points of a spherical particle with a wavy surface, the equation of the circular boundary (bottom half) of the sphere with respect to the origin is considered, as given below,
(7)
(7)
where
is the distance of center of the sphere from the origin of coordinate shown in (trough surface).
At the contact points of the circle and the wave, the slopes of EquationEquations (6)(6)
(6) and Equation(7)
(7)
(7) are equal—i.e.,
or,
(8)
(8)
Using EquationEquation (8)(8)
(8) , the x-location of the contact point,
can be obtained with an iterative numerical scheme, and then the height of the particle center from the wave trough, when
can be calculated as,
(9)
(9)
The surface radius of curvature at the contact points is given as,
(10)
(10)
Also, the height of the particle above the surface wave crest () is given as,
(11)
(11)
Note that, represents the fraction of spherical particle that is exposed to airflow.
The adhesion force of the particle can be evaluated using EquationEquation (1)(1)
(1) , with the curved surface assumed to behave as a spherical particle with radius
Here
is the radius of the surface curvature at the point of contact. This is a reasonable approximation as the surface forces are rather short range. The particle hydrodynamic forces and moment can then be determined considering the height of the particle above the crest level,
as described in the next section.
3. Rolling detachment model in turbulent flow
The current theoretical models that are used for predicting particle removal, categorized as static, kinetic and dynamic models, are summarized by Henry and Minier (Citation2014). In the present study, the mechanistic particle removal models that are based on force balance acting on the particle from flow and surface/particle interactions are used to evaluate the critical condition for particle detachment (Zhang and Ahmadi Citation2007; Ziskind, Fichman, and Gutfinger Citation1995; Soltani and Ahmadi Citation1994). The mechanistic models are known to be computationally less expensive. In the case of particle detachment in fluid flows, it is required to evaluate the hydrodynamic forces acting on the particle.
3.1. Hydrodynamic forces and torque acting on particle in the turbulent flow
The drag force acting on a spherical particle sitting on a surface is given as (Nasr, Dhaniyala, and Ahmadi Citation2017; Ahmadi Citation2015),
(12)
(12)
where
is the net velocity at the particle center,
is the correction factor due to the wall effect that was given by O’Neill (Citation1968),
is Cunningham slip correction factor given as,
(13)
(13)
where,
is the gas mean free path (for air:
), and
is the nonlinear coefficient of drag acting on particle is given as (Hinds Citation1999),
(14)
(14)
where
is the particle Reynolds number. For flows with low Reynolds number (
) EquationEquation (14)
(14)
(14) reduces to the Stokes drag coefficient, i.e.,
The hydrodynamic shear torque acting on a particle is given as,
(15)
(15)
where
is gas kinetic viscosity and
is the wall effect correction factor (
given by O’Neill (Citation1968)).
In the viscous sublayer in turbulent flows, the velocity varies linearly with distance from the wall. Small particles are typically embedded in the viscous sublayer and the corresponding net velocity at the center of the particle is given as,
(16)
(16)
where
is the gas kinematic viscosity and
is the turbulence burst intensity factor, which is the amplification of the mean near-wall velocity in terms of shear velocity. EquationEquation (16)
(16)
(16) estimates the maximum instantaneous streamwise velocity toward the center of the particle in near-wall in turbulent flows over a flat surface, for which
(Cleaver and Yates Citation1973; Soltani and Ahmadi Citation1994).
is the shear velocity (friction velocity) given as,
(17)
(17)
where
is the wall shear stress and
is the gas density.
Note that, the hydrodynamic forces introduced in this section are obtained for a spherical particle attached to a flat wall. In this study, an approximate estimate for the hydrodynamic forces acting on a particle in contact with a wavy surface is presented. Another aerodynamic force acting on particles in a shear flow field is the shear lift force. This lift force is typically negligible (Soltani and Ahmadi Citation1994) and is not considered here.
3.2. Flow on a wavy surface
Compared to flat walls, relatively a few studies have investigated the turbulent flow behavior on wavy surfaces. Zilker, Cook, and Hanratty (Citation1977) and Zilker and Hanratty (Citation1979) measured the velocity distribution as well as variation of the surface stress along a wavy wall and investigated the influence of surface wave on separated and unseparated turbulent flows. In the crest, the velocity profile was seen to be similar to that over a flat surface. In the trough, the flow behavior was seen to depend on the relative size of the surface wavelength to the amplitude (i.e., ). For a low relative wavelength (
), a separation bubble fills more than half of the wavy surface valley (Zilker and Hanratty Citation1979; Buckles, Hanratty, and Adrian Citation1984). This finding was confirmed by the numerical study of Liu, Kareem, and Yu (Citation1993). Other studies have shown that the separation bubble exists in the leeward section and trough of the wave for
(Zilker and Hanratty Citation1979; Hudson, Dykhno, and Hanratty Citation1996; Cherukat et al. Citation1998). When the relative wavelength (
) is increased to 20 or greater, the flow streamlines are seen to closely follow the surface profile (Zilker, Cook, and Hanratty Citation1977; Rubbert et al. Citation2017).
Based on the above results of flow over waves, here it is assumed that for the flow in the trough does not contribute to particle removal. Only the near-wall flow that passes above the wavy surface crest is considered for particle removal. Adding to the observation of Zilker, Cook, and Hanratty (Citation1977) that the flow above the crest is similar to the flow over a flat plate, we examined the DNS results of turbulent near-wall flow over a wavy surface with
reported by Cherukat et al. (Citation1998). From the results, we estimate that the maximum instantaneous streamwise velocity above the wave crest is at
where the
is the distance from the wall in wall units. In comparison, for a flat surface, the turbulence burst intensity factor is
(see Section 3.1). Thus, using the velocity profile over a flat plate geometry to represent the flow over the wavy surface crest is estimated to result in less than 10% error. For simplicity, we assume the flat plate profile and its associated turbulence burst intensity factor of 1.74 to calculate the near wall velocity in EquationEquation (16)
(16)
(16) .
3.3. Force balance
In contrast with the case of a particle in contact with a flat surface or a surface with nanoscale roughness as shown , the nature of particle-substrate contact is quite different when the particle size is comparable to the large-scale surface roughness as shown in . In this case, the force and moment balance acting on the particle must be revisited. A schematic diagram of a spherical particle in contact with a sinusoidal surface and corresponding hydrodynamic forces and adhesion force acting on the particle are shown in . It should be pointed out that at the time of separation, the adhesion force, that acts at the contact point, normal to the surface, is equal to the pull-off force given by the JKR model (EquationEquation (1)
(1)
(1) ). Prior studies have suggested that rolling detachment is the primary mechanism for removal of spherical particles from substrates when they are well embedded in the viscous sublayer, i.e.,
where
(Soltani and Ahmadi Citation1994; Ziskind, Fichman, and Gutfinger Citation1997; Ibrahim, Dunn, and Brach Citation2003; Jiang et al. Citation2008; Henry and Minier Citation2014). After detachment, however, the large particles lift up in the high-speed streaks due to the increasing effect of lift force (Zhang and Ahmadi Citation2000). In the present model, as discussed earlier, it is assumed that hydrodynamic forces and torque act on the top portion of the particle that is above the wave crest. Thus, the fraction of the particle frontal surface that is exposed to airflow is given as,
(18)
(18)
Figure 3. Schematic of spherical particle in contact with sinusoidal surface and corresponding force balance of hydrodynamic and adhesion forces. The contact surface curvatures are shown at two points. At the point O, the contact is a convex-convex contact while as the particle moves into the asperity, the contact eventually becomes concave-convex, as shown at O'.
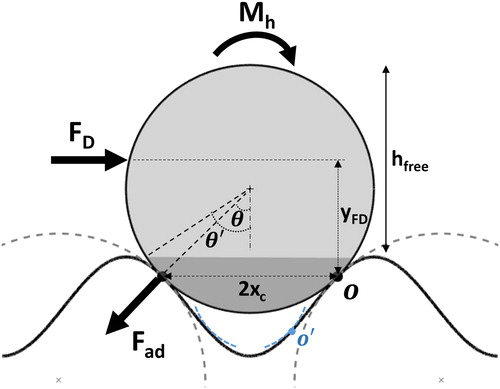
is a correction coefficient for the net hydrodynamic moment with respect to point O. The rolling mechanism force balance with respect to point O in could be restated as,
(19)
(19)
where the
is given as,
(20)
(20)
EquationEquation (19)(19)
(19) is a function of geometrical parameters, material properties, and flow velocity. Assuming that geometry and material properties are known, the only parameter required to be evaluated is the shear velocity for onset of detachment. The resultant critical shear velocity,
is the shear velocity required to roll the particle about point O (). It is assumed that when the particle-surface adhesion bond is overcome, the particle begins to roll. When the particle rolls, small fluctuations in flow and lift force could move the detached particle away from the surface, and the possibility of re-attachment is ignored. Note that, EquationEquations (18)
(18)
(18) and Equation(20)
(20)
(20) are for
In case of
the particle is trapped inside the surface valley, and it is assumed that it remains trapped (see Section 3.3.2).
In this model, wavelength and amplitude of the sinusoidal surface and the particle size are the control parameters for characterizing the surface roughness and particle-surface interactions. Depending on the values of wavelength and wave amplitude relative to particle size, various limiting conditions occur. Extreme conditions of particle size relative to the sinusoidal surface are shown in and discussed in the subsequent sections.
Figure 4. Particle on sinusoidal surface, limits of two-point contacts, (a) large wavelength, (b) large amplitude compared to particle size, and (c) small wavelength.
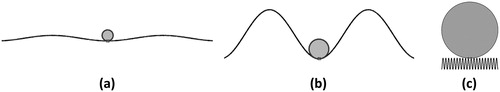
3.3.1. Large surface roughness wavelength
For the limiting condition of particle size and surface amplitude being much smaller than the surface wavelength, there is only one contact point with a contact radius () similar to the contact of a sphere with a flat elastic surface in the JKR adhesion model (Ziskind, Fichman, and Gutfinger Citation1995). In this case, particle detaches by a rolling mechanism, and the adhesion moment at the point of separation is given by
similar to the available models of particle removal from smooth (flat) surfaces (Soltani and Ahmadi Citation1994; Nasr, Dhaniyala, and Ahmadi Citation2017). Accordingly, the moment balance becomes,
(21)
(21)
In the case of large surface wavelength, the one-point contact when the particle completely resides inside the surface trough corresponds to the condition that where
and
are given by EquationEquations (8)
(8)
(8) and Equation(4)
(4)
(4) , respectively.
3.3.2. Large surface roughness wave amplitude
Another limiting condition corresponds to when the surface wave amplitude is much larger than the particle size (with relatively large wavelength) such that the particle rests inside the surface valley as shown in . In this case, the particle is not exposed to the airflow passing above the surface crest, and, therefore, cannot be removed. The trapped condition is determined using EquationEquation (11)(11)
(11) when the
becomes negative (
).
As discussed in Section 3.2, for small values of relative wavelength () the flow inside the surface valley can be neglected, and for surfaces with large relative wavelength (
the flow fully follows the wave surface. For intermediate relative wavelengths, i.e.,
the flow in the crest is not fully known. Here, over the intermediate relative wavelength, we assume a linear trend in the crest flow, i.e., the flow penetration is assumed to vary from zero (
to full (
Here, the extent of particle exposure to flow is determined by the height of the particle that meets the flow, rather than the particle height above the crest line, defined as:
(22)
(22)
3.3.3. Small-scale surface roughness
An important limiting condition occurs when the surface wavelength is much smaller than the particle diameter. For this case, as shown in , the surface can be considered as a rough surface with nanoscale roughness. Here, because of the elastic deformation of the contact region, there are possibly multiple contacts between the particle and substrate asperities, and thus, two-point contact model is no longer applicable. In this limit,
(23)
(23)
For the above case, a small-scale roughness (nanoscale roughness) model (Fuller and Tabor Citation1975; Soltani and Ahmadi Citation1995; Rabinovich et al. Citation2000a) discussed in detail in Nasr et al. (Citation2019), can be used.
4. Results and discussion
4.1. Model calculation
In this section, the results of particle removal from wavy surfaces using the developed model are presented. The critical shear velocities for a rough surface are compared with the critical shear velocity for detachment from a smooth flat surface under the same condition (). The critical shear velocity ratio is defined as,
(24)
(24)
where
is the critical shear velocity for particle removal from smooth surface determined using the available models (Nasr, Dhaniyala, and Ahmadi Citation2017; Ziskind, Fichman, and Gutfinger Citation1995, Citation1997; Soltani and Ahmadi Citation1994), given as,
(25)
(25)
The ratio captures the effect of relative effect of surface roughness on particle removal velocity for a selected particle-substrate combination. The removal threshold depends on wavelength (
), amplitude (
), particle size (
), and particle and substrate material properties. Here, the effect of wavelength and amplitude are investigated for glass particles on wavy glass and steel substrates in order to provide a better understanding of the trend of particle removal from surfaces with large scale roughness. The material properties of glass and steel are listed in . Thermodynamic work of adhesion,
is the key parameter for determining the adhesion force (EquationEquation (1)
(1)
(1) ), and the composite Young’s modulus takes into account the elastic behavior of the particle–surface contact.
Table 1. Material properties.
The critical shear velocity ratio for particle removal as a function of roughness wavelength for 10 µm glass particles and a roughness amplitude () of 1.25 µm, i.e.,
is shown in . For this combination of parameters, the critical shear velocity of particle removal from a smooth surface is
When the wavelength is much smaller than particle size (zone labeled as “1” in ), the critical shear velocity ratio is low as previously observed for the small roughness case. In this zone, the roughness primarily reduces the contact area relative to a smooth surface. As the wavelength becomes comparable to the particle size, the critical velocity ratio becomes several times larger than the smooth-surface critical shear velocity (zone “2”). The variation of critical shear velocity in this dimensional zone is due to two factors. First, in this zone, particles are in contact with the surface at two points and the contact distance,
increases with wavelength. The increase in contact distance results in an increase in adhesion resistance moment and, thus, the critical shear velocity for particle detachment. Moreover, in this wavelength range, surface radius of curvature at the contact point,
increases which increases adhesion force (EquationEquations (1)
(1)
(1) and Equation(2)
(2)
(2) ).
Figure 5. Critical shear velocity ratio versus surface wavelength normalized by particle size for (dp = 10 µm), for glass particle detached from glass surface. In the range of
the contact curvature changes abruptly from convex-convex to concave-convex and this is reflected in the sudden reduction in critical shear velocity ratio, shown by the dashed line.
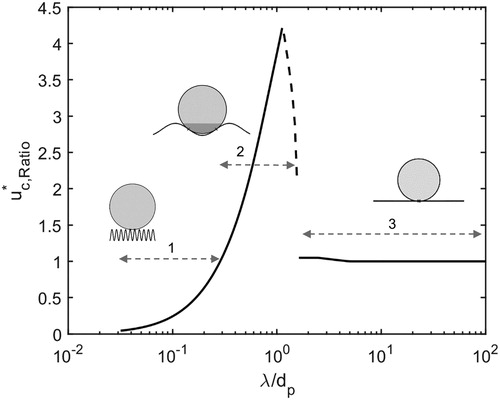
At however, the value of
begins to decrease rapidly. This is because, at this wavelength, the curvature at the contact points for our sinusoidal surface changes from convex to concave, as shown in , and this curvature change decreases adhesion force. As the curvature change happens abruptly, a relatively small change in the location of the contact points results in a sudden drop off of critical shear velocity in the range of
It must be noted that the JKR adhesion force (EquationEquation (1)
(1)
(1) ) is for a convex-convex contact of bodies (e.g., one sphere residing on another sphere), while the contact in zone “2” for
is a concave-convex one (e.g., one sphere residing inside a bigger sphere). This assumption results in our model suggesting a sudden decrease in critical shear velocity, though it is expected that the decrease would be smoother for real-world conditions.
As the wavelength increases and passes zone “3” is observed, where the particle-substrate contact switches from a two-point elastic contact to a single-point elastic contact. In this zone, the critical shear velocity is evaluated using EquationEquation (21)
(21)
(21) and as surface wavelength increases, the surface becomes flat, and the estimated critical shear velocity is the same as that for a smooth surface.
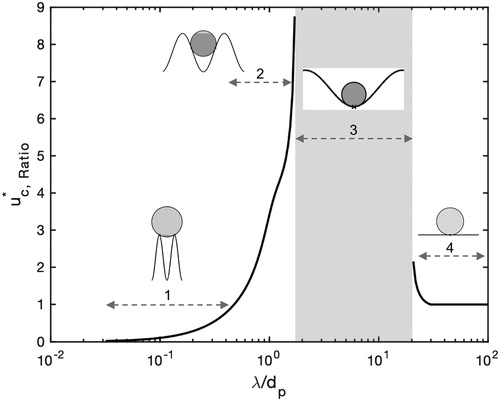
A similar analysis was conducted for a substrate with a larger roughness amplitude of A = 7.5 µm, with the same particle size (10 µm) and wavelength range (100 nm to 1 mm) as before and the results are shown in . In this figure, zones “1” and “2” are similar for this case as shown previously in . However, over a selected set of wavelengths (∼20 to 200 µm), no detachment of particles is predicted. In this zone (“3”) the trough to crest distance, is larger than the particle diameter, and hence, the particle is not exposed directly to the incoming flow stream. Thus, in our model there are no hydrodynamic forces acting to overcome the adhesion force for particle detachment and particle cannot be removed (trapped condition, see Section 3.3.2). As the wavelength is further increased, the external flow starts to penetrate the troughs and particles get exposed to the flow stream. As the wavelength further increases, the surface becomes similar to a flat surface and the critical shear velocity ratio approaches 1 (zone “4”). Note that, in this zone, the particle exposure to the airflow is obtained using EquationEquation (22)
(22)
(22) in Section 3.3.2.
Figure 6. Critical shear velocity ratio versus surface wavelength normalized by particle size for (dp = 10 µm), for glass particle detached from glass surface.
To understand the dependence of critical shear velocity ratio for a wide range of surface roughness parameter values, model predictions were obtained for removal of 10 µm glass particles from glass substrates for a range of roughness amplitudes and wavelengths and the results are presented as a contour map in .
Figure 7. Particle removal contour map of the model: critical shear velocity ratio color contour as function of normalized surface wavelength and amplitude (dp = 10 µm glass particle on glass substrate).
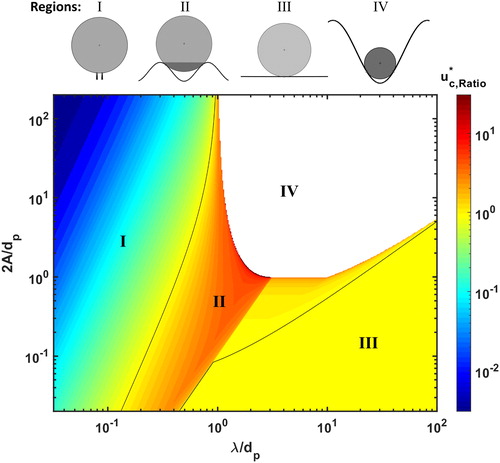
The critical shear velocity ratios vary over several orders of magnitude (∼0.02 to ∼30) and four major regions can be identified corresponding to different particle-substrate relative dimensions as illustrated in . The four regions are primarily separated by lines corresponding to of 1, i.e., where rough surface critical shear velocity matches that of a smooth surface. For particles residing in substrates with characteristics corresponding to Region (I), the adhesion resistance moment is small, and these particles can be easily removed, compared to a smooth flat surface. Substrates with these characteristics would be easy to clean. In Region (II), adhesion resistance moment is high because of the large width of the contact points and hydrodynamics forces are low because of limited exposure of particles to the airflow. Thus, detachment of particles from substrates with roughness characteristics of Region (II) is more difficult than from a flat surface. In Region (III), particles are in contact with nearly flat surface and the critical shear velocity is the same as that for the smooth surface model prediction. Region (IV) corresponds to very rough surfaces where particles remain trapped and cannot be removed with hydrodynamic forces.
4.2. Validation
There have been several experimental studies where the effect of small-scale (nanoscale) roughness on particle resuspension has been observed. The number of studies on large-scale roughness, however, is limited. In addition, the information provided on the detail of surface roughness in most relevant experimental studies is insufficient for model validation.
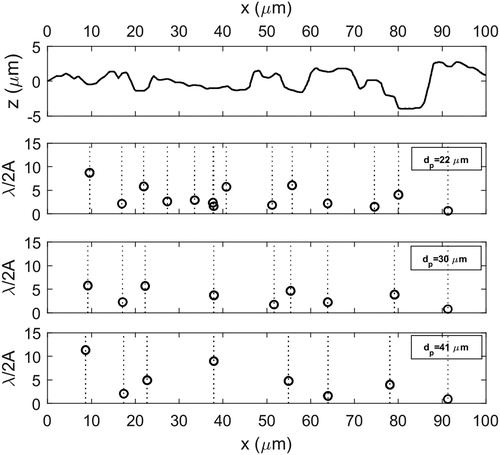
In this article, the experimental study of particle resuspension reported by Jiang et al. (Citation2008) is used for validation of the developed wavy surface particle removal model. Jiang et al. (Citation2008) studied the effect of different stainless-steel surface roughness types on resuspension of monodisperse spherical particles. Their study was performed for the cases that particle and surface roughness sizes are comparable. In addition, Jiang et al. (Citation2008) provided the roughness profile of the surfaces that allows investigating the particle-surface interaction. shows a sample of their roughness profile.
Figure 8. Roughness profile provided by Jiang et al. (Citation2008) and sample equilibrium positions of 22 µm particle. Amplitude is assumed to be the surface roughness value where the specific particle is located.
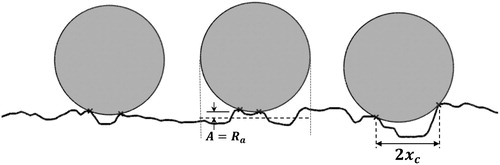
A sample two-dimensional segment of the experimental rough surface used in study of Jiang et al. (Citation2008) is shown in . The surface is, obviously, not uniformly rough – i.e., the amplitude and wavelength of roughness vary at different regions of the substrate. To determine equivalent amplitude and wavelengths of surface roughness, the possible equilibrium positions of 22, 30 and 41 µm spherical particles assuming two-point contact are first determined (as shown in for three samples of 22 µm particle). Note that other types of contact situations such as one-point contact are not considered in the analysis because the particle sizes (22, 30, and 41 µm) are large compared to surface roughness (=1.64 µm). The contact points of the particle with the surface segments are then identified for different particles sizes and the contact point distances, i.e.,
are determined. Using the determined values of
and
the wavelength of an equivalent sinusoidal wavy surface is established for each particle-substrate contact configuration using EquationEquation (8)
(8)
(8) . The surface wave amplitude is assumed to be equal to the
value of roughness where the particle is located as shown in . Considering the digitized substrate profiles and all possibilities of particles residing on them based on two contact-point equilibrium, a distribution of equivalent wavelengths and amplitudes is determined for the test substrates. In , one of the substrate roughness profiles is shown, along with locations where particles of different sizes will reside and the corresponding values of
Note that as particle sizes increase, there are fewer locations where particles can reside.
Figure 9. Values of at different locations for 22, 30, and 41 µm particle in contact with the rough surface profile provided by Jiang et al. (Citation2008).
The critical shear velocities for particle detachment can then be evaluated from the moment balance given by EquationEquation (19)(19)
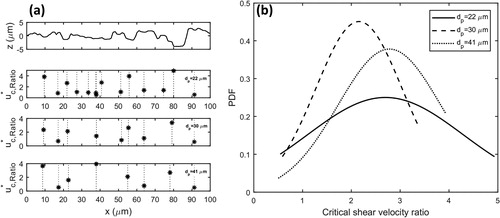
(19) for each of the locations considering material properties including thermodynamic work of adhesion and composite Young’s modulus for glass/stainless-steel listed in . shows the obtained critical shear velocity ratios of particle detachment in the same locations as discussed in . The fitted normal distributions of critical shear velocity ratios for three different particle sizes are shown in . The mean values of critical shear velocity ratio for all particle sizes are larger than one, indicating that it is harder to remove particles from these surfaces with large-scale roughness compared to smooth-flat surfaces, with the roughness having a larger impact on smaller particles.
Figure 10. (a) Predicted values of critical shear velocity ratio for detachment of 22, 30, and 41 µm particles as a function of location on the rough surface. (b) Variations of normal probability distribution of critical shear velocity ratio, for detachment of 22, 30, and 41 µm glass particles from a stainless-steel substrate. Here, the normal distribution is assumed.
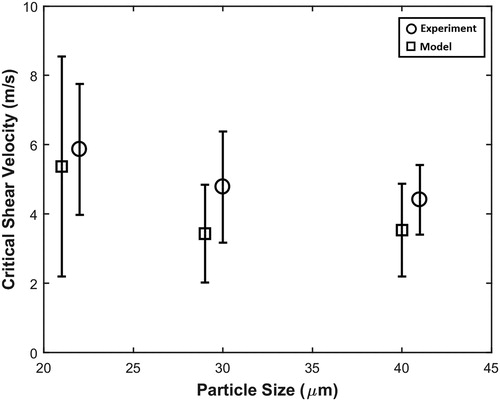
Using the mean and standard deviation of the evaluated distributions in , the predicted critical shear velocities can be compared against the measurement data of Jiang et al. (Citation2008). The experimental data are in the form of detachment fractions as a function of shear velocity. In order to compare the modeled critical shear velocity with the experimental data, the experimental critical shear velocity is defined as the velocity corresponding to 50 percent removal fraction as suggested by Ibrahim, Dunn, and Brach (Citation2003), and the uncertainty in critical shear velocity is represented by the range of velocities corresponding to 0.25 to 0.75 removal fractions (Nasr et al. Citation2019). The comparison of the critical shear velocity predicted by the wavy surface model with the experimental data of Jiang et al. (Citation2008) is shown in for 22, 30, and 41 µm glass particles. The model predictions show close agreement with the experimental data.
Figure 11. Comparison of the predictions of large-scale surface roughness model for removal of 22, 30, and 40 µm glass particles from a stainless steel substrate with the experimental data of Jiang et al. (Citation2008). Note, the model results are shown with a small shift in x-axis to avoid overlapping with experimental results.
5. Conclusions
In this study, the effect of roughness on particle detachment from surfaces in turbulent flows was investigated. A model for particle detachment using the JKR adhesion theory and rolling detachment mechanism from sinusoidal surfaces was developed. The model used a sinusoidal model to parameterize surface roughness using amplitude and wavelength. Critical shear velocities for removal of glass particles from wavy glass substrates were evaluated and compared against critical shear velocities for detachment from flat surfaces. The model results for critical shear velocity ratios showed a range of values from very small (0.002) to the very large ratio (∼30). The effect of surface roughness is strongly dependent on the relative value of roughness parameters and particle size. Four primary removal regions were identified based on particle-surface characteristics – Region (I) where surface roughness amplitude is low or wavelength of roughness is large and here particle removal is easier than smooth surfaces, Region (II), where surface roughness parameters are in the same length scale as the particle and particle removal is difficult relative to a smooth surface, Region (III), where particles are residing in regions with wavelengths much larger than the particle size and here smooth surface critical shear velocities are relevant, and Region (IV) where particles are much smaller than the roughness amplitude and the wavelengths are slightly larger than particle size and here particles will be trapped. Model performance is validated by comparison of predictions with published experimental results.
Our simplified model is a major advance in understanding the role of surface roughness in particle resuspension and can be used to design novel surfaces optimized either for easy cleaning or trapping of particles and for understanding the fate of particles from real-world substrates.
Additional information
Funding
References
- Ahmadi, G. 2015. Mechanics of Particle Adhesion and Removal., In Particle adhesion and removal. ed. K.L. Mittal, R. Jaiswal, 81–104. New Jersey, NJ. John Wiley & Sons.
- Brambilla, S., S. Speckart, M. N. Rush, G. A. Montano, and M. J. Brown. 2018. Glass particle resuspension from a contaminated (dirty) glass surface. J. Aerosol. Sci. 123:122–130. doi:10.1016/j.jaerosci.2018.06.011.
- Buckles, J., T. J. Hanratty, and R. J. Adrian. 1984. Turbulent flow over large-amplitude wavy surfaces. J. Fluid Mech. 140:27–44. doi:10.1017/S0022112084000495.
- Carrer, P., M. Maroni, D. Alcini, and D. Cavallo. 2001. Allergens in indoor air: environmental assessment and health effects. Sci. Total Environ. 270 (1–3):33–42. doi:10.1016/S0048-9697(00)00791-9.
- Cherukat, P., Y. Na, T. J. Hanratty, and J. B. McLaughlin. 1998. Direct numerical simulation of a fully developed turbulent flow over a wavy wall. Theor. Comput. Fluid Dyn. 11 (2):109–134. doi:10.1007/s001620050083.
- Cleaver, J. W., and B. Yates. 1973. Mechanism of detachment of colloidal particles from a flat substrate in a turbulent flow. J. Colloid Interface Sci 44 (3):464–474. doi:10.1016/0021-9797(73)90323-8.
- Cooper, K., A. Gupta, and S. Beaudoin. 2001. Simulation of the adhesion of particles to surfaces. J. Colloid Interface Sci. 234 (2):284–292. doi:10.1006/jcis.2000.7276.
- Derjaguin, B. V., V. M. Muller, and Y. P. Toporov. 1975. Effect of contact deformations on the adhesion of particles. J. Colloid Interface Sci. 53 (2):314–326. doi:10.1016/0021-9797(75)90018-1.
- Dobkin, D., and M. K. Zuraw. 2003. Principles of chemical vapor deposition. Netherlands: Springer.
- Eichenlaub, S., A. Gelb, and S. Beaudoin. 2004. Roughness models for particle adhesion. J. Colloid Interface Sci. 280 (2):289–298. doi:10.1016/j.jcis.2004.08.017.
- Ferro, A. R., R. J. Kopperud, and L. M. Hildemann. 2004. Source strengths for indoor human activities that resuspend particulate matter. Environ. Sci. Technol. 38 (6):1759–1764. doi:10.1021/es0263893.
- Fuller, K. N. G., and D. Tabor. 1975. The effect of surface roughness on the adhesion of elastic solids. Proc. R. Soc. A Math. Phys. Eng. Sci. 345 (1642):327–342. doi:10.1098/rspa.1975.0138.
- Götzinger, M., and W. Peukert. 2004. Particle adhesion force distributions on rough surfaces. Langmuir 20 (13):5298–5303. doi:10.1021/la049914f.
- Greenwood, J. A., and J. B. P. Williamson. 1966. Contact of nominally flat surfaces. Proc. R. Soc. A Math. Phys. Eng. Sci. 295 (1442):300–319.
- Henry, C., and J.-P. Minier. 2018. Colloidal particle resuspension: on the need for refined characterisation of surface roughness. J. Aerosol Sci. 118:1–13. doi:10.1016/j.jaerosci.2018.01.005.
- Henry, C., and J.-P. Minier. 2014. Progress in particle resuspension from rough surfaces by turbulent flows. Prog. Energy Combust. Sci. 45:1–53. doi:10.1016/j.pecs.2014.06.001.
- Hertz, H. 1896. Über die berührung fester elastischer Körper (On the contact of rigid elastic solids) In: Miscellaneous papers. Jones and Schott, London.
- Hinds, W. C. 1999. Aerosol technology: properties, behavior, and measurement of airborne particles. 2nd ed. New York, NY: John Wiley & Sons.
- Hudson, J. D., L. Dykhno, and T. J. Hanratty. 1996. Turbulence production in flow over a wavy wall. Exp. Fluids 20 (4):257–265. doi:10.1007/BF00192670.
- Ibrahim, A. H., P. F. Dunn, and R. M. Brach. 2003. Microparticle detachment from surfaces exposed to turbulent air flow: controlled experiments and modeling. J. Aerosol. Sci. 34 (6):765–782. doi:10.1016/S0021-8502(03)00031-4.
- Ibrahim, A. H., P. F. Dunn, and M. F. Qazi. 2008. Experiments and validation of a model for microparticle detachment from a surface by turbulent air flow. J. Aerosol. Sci. 39 (8):645–656. doi:10.1016/j.jaerosci.2008.03.006.
- Jiang, Y., S. Matsusaka, H. Masuda, and Y. Qian. 2008. Characterizing the effect of substrate surface roughness on particle–wall interaction with the airflow method. Powder Technol. 186 (3):199–205. doi:10.1016/j.powtec.2007.11.041.
- Johnson, K. L., K. Kendall, and A. D. Roberts. 1971. Surface energy and the contact of elastic solids. Proc. R. Soc. A Math. Phys. Eng. Sci. 324 (1558):301–313. doi:10.1098/rspa.1971.0141.
- Kesavan, J., P. Humphreys, B. Nasr, G. Ahmadi, C. K. Knox, E. Valdes, V. Rastogi, and S. Dhaniyala. 2017. Experimental and computational study of reaerosolization of 1 to 5 μm PSL microspheres using jet impingement. Aerosol Sci. Technol. 51 (3):377–387. doi:10.1080/02786826.2016.1265081.
- Kopperud, R. J., A. R. Ferro, and L. M. Hildemann. 2004. Outdoor versus indoor contributions to indoor particulate matter (PM) determined by mass balance methods. J. Air Waste Manage. Assoc 54 (9):1188–1196. doi:10.1080/10473289.2004.10470983.
- Liu, Z., A. Kareem, and D. Yu. 1993. Numerical modelling of flow over a rigid wavy surface by LES. J. Wind Eng. Ind. Aerodyn. 46–47 (C):245–254. doi:10.1016/0167-6105(93)90290-5.
- Mani, M., and R. Pillai. 2010. Impact of dust on solar photovoltaic (PV) performance: Research status, challenges and recommendations. Renew. Sustain. Energy Rev. 14 (9):3124–3131. doi:10.1016/j.rser.2010.07.065.
- Muller, V. M., V. S. Yushchenko, and B. V. Derjaguin. 1980. On the influence of molecular forces on the deformation of an elastic sphere and its sticking to a rigid plane. J. Colloid Interface Sci. 77 (1):91–101. doi:10.1016/0021-9797(80)90419-1.
- Nasr, B., G. Ahmadi, A. R. Ferro, and S. Dhaniyala. 2019. Overview of mechanistic particle resuspension models: Comparison with compilation of experimental data. J. Adhes. Sci. Technol. 33 (24):2631–2660. doi:10.1080/01694243.2019.1650989.
- Nasr, B., S. Dhaniyala, and G. Ahmadi. 2017. Particle Resuspension From Surfaces: Overview of Theoretical Models and Experimental Data. In Developments in surface contamination and cleaning: Types of contamination and contamination resources. ed. R. Kohli, K.L. Mittal, Vol. 10, 55–84. Cambridge, MA: William Andrew. doi:10.1016/B978-0-323-43158-3.00002-2.
- Nicholson, K. W. 1988. A review of particle resuspension. Atmos. Environ. 22 (12):2639–2651. doi:10.1016/0004-6981(88)90433-7.
- O’Neill, M. E. 1968. A sphere in contact with a plane wall in a slow linear shear flow. Chem. Eng. Sci. 23 (11):1293–1298.
- Otani, Y., N. Namiki, and H. Emi. 1995. Removal of fine particles from smooth flat surfaces by consecutive pulse air jets. Aerosol Sci. Technol. 23 (4):665–673. doi:10.1080/02786829508965346.
- Pant, P., and R. M. Harrison. 2013. Estimation of the contribution of road traffic emissions to particulate matter concentrations from field measurements: a review. Atmos. Environ. 77:78–97. doi:10.1016/j.atmosenv.2013.04.028.
- Qian, J., D. Hospodsky, N. Yamamoto, W. W. Nazaroff, and J. Peccia. 2012. Size-resolved emission rates of airborne bacteria and fungi in an occupied classroom. Indoor Air 22 (4):339–351. doi:10.1111/j.1600-0668.2012.00769.x.
- Rabinovich, Y. I., J. J. Adler, A. Ata, R. K. Singh, and B. M. Moudgil. 2000a. Adhesion between nanoscale rough surfaces. J. Colloid Interface Sci. 232 (1):10–16. doi:10.1006/jcis.2000.7167.
- Rabinovich, Y. I., J. J. Adler, A. Ata, R. Singh, and B. Moudgil. 2000b. Adhesion between nanoscale rough surfaces 2. J. Colloid Interface Sci. 232 (1):17–24. doi:10.1006/jcis.2000.7168.
- Reeks, M. W., and D. Hall. 2001. Kinetic models for particle resuspension in turbulent flows: theory and measurement. J. Aerosol. Sci. 32 (1):1–31. doi:10.1016/S0021-8502(00)00063-X.
- Rubbert, A., F. Hennig, M. Klaas, H. Pitsch, W. Schröder, and N. Peters. 2017. Streamline segment scaling behavior in a turbulent wavy channel flow. Exp. Fluids 58 (2):10.
- Rush, M. N., S. Brambilla, S. Speckart, G. A. Montaño, and M. J. Brown. 2018. Glass-particle adhesion-force-distribution on clean (laboratory) and contaminated (outdoor) surfaces. J. Aerosol Sci. 123:231–244. doi:10.1016/j.jaerosci.2018.06.002.
- Schwarz, T. 2001. Heat transfer and fouling behaviour of siemens PWR steam generators – long-term operating experience. Exp. Therm. Fluid Sci. 25 (5):319–327. doi:10.1016/S0894-1777(01)00080-2.
- Soltani, M., and G. Ahmadi. 1995. Particle detachment from rough surfaces in turbulent flows. J. Adhes. 51 (1–4):105–123. doi:10.1080/00218469508009992.
- Soltani, M., and G. Ahmadi. 1994. On particle adhesion and removal mechanisms in turbulent flows. J. Adhes. Sci. Technol. 8 (7):763–785. doi:10.1163/156856194X00799.
- Soltani, M., G. Ahmadi, R. G. Bayer, and M. A. Gaynes. 1995. Particle detachment mechanisms from rough surfaces under substrate acceleration. J. Adhes. Sci. Technol. 9 (4):453–473. doi:10.1163/156856195X00392.
- Tabor, D. 1977. Surface forces and surface interactions. J. Colloid Interface Sci. 58 (1):2–13.
- Thatcher, T. 1995. Deposition, resuspension, and penetration of particles within a residence. Atmos. Environ. 29 (13):1487–1497. doi:10.1016/1352-2310(95)00016-R.
- Zhang, H., and G. Ahmadi. 2000. Aerosol particle removal and re-entrainment in turbulent channel Flows - A direct numerical simulation approach. J. Adhes. 74 (1–4):441–493. doi:10.1080/00218460008034541.
- Zhang, X., and G. Ahmadi. 2007. Effects of capillary force and surface deformation on particle removal in turbulent flows. J. Adhes. Sci. Technol. 21 (16):1589–1611. doi:10.1163/156856107782793212.
- Zilker, D. P., G. W. Cook, and T. J. Hanratty. 1977. Influence of the amplitude of a solid wavy wall on a turbulent flow. Part 1. Non-separated flows. J. Fluid Mech. 82 (1):29–51. doi:10.1017/S0022112077000524.
- Zilker, D. P., and T. J. Hanratty. 1979. Influence of the amplitude of a solid wavy wall on a turbulent flow. Part 2. Separated flows. J. Fluid Mech. 90 (2):257–271. doi:10.1017/S0022112079002196.
- Ziskind, G. 2006. Particle resuspension from surfaces: Revisited and re-evaluated. Rev. Chem. Eng. 22 (1–2):1–123. doi:10.1515/REVCE.2006.22.1-2.1.
- Ziskind, G., M. Fichman, and C. Gutfinger. 1997. Adhesion moment model for estimating particle detachment from a surface. J. Aerosol Sci. 28 (4):623–634. doi:10.1016/S0021-8502(96)00460-0.
- Ziskind, G., M. Fichman, and C. Gutfinger. 1995. Resuspension of particulates from surfaces to turbulent flows—review and analysis. J. Aerosol Sci. 26 (4):613–644. doi:10.1016/0021-8502(94)00139-P.