
Abstract
Many acellular assays have been developed for assessing the oxidative potential (OP) of ambient PM2.5, yet no consensus has been reached on the most appropriate method. Most of these methods are highly time- and labor-intensive, making it difficult to analyze a large sample-set. Here, we have developed a semi-automated multi-endpoint ROS-activity analyzer (SAMERA) for measuring the five most commonly used endpoints of OP: consumption rate of dithiothreitol (OPDTT), ascorbic acid (OPAA-SLF) and glutathione (OPGSH-SLF), and the generation rate of •OH in DTT (OPOH-DTT) and in surrogate lung fluid (OPOH-SLF). A high analytical precision (coefficient of variation = 5–8% for all endpoints using positive controls such as Cu(II), Fe(II), phenanthrenequinone (PQ) and 5-hydroxy-1,4-naphthoquinone (5-H-1,4-NQ), and 8–13% using PM2.5 samples) was obtained for SAMERA. The results generated from SAMERA were in good agreement with those obtained from the manual operation using both positive controls (slope = 0.95–1.15 for automated vs. manual, R2 = 0.99) and ambient samples (slope = 0.89–1.09, R2 = 0.86–0.97). SAMERA takes 3 h to analyze one sample for all these OP endpoints, which is a substantial improvement over the manual analysis protocol. SAMERA was employed to analyze a subset (N = 44) of ambient PM2.5 samples collected from the Midwest US. Elevated OP activities in the week of Independence Day (3–5 July, 2018) were observed for most endpoints measured by SAMERA at all the sites. Preliminary results demonstrate the stability and capability of SAMERA for providing a comprehensive OP dataset, which can be integrated into the epidemiological models in future studies.
Copyright © 2019 American Association for Aerosol Research
1. Introduction
Numerous studies have investigated the adverse health effects of atmospheric particulate matter (PM) to humans (Cohen et al. Citation2017; Kampa and Castanas Citation2008; West et al. Citation2016). The generation of reactive oxygen species (ROS) by fine particles (PM2.5, particles size less than 2.5 µm) has emerged as one of the most promising hypotheses to explain these health effects (Abrams et al. Citation2017; Bates et al. Citation2015; Delfino et al. Citation2013; Maikawa et al. Citation2016; Sarnat et al. Citation2016; Yang et al. Citation2016; Zhang et al. Citation2016). Many transition metals and organic species present in ambient particles can catalyze the redox reactions in cellular environment, leading to the production of ROS like superoxide radicals (•O2−), hydroxyl radicals (•OH) and hydrogen peroxide (H2O2) (Feng et al. Citation2016; Longhin et al. Citation2013; Torres-Ramos et al. Citation2011). These species have very high reactivity; for example, the half-lives of •OH and H2O2 are only 10−9 and 10−3 s, respectively, in the cellular environment (D'Autréaux and Toledano Citation2007). •OH can quickly oxidize deoxyribonucleic acid (DNA), proteins and cytoplasmic membrane (Pham-Huy et al. Citation2008), while H2O2 can target the thiol (-SH) groups in functional proteins such as the enzyme glyceraldehyde-3-phosphate dehydrogenase, and degrades their enzymatic activity (Bonomini et al. Citation2008). Some of these ROS can be neutralized by the cellular antioxidant defense mechanism (Rahman et al. Citation2012). The capability of PM to generate ROS and/or consume antioxidants is referred to as the oxidative potential (OP). The OP of ambient PM2.5 has been linked with multiple health disorders, e.g., atherosclerosis (Araujo and Nel Citation2009; Sun et al. Citation2005), asthma (Delfino et al. Citation2013; Li et al. Citation2008; Yang et al. Citation2016), lung cancer (Knaapen et al. Citation2004; Oh et al. Citation2011), and cardiovascular diseases (Chuang et al. Citation2007; Kodavanti et al. Citation2000; Weichenthal et al. Citation2016). These findings indicate that the OP of PM2.5 might be a more relevant indicator in assessing the health outcomes of PM2.5 compared to their mass concentrations.
To assess the OP of PM, biological assays are considered more representative as they measure the specific biomarkers like interleukin-8 (IL-8) (Becker et al. Citation2005; Yan et al. Citation2016) and hemeoxygenase-1 (HO-1) expressions (Crobeddu et al. Citation2017; Li et al. Citation2008). However, the time- and labor-intensive experimental protocols of these studies limit their application to only small sample sizes. To overcome these problems, numerous non-biological (i.e., chemical) assays have been developed as substitutes to measure the OP of PM. These chemical assays have the advantages of higher reproducibility, higher accuracy, cheaper material cost, and much lesser time and labor.
Among all chemical assays, dithiothreitol (DTT) is the most commonly used probe for measuring the OP of PM (Charrier and Anastasio Citation2012; Cho et al. Citation2005; Fang et al. Citation2014; Verma et al. Citation2015a). The depletion process of DTT resembles the oxidation of dihydronicotinamide adenine dinucleotide phosphate (NADPH) in mitochondria and the formation of ROS such as •O2− and H2O2 (Alfadda and Sallam Citation2012). The consumption rate of DTT (OPDTT) is correlated with the largest pool of PM components, including elemental carbon (EC) (Antiñolo et al. Citation2015; Saffari et al. Citation2014), water soluble organic carbon (WSOC) (Verma et al. Citation2009; Verma et al. Citation2012), quinones (Charrier and Anastasio Citation2012), humic-like substances (HULIS) (Verma et al. Citation2015b), and transition metals (Charrier and Anastasio Citation2012; Sauvain et al. Citation2015). OPDTT has also been found to correlate with several biological endpoints, e.g., HO-1 expression (Li et al. Citation2003), fractional exhaled nitric oxide (Delfino et al. Citation2013; Zhang et al. Citation2016), an increased risk of asthma (Yang et al. Citation2016) and wheeze (Bates et al. Citation2015). However, •OH generated through Fenton reaction by Cu(II) or Fe(II) is not represented by DTT depletion rate (Held et al. Citation1996). In our previous study, Xiong et al. (Citation2017) found that the consumption rate of DTT is well correlated with H2O2 generation, but not with •OH generation rate in DTT. Therefore, measuring both OPDTT and •OH generation in DTT assay (OPOH-DTT) can provide a wider scope of OP induced by different PM components.
Other than the DTT assay, the consumption rates of several antioxidants present in epithelial lining fluid have also been used as the indicators of OP. The most commonly indices in this category are the depletion rate of ascorbic acid (AA; OPAA) (Fang et al. Citation2016; Janssen et al. Citation2014; Visentin et al. Citation2016) and reduced glutathione (GSH; OPGSH) (Ayres et al. Citation2008; Künzli et al. Citation2006; Mudway et al. Citation2005). Both OPAA and OPGSH are found to be sensitive to certain transition metals like Fe(II) and Cu(II) (Ayres et al. Citation2008; Godri et al. Citation2011; Künzli et al. Citation2006). A large-scale OP study in the Southeast US found that OPAA has a narrower sensitivity spectrum for PM components and therefore has lesser biological relevance compared to OPDTT (Fang et al. Citation2016).
A surrogate lung fluid (SLF) containing multiple antioxidants (AA, GSH, uric acid; UA, and citric acid; CA) is generally used to simulate the epithelial lung lining fluid (Charrier et al. Citation2014), and generation rates of ROS (e.g., •OH and H2O2) in SLF catalyzed by the ambient PM are also used as the indices for OP determination (Charrier and Anastasio Citation2015; Charrier et al. Citation2014; Shen et al. Citation2011). Previous studies have shown that Cu(II) dominated the generation of H2O2 in SLF (96%) (Charrier et al. Citation2014), while both Cu(II) and Fe(II) contributed to •OH generation (up to 92%) in SLF (OPOH-SLF) (Charrier and Anastasio Citation2015). Quinone compounds contributed marginally (at most 4% and 8% for H2O2 and •OH, respectively) to the generation of ROS in SLF.
Although various chemical assays have been developed to quantify the OP of ambient PM, no consensus has been reached in the scientific community for selecting the most appropriate method. Among several available OP endpoints, OPDTT, OPOH-DTT, OPAA, OPGSH and OPOH-SLF are the ones, which have shown some promises in terms of their biological relevance (Abrams et al. Citation2017; Bates et al. Citation2015; Janssen et al. Citation2015; Ma et al. Citation2015; Maikawa et al. Citation2016; Wang et al. Citation2018; Weichenthal et al. Citation2016; Yang et al. Citation2016). These five endpoints are highly reproducible and cover the ROS-expression pathways by most of the redox active PM components. However, each of these methods takes 1–2 h to perform, thus consuming almost one graduate student – day to analyze one sample. To overcome this limitation, we have developed an automated instrument, which measures all these OP endpoints for a given ambient PM aqueous extract in 3 h. The instrument named Semi-Automated Multi-Endpoint ROS-activity Analyzer (SAMERA) is developed from the prototype of a semi-automated DTT activity system described in Fang et al. (Citation2014), and is able to serve for 24-h unattended sample analysis. We tested the response of SAMERA using select sensitive chemical compounds for individual endpoints. We also evaluated the performance of SAMERA for both precision and accuracy using positive controls and water-soluble ambient PM2.5 extracts. The OP results of ambient samples on all the endpoints are compared with those reported in previously published studies. Finally, we demonstrated the potential application of SAMERA by analyzing a subset of large number of ambient PM2.5 samples collected from the Midwest US.
2. Materials and methods
2.1. Chemicals
AA, CA, UA, GSH, DTT, 9,10-Phenanthrenequinone (PQ), 5-hydroxy-1,4-naphthoquinone (5-H-1,4-NQ), 2-hydroxyterephthalic acid (2-OHTA), 5,5′-dithiobis-(2-nitrobenzoic acid) (DTNB), o-phthaldialdehyde (OPA), copper (II) sulfate pentahydrate (CuSO4•5H2O), iron (II) sulfate heptahydrate (FeSO4•7H2O), potassium phosphate monobasic (KH2PO4) and potassium phosphate dibasic (K2HPO4) were obtained from Sigma-Aldrich (St. Louis, MO, USA). Sodium hydroxide (NaOH) was obtained from VWR International Inc. (Radnor, PA, USA). Disodium terephthalate (TPT) was obtained from Alfa Aesar (Tewksbury, MA, USA).
The stock solutions of 20 mM AA, 30 mM CA, 10 mM UA and 10 mM GSH were made in 10 mL de-ionized water (DI; Milli-Q; resistivity = 18.2 MΩ/cm) separately, stored at 4 °C in the refrigerator, and used within one week. 50 µL of 4 M NaOH was added into UA stock solution to adjust pH and dissolve UA. SLF solution was made fresh daily by mixing equal volumes (1 mL each) of four antioxidant stock solutions and diluting the mixture by DI to 10 mL. The stock solution of 10 mM DTT was made and stored in the refrigerator for at most two months. DTT solution used in SAMERA was made daily by diluting 1 mL of DTT stock solution into 10 mL DI. 0.5 mM potassium phosphate buffer (K-PB; pH = 7.4) was prepared by dissolving 26.94 g KH2PO4 and 139.70 g K2HPO4 in 2 L of DI. 50 mM TPT solution was made by dissolving 5.31 g TPT in 500 mL of 0.5 mM K-PB. 10 mM DTNB stock solution was prepared in methanol and stored in the refrigerator for no longer than two months. 0.2 mM DTNB solution used in SAMERA was made weekly by diluting 10 mL of DTNB stock solution into 500 mL of DI. 2 mM OPA solution was made by dissolving 134.1 mg of OPA in 1 mL methanol, followed by dilution with DI to 500 mL. 10 mM PQ and 5-H-1,4-NQ stock solutions were made in DMSO every day prior to the experiments. The stock solutions of 10 mM CuSO4 and 10 mM FeSO4 were prepared in DI every day prior to the experiments. The final solutions for the positive control chemicals (i.e., PQ, 5-H-1,4-NQ, Cu(II) and Fe(II)) were obtained by serially diluting the stock solutions in DI.
2.2. System setup
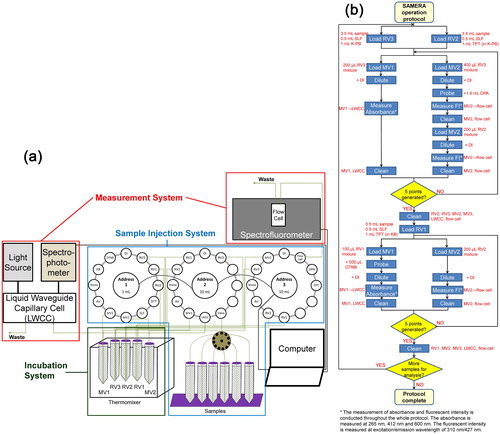
The schematic diagram of SAMERA is shown in . SAMERA consists of three major parts: sample injection, sample incubation, and measurement system. The sample injection system includes three Kloehn programable syringe pumps (IMI precision, Littleton, CO, USA) and a 14-port multi-position valve (VICI® Valco Instrument Co. Inc., Houston, TX, USA). The Kloehn syringe pumps serve for dispensing the solutions between chemical reservoirs, various vials and the flow cells. The multi-position valve connects the sample vials to one of the syringe pumps (Pump 2) and is controlled by a valve actuator (VICI®), which consecutively selects different samples for analysis. The sample incubation system employs an Eppendorf ThermoMixer (Eppendorf North America, Hauppauge, NY, USA) for holding and incubating three centrifuge tubes (also called reaction vials, RV1, RV2 and RV3) at a constant temperature (37 °C), while continuously shaking at a frequency of 400 rpm. There are two components in the measurement system – a spectrophotometer and a spectrofluorometer. The spectrophotometer (Ocean Optics, Dunedin, FL, USA) consists of an ultraviolet-visible-near-infrared (UV − Vis-NIR) light source as well as a multiwavelength light detector, and is used for detecting the absorbance of the targeted compound in OPAA and OPDTT analyses. The Fluoromax-4 spectrofluorometer (Horiba Scientific, Edison, NJ, USA) serves to measure the fluorescence of the indicator compounds for the determination of GSH and •OH.
Figure 1. The system setup (a) and algorithm (b) of Semi-Automated Multi-Endpoint ROS Activity Analyzer (SAMERA).
2.3. OP analysis protocol
The algorithm for OP analysis in SAMERA is shown in . The five endpoints are measured in two separate stages. OPAA-SLF, OPGSH-SLF and OPOH-SLF are measured in the first stage following an SLF-based protocol, while a DTT assay is conducted to measure OPDTT and OPOH-DTT in the second stage. Since the consumption of AA and GSH was measured in SLF in our study, we have denoted these OP endpoints as OPAA-SLF and OPGSH-SLF, to distinguish them from the studies directly measuring AA and GSH without any SLF (simply denoted as OPAA and OPGSH here).
2.3.1. SLF-based protocol
The SLF-based protocol involves three steps. In the first (incubation) step, 3.5 mL of the sample (either PM filter extract or chemical standard), 1 mL of K-PB (pH = 7.4) and 0.5 mL of SLF (final concentrations of AA, GSH, UA and CA in RV as 200 µM, 100 µM, 100 µM, and 300 µM, respectively following Charrier and Anastasio [Citation2015] protocol) are loaded separately into RV2 and RV3 kept in the ThermoMixer through injection system (see . The only difference in the content of RV2 and RV3 is that the K-PB in RV2 contains TPT (50 mM) to immediately capture the •OH generated in the reaction. In the second (probing) step, two small aliquots (200 µL and 400 µL) are withdrawn separately from RV3 using the same injection system, and transferred to the measurement vials 1 and 2 (MV1 and MV2), respectively. This injected mixture is diluted by DI in MV1 for measuring AA, while 1.6 mL of OPA is added into MV2 for probing GSH in the injected mixture. GSH reacts with OPA, forming a fluorescent product (referred as GS-OPA hereafter), which can be detected by a spectrofluorometer (Böhmer et al. Citation2011). In the third (measurement) step, the diluted mixture in MV1 is withdrawn from the vial and pushed through a liquid waveguide capillary cell (LWCC-3100; World Precision Instruments, Inc., Sarasota, FL, USA), where the absorbance at 265 nm and 600 nm (background) is measured by the spectrophotometer and is recorded by Ocean Optics SpectraSuite software. The background corrected absorbance at 265 nm (Abs265nm – Abs600nm) is used to determine the concentration of residual AA in RV2. Similarly, the mixture in MV2 is further diluted and injected into the flow cell of the spectrofluorometer. The fluorescence intensity is measured at the excitation/emission wavelength of 310 nm/427 nm, to determine the concentration of GS-OPA. Although the peak absorbance and emission of GS-OPA is at 340 nm and 420 nm wavelength (Roušar et al. Citation2012), an excitation/emission wavelength of 310/427 nm with a slit width of 5 nm is selected to allow the measurement of both GS-OPA and 2-OHTA (fluorescent product of •OH and TPT, discussed later), without the need of changing the slit position. Figure S1 in the supplemental information (SI) shows the contour plot of fluorescence intensity and calibration curves at different excitation/emission wavelengths for GS-OPA, indicating no significant difference for GS-OPA measurement at either of these wavelengths settings. The MVs and flow cells are cleaned with DI immediately after each measurement step. Steps 2 and 3 are repeated five times at designated time intervals (i.e., 5 min, 24 min, 43 min, 62 min, and 81 min) to determine the consumption rate of AA and GSH. Calibration curves to quantify AA and GSH are prepared by measuring initial absorbance and fluorescence intensity of different known concentrations of AA and GSH in SLF, following the same protocol as described above. The consumption rate of both AA and GSH is then derived from these calibration curves.
The measurement of •OH is conducted around the same time as GSH and AA. TPT present in RV2 reacts with •OH and forms a fluorescent product: 2-OHTA. At designated time intervals (i.e., 10 min, 29 min, 48 min, 67 min, and 86 min), a small aliquot (200 µL) of the reaction mixture in RV2 is withdrawn into MV2, and diluted by DI. The diluted mixture in MV2 is then passed through the flow cell of the spectrofluorometer. The peak absorbance of 2-OHTA is at 310 nm, while the emission intensity peaks at 427 nm. Therefore, the same wavelength settings (as used for the GS-OPA measurements) are used to determine the concentration of 2-OHTA. The concentration of 2-OHTA in the reaction mixture is derived by calibrating the spectrofluorometer with known concentrations (0–200 nM) of 2-OHTA standards. The concentrations of •OH are then calculated after dividing 2-OHTA concentration by 0.35 – the yield of 2-OHTA from the reaction between TPT and •OH (Son et al. Citation2015). The flow cell and MV2 are cleaned with DI immediately after the measurement. After completing all the measurements of AA, GSH in RV3 and •OH in RV2 at different time intervals, SAMERA performs a final cleaning of all the vials (i.e., RV2, RV3, MV1 and MV2), connection tubes and flow cells by rinsing them with DI, to prepare the system for the DTT assay.
2.3.2. DTT assay
The protocol of DTT assay is adapted from our previous publication (Yu et al. Citation2018), and combines the •OH generation measurement into the automated OPDTT analysis protocol, following the same three step process as in SLF-based protocol. In the first incubation step, 3.5 mL of sample, 0.5 mL of 1 mM DTT and 1 mL of 50 mM K-PB-buffered TPT are added into RV1. Our tests have shown that the addition of TPT in the reaction vial does not affect the consumption rate of DTT (see Section S2 and Figure S2 in SI). At specific time intervals (5 min, 17 min, 29 min, 41 min, and 53 min), a small aliquot (100 µL) of the reaction mixture from RV1 is taken out and added to 500 µL of 200 µM DTNB in measurement vial 1 (MV1) (probing step). DTNB combines with residual DTT in the mixture, and forms a yellow colored complex, 2-nitro-5-thiobenzoic acid (TNB). The mixture in MV1 is then diluted and passed through LWCC, where the absorbance at 412 nm and 600 nm (background) is measured by the spectrophotometer and recorded by Ocean Optics SpectraSuite software. A DTT calibration curve is also prepared by measuring the initial absorbance of different known concentrations of DTT (0–100 µM). Simultaneously with the DTT measurement (i.e., 5 min, 17 min, 29 min, 41 min, and 53 min), another aliquot (200 µL) of the mixture from RV1 is withdrawn and diluted with DI in MV2. The measurement of •OH then follows in the same manner as •OH concentration in SLF. All MVs and flow cells are cleaned with DI immediately after each measurement step.
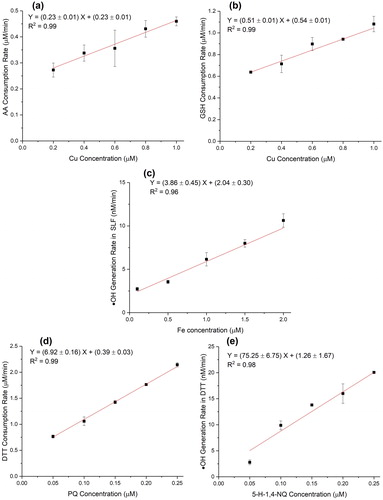
Figure 2. OP as a function of the concentration of positive controls: (a) OPAA-SLF vs. Cu(II) concentrations; (b) OPGSH-SLF vs. Cu(II) concentrations; (c) OPOH-SLF vs. Fe(II) concentrations; (d) OPDTT vs. PQ concentrations; (e) OPOH-DTT vs. 5-H-1,4-NQ concentrations. The error bars represent the standard deviation of triplicate OP analysis.
After all, five endpoints are measured for a given sample, SAMERA performs a final self-cleaning operation for all RVs, MVs, LWCC and flow cell by rinsing them with DI, before the next run of analysis. The next sample is selected by the multi-position valve using VCOM software. The system is thoroughly cleaned at least three times every week by replacing all the reagents and chemicals with DI and run the same code as for the sample analysis. The procedure for mass and volume normalized OP (OPm and OPv, respectively) determination from the raw absorbance and fluorescence intensity data is described in the SI (Section S3 and Figure S3).
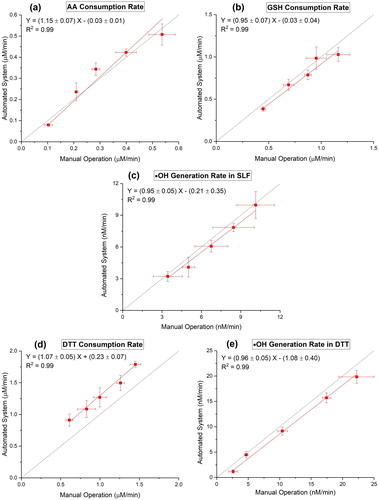
Figure 3. Comparison of manual operation (X axis) and automated system (Y axis) using four positive controls: (a) OPAA-SLF of Cu(II); (b) OPGSH-SLF of Cu(II); (c) OPOH-SLF of Fe(II); (d) OPDTT of PQ; (e) OPOH-DTT of 5-H-1,4-NQ. The error bars on X and Y axes denote the standard deviation of triplicate OP analysis by both manual operation and automated system, respectively. The identity line is plotted as the dotted line.
2.4. Ambient samples collection and preparation
2.4.1. Sampling
Ambient PM2.5 samples were collected on prebaked quartz filters (Pall Tissuquartz™, 8” × 10”) using high-volume samplers (flow rate = 1.13 m3/min; PM2.5 inlets, Tisch Environmental; Cleves, OH) installed at five sites in the Midwest US. The map of all sites is shown in Figure S4 in SI. Champaign (CMP) site is located on a parking garage (∼30 m from ground level) in the campus of University of Illinois at Urbana-Champaign (UIUC) and is adjacent to a major road (University Ave.) in Urbana, IL. Bondville (BON) site is located in a rural area, 15 km west of downtown Champaign. Chicago (CHI) site is located on the rooftop (∼40 m from the ground level) of a student dormitory building (Carman hall) in Illinois Institute of Technology (IIT) campus, which is 0.5 km east of a 6-lane interstate highway I-90/94 and 1.5 km west of Lake Michigan. Indianapolis (IND) site is located in the campus of Indiana University – Purdue University Indianapolis (IUPUI) and is close to downtown Indianapolis (2 km southeast of the site) and a 4-lane interstate highway I-65 (1 km northeast of the site). St. Louis (STL) site is located in the north-central area of St. Louis (3247 Blair St.), and is part of the National Core Pollutants (NCore) Network of USEPA. The site is surrounded by multiple industries for steel and vehicle part fabrication.
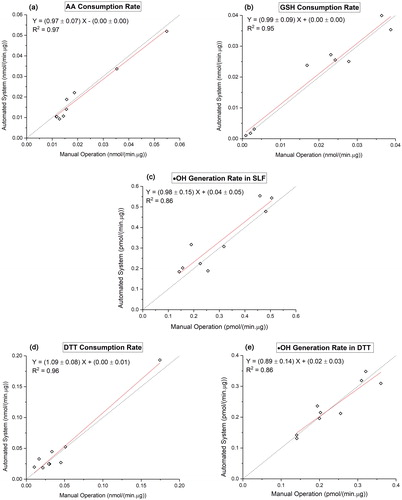
Figure 4. Comparison of manual operation (X axis) and automated system (Y axis) using ambient Hi-Vol filter samples (N = 9): (a) OPAA-SLF; (b) OPGSH-SLF; (c) OPOH-SLF; (d) OPDTT; (e) OPOH-DTT. The identity line is plotted as the dotted line.
All PM2.5 samples analyzed in the current study were collected for a sampling duration of 72 h in the months of May, June and July 2018. The samples used for assessing the precision and accuracy of SAMERA (discussed in Section 2.5) were collected separately at CMP site (N = 10). Sufficient field blank filters (N = 10) were also collected during the sampling. The exact dates of filter collection for different experiments are provided in Table S1 (SI). All filter samples were weighed before and after PM2.5 collection using a lab-scale digital balance (±0.2 mg readability; Sartorius A120S, Götingen, Germany) for determining PM mass loadings on the filters. The filters were equilibrated for at least 24 h in a control room with constant temperature (20 °C) and relative humidity (RH = 50%) before weighing. The filters were wrapped in prebaked (at 550 °C) aluminum foils and stored in a freezer at −20 °C immediately after weighing.
Table 1. The average blank levels and LOD of SAMERA for five OP endpoints as measured from both DI blanks and field blank filters.
2.4.2. PM extraction from the filters
Before analysis, a few (usually 2–5) punches (1” diameter each) were taken from the PM2.5 filters by a metallic punch, and extracted in 20 mL DI using an ultrasonic water bath (Cole-Palmer, Vernon-Hills, IL, USA). These extracts were filtered through a 0.45 µm polytetrafluoroethylene (PTFE) syringe filter to remove the insoluble components. The filtered extracts were then analyzed by SAMERA for all five OP endpoints (i.e., OPAA-SLF, OPGSH-SLF, OPOH-SLF, OPDTT and OPOH-DTT).
2.5. Performance evaluation of SAMERA
The performance of SAMERA was evaluated by measuring the limit of detection (LOD), instrument response, precision and accuracy for five OP endpoints using blanks, positive controls and ambient samples. The LOD was obtained by analyzing multiple blanks (both DI and field blank filters). Four redox-active chemicals (Cu(II), Fe(II), PQ and 5-H-1,4-NQ) were selected as the positive controls to test the instrument response for five endpoints. Precision was assessed by analyzing the same sample multiple times, while accuracy was determined by comparing the results obtained from SAMERA with that from the manual analysis of a given set of samples (discussed in next section). All OP assays on the positive controls for assessing instrument response, precision and accuracy were conducted in triplicates.
3. Results and discussions
3.1. Limit of detection (LOD)
The LOD of SAMERA is defined as three times of the standard deviation of OP activities for blanks. Both DI and field blank filters were used as the blanks for assessing LOD. lists the average blank level and LOD for five OP endpoints. The LOD determined from DI is useful to determine the minimum concentration of chemical standards, which are prepared in DI, while that from field blanks is important for the ambient PM samples. However, the expression of LOD in terms of the PM mass is complicated as it depends on many factors, such as extraction protocol (e.g., volume of water used for PM extraction and the filter area which can be submerged in that volume), and the concentration of redox-active substances in the PM. In previous studies, at least 50 µg/mL of PM in the reaction mixture was generally used for OPAA and OPGSH measurements (Ayres et al. Citation2008; Künzli et al. Citation2006; Mudway et al. Citation2005), while OPDTT was found to be sensitive enough even at 10 µg/mL of PM (Charrier et al. Citation2016; Fang et al. Citation2014). Based on the analysis of ten ambient samples at different concentrations in this study, we found that the endpoints OPDTT and OPOH-SLF are sufficiently above detection at 10 µg/mL, while other endpoints require higher concentrations – 30 µg/mL for OPOH-DTT and 50 µg/mL for OPAA-SLF and OPGSH-SLF. Therefore, to obtain a good performance of SAMERA for all the endpoints, we recommend using a minimum concentration of 50 µg/mL for SLF-based assays, and 30 µg/mL for DTT-based assays.
3.2. The response of SAMERA to positive controls
Four chemicals – Cu(II), Fe(II), PQ and 5-H-1,4-NQ, were selected as the positive controls separately for five OP endpoints based on their reported sensitivities, i.e., Cu(II) for OPAA-SLF and OPGSH-SLF (Ayres et al. Citation2008; Mudway et al. Citation2005), Fe(II) for OPOH-SLF (Charrier and Anastasio Citation2015; Vidrio et al. Citation2008), PQ for OPDTT (Cho et al. Citation2005; Xiong et al. Citation2017), and 5-H-1,4-NQ for OPOH-DTT (Xiong et al. Citation2017; Yu et al. Citation2018). All the calibration curves for different OP endpoints using these positive controls yield an excellent coefficient of determination (R2 = 0.96–0.99), as shown in . The slope of the calibration curve for OPDTT (6.92 ± 0.16 min−1) is close to the one obtained by Fang et al. (Citation2014) in the automated system based on the DTT assay (7.64 ± 0.51 min−1), adding confidence to the measurements obtained by SAMERA.
3.3. Precision
The analytical precision of SAMERA was assessed by analyzing ten parallel samples, i.e., respective positive controls of same concentration for each OP endpoint. The average and standard deviation of the OP activities measured from these analyses are listed in . A low coefficient of variation (CoV) for all five OP endpoints (4.9%-8.1%) indicates a high reproducibility of the results obtained from SAMERA.
Table 2. Precision of SAMERA as obtained by multiple (N = 10) measurements of various standard chemicals.
Overall precision of SAMERA was assessed by using ambient PM2.5 samples for five endpoints. Ten punches – each of 1” diameters were taken from the same Hi-Vol filter collected at CMP site, and extracted separately in 10 mL DI water. After filtering through a 0.45 µm PTFE syringe filter, the extracts were analyzed by SAMERA for all five endpoints. lists the average and standard deviation of the mass-normalized OP activities (OPm) for five endpoints. A slightly higher CoV (7.9–13.3%) compared to that by the positive controls is observed, which is reasonable due to higher uncertainties associated with extraction procedures, e.g., non-uniform mass loadings on the filter and variable PM extraction efficiencies.
Table 3. Precision of SAMERA as obtained by multiple (N = 10) measurements of an ambient PM2.5 sample.
3.4. Accuracy
SAMERA was validated for accuracy through comparison of its results with that from the manual operation, over a range of concentrations (same as used in ) of positive controls. shows the comparison of OP measured by manual operation (X axis) with that from SAMERA (Y axis) for all five endpoints using positive controls. The fitted lines from orthogonal regressions applied on two measurement approaches (i.e., automated vs. manual) yield slopes close to 1 (OPAA-SLF: 1.15 ± 0.07; OPGSH-SLF: 0.95 ± 0.07; OPOH-SLF: 0.95 ± 0.05; OPDTT: 1.07 ± 0.05; OPOH-DTT: 0.96 ± 0.05), with an excellent coefficient of determination (R2 > 0.98), indicating high accuracy of SAMERA as tested from the positive controls.
Accuracy was also tested using ambient samples. Nine ambient PM2.5 Hi-Vol filter samples collected at CMP site were extracted and analyzed for all five endpoints using both SAMERA and the manual operation. shows comparison of the mass-normalized OP activities (OPm) measured from two approaches for all five endpoints. Similar to positive controls, the slopes of the regression curves from the orthogonal fit of two measurement methods on five endpoints (OPAA-SLF: 0.97 ± 0.07; OPGSH-SLF: 0.99 ± 0.09; OPOH-SLF: 0.98 ± 0.15; OPDTT: 1.09 ± 0.08; OPOH-DTT: 0.89 ± 0.14) were close to 1, with high R2 (0.86–0.97). A 2-tailed paired t-test further demonstrates no significant differences (p > 0.05) in the results obtained from two measurement approaches (i.e., manual and automated) using both positive controls and the ambient samples.
3.5. Field application of SAMERA
An important objective of developing SAMERA is to employ it for generating large OP dataset. This dataset could then be integrated into epidemiological studies for testing the hypothesis of OP association with biological health endpoints. Therefore, we tested utility and stability of SAMERA by analyzing a subset of our large number of ambient PM samples (N ∼300) collected from five sites in the Midwest US. Note, the complete OP analysis along with a comprehensive chemical and toxicity characterization of these samples is currently underway and this will be a topic of our future manuscripts. Here, we show a snapshot of the data from only 44 samples collected during summer 2018, from the perspective of demonstrating the potential application of SAMERA in yielding an important OP dataset. All filters were extracted in DI and therefore only water-soluble fraction was analyzed.
shows the time series of both mass-normalized and volume-normalized OP endpoints. From the comparison of OPm, a substantial variation could be observed among the sites for several endpoints. For example, the samples from CMP had higher activities for OPAA-SLFm, OPGSH-SLFm and OPOH-SLFm endpoints than other sites. Our previous studies have observed significant concentrations of Cu (5–52 ng/m3) at this site (Puthussery et al. Citation2018; Wang et al. Citation2018), which is an important driver of these endpoints. Because CMP is adjacent to a major road (University Ave.), the emissions from brake wear and dust resuspension (Hulskotte et al. Citation2007) could contribute to Cu at this site. In contrast, CHI had higher activities for OPOH-SLFm, OPDTTm and OPOH-DTTm endpoints compared to IND and STL. In volume normalized activities (), a similar trend but with lesser variation than OPm among these sites can be observed for all five endpoints. Figure S5 in SI shows the ambient concentrations of PM2.5 mass at all these sites, which seem to have only marginal variations, except STL (higher levels than others). A significant variation in the mass normalized activities despite similar ambient concentration profiles of PM2.5 mass indicates that the composition of redox-active PM fraction varies substantially among these sites.
Figure 5. Mass and volume normalized OP of ambient PM2.5 using the Hi-Vol samples collected from five sites in the Midwest US (N = 44): (a) OPAA-SLF; (b) OPGSH-SLF; (c) OPOH-SLF; (d) OPDTT; (e) OPOH-DTT. Mass-normalized (OPm) and volume-normalized (OPv) of all samples are denoted by hollow and solid circles, respectively.
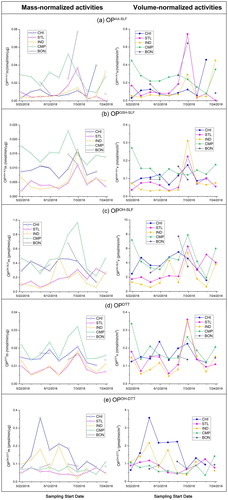
The activities for most OP endpoints (OPAA-SLF, OPGSH-SLF, OPDTT, and OPOH-SLF) were elevated in the week of July 3 at all sampling sites. This trend is more profound in OPv than in OPm, except at BON (due to lower ambient PM mass concentration there in that week; see Figure S5 in SI). This is attributed to the fireworks emissions for the Independence Day celebration on the evening of July 4. In our previous study, Puthussery et al. (Citation2018) also observed elevated OP levels of ambient PM2.5 on July 4, 2017 in Urbana, IL using a real-time OPDTT instrument. Cracking fireworks result into elevated levels of ambient Fe and Cu (Pervez et al. Citation2016), which are intrinsically ROS-active in most of these assays.
shows the comparison of average mass-normalized and volume-normalized OP activities measured in this study with several previous studies conducted in North America, Europe, China and India. OPAAv () measured in this study (0.044–0.745 nmol·min−1·m−3) is at very low end of the range (0.2–5.2 nmol·min−1·m−3) reported by Fang et al. (Citation2016) for the ambient PM2.5 samples collected from Southeast US. However, the range of our OPAA-SLFm (0.004–0.077 nmol·min−1·µg−1) measurements is closer to the range (0.0017–0.04 nmol·min−1·µg−1) reported by Szigeti et al. (Citation2016) for the urban PM2.5 samples collected from 20 European cities. The median of our OPAA-SLFm (0.012 nmol·min−1·µg−1) is also close to the average activity reported in two European studies (Künzli et al. Citation2006; Mudway et al. Citation2005). Since OPAAv in Fang et al. (Citation2016) was measured in the absence of other antioxidants (i.e., GSH, UA, and CA), the lower OPAA-SLFv in our study might be due to the interactions among these antioxidants. For example, GSH has the ability to reduce the oxidized AA (Birben et al. Citation2012), thereby slowing down the depletion rate of AA in SLF. Recently, Pietrogrande et al. (Citation2019) has also reported a significant suppressing effect by other three antioxidants (i.e., GSH, CA, and UA, up to 80% decrease depending upon the relative concentrations of these antioxidants) in SLF on the consumption rate of AA.
Table 4. Comparison of ambient PM2.5 OP obtained from SAMERA with those reported in the literatures.
Our OPGSH-SLFm () has a slightly wider range (0.001–0.040 nmol·min−1·µg−1) than the range (0–0.0275 nmol·min−1·µg−1) reported in the studies conducted so far. Note, the depletion rate of both AA and GSH reported in most studies (Godri et al. Citation2011; Künzli et al. Citation2006; Mudway et al. Citation2005; Szigeti et al. Citation2016) are calculated based on a 4-h test with the lung lining fluid (200 µM AA, 200 µM GSH and 200 µM UA), which has a different composition than the SLF used in this study (200 µM AA, 100 µM GSH, 100 µM UA and 300 µM CA). Furthermore, a photometric-based DTNB enzymatic recycling assay adapted from Baker et al. (Citation1990) was used for GSH determination in all these studies. In this assay, DTNB reacts with GSH and generates oxidized glutathione (GSSG) and TNB, while GSSG is reduced back to GSH by an additional reductant NADPH, catalyzed by glutathione reductase (GR). TNB production (i.e., absorbance at 412 nm) is measured to determine the concentration of total glutathione (GSSG and GSH) and GSSG (by first removing GSH using 2-vinylpyridine). GSH concentration is then obtained indirectly by subtracting 2 times of GSSG from total GSH (Mudway et al. Citation2001). This method has been adapted from the cell-based studies (e.g., measuring oxidative stress in human lung adenocarcinoma cells) where the concentration of initial GSH is unknown and therefore it is important to measure both reduced (GSH) and oxidized (GSSG) glutathione to assess the cellular oxidative state. In the chemical assays, where we add a known amount of GSH, measurement of GSSG is not required and OPGSH can be simply determined by measuring the oxidation rate of GSH. Nevertheless, Roušar et al. (Citation2012) compared the GSH concentration from the conventional enzymatic recycling approach versus direct determination of GSH using OPA method, and reported an excellent agreement between two methods (slope from orthogonal fit = 0.98, R2 = 0.99, N = 45 biological samples). Note, the complexity of enzymatic recycling approach does not allow measuring the kinetic properties of GSH depletion as yielded by SAMERA, which could be important to understand the reaction mechanism and the role of different chemical components in this OP endpoint.
In contrast to OPAA and OPGSH, fewer studies have used OPOH-SLF endpoint. Similar to OPGSH-SLF, shows a wider range of OPOH-SLF in our analysis compared to two studies (Ma et al. Citation2015; Vidrio et al. Citation2009) using the same SLF protocol. Note, due to the lack of kinetic profile, •OH generation rates from these two studies were calculated assuming a linear pattern of •OH production within 24 h, which could lead to erroneous estimates. Therefore, caution needs to be exercised in comparing these results. Moreover, the samples used in those two studies were collected from a single site (i.e., Davis, CA for Vidrio et al. [Citation2009] and Guangzhou, China for Ma et al. [Citation2015]), in contrast to our samples, which were collected from five different sites, probably resulting into a wider range of OP activities in our study.
As the most commonly used endpoint, OPDTT has the largest database in existing literature. Both mass-normalized and volume-normalized DTT activities measured in this study are in good agreement with those from many previous studies listed in i.e., within the typical range: 0.005–0.2 nmol·min−1·µg−1 for OPDTTm and 0.1–0.5 nmol·min−1·m−3 for OPDTTv). In contrast, OPOH-DTT is a newer endpoint which was first introduced in our previous study (Xiong et al. Citation2017). The activity of OPOH-DTT measured in this study is significantly higher than our previous studies [i.e., Xiong et al. [Citation2017] and Yu et al. [Citation2018] []) reporting this endpoint. This is again attributed to a diversity of the sites we have in the current study in contrast to only two sites, which were both in Champaign (IL) in those studies. Interestingly, the range of OPOH-DTTv at CMP in this study (0.4–1.4 pmol·min−1·m−3; ) is close to that reported in our previous study Yu et al. (Citation2018) (0.2–1.1 pmol·min−1·m−3), indicating the consistency of our automated protocol. Further investigation of PM chemical composition (currently underway), will help in revealing the complex patterns of these OP endpoints among different sites.
4. Conclusions
SAMERA is designed for an automated analysis of five OP endpoints – OPAA-SLF, OPGSH-SLF, OPOH-SLF, OPDTT and OPOH-DTT on ambient PM aqueous extracts. Both spectrophotometric- and spectrofluorometric-based approaches were adopted to obtain a simultaneous measurement of multiple endpoints. The system analyzes all five OP endpoints for a given sample within 3 h. The precision tests on SAMERA demonstrated a high reproducibility for both positive controls and ambient PM2.5 samples. The measurements obtained from SAMERA are also highly accurate as they were validated against the results from manual operation using the same experimental protocol. We recommend a liquid concentration of ambient PM2.5 extracts in the reaction mixture as 50 µg/mL for the SLF-based assays, and 30 µg/mL for DTT-based assays.
Overall, SAMERA provides the first rapid and high-throughput analysis protocol for multiple endpoints of OP. It substantially reduces the time and labor required to conduct various OP assays on the ambient PM samples, which will facilitate integrating the OP dataset into epidemiological models in future studies. Furthermore, SAMERA can yield the kinetic properties for antioxidant (e.g., GSH) consumption and ROS generation (e.g., •OH generation in SLF), which have not been typically obtained in previous studies due to labor-intensive protocols of these endpoints. The study also explored the feasibility of employing SAMERA for analyzing a large set of ambient PM2.5 samples currently being collected from the Midwest US. Preliminary results show that the range of OP activities obtained from SAMERA is broader than those reported in previous studies, which is probably due to the diversity in chemical composition of the ambient samples collected from five different sampling sites in our study. The activities for most OP endpoints were significantly elevated in the week of July 4 at all the sites, indicating a substantial impact of fireworks emissions from Independence Day celebration on ambient PM2.5 OP. Further analysis of OP on the remaining samples along with a detailed chemical speciation, which is currently underway, will yield insights on the chemical components and their emission sources contributing to different mechanisms of ROS generation induced by ambient PM2.5 in the Midwest US.
Supplemental Material
Download PDF (586.8 KB)Additional information
Funding
Related Research Data
References
- Abrams, J. Y., R. J. Weber, M. Klein, S. E. Samat, H. H. Chang, M. J. Strickland, V. Verma, T. Fang, J. T. Bates, J. A. Mulholland, A. G. Russell, and P. E. Tolbert. 2017. Associations between ambient fine particulate oxidative potential and cardiorespiratory emergency department visits. Environ. Health Perspect. 125 (10):107008. doi:10.1289/EHP1545.
- Alfadda, A. A., and R. M. Sallam. 2012. Reactive oxygen species in health and disease. BioMed Res. Int. 2012:1–14. doi:10.1155/2012/936486.
- Antiñolo, M., M. D. Willis, S. Zhou, and J. P. Abbatt. 2015. Connecting the oxidation of soot to its redox cycling abilities. Nature Commun. 6 (1):66812. doi:10.1038/ncomms7812.
- Araujo, J. A., and A. E. Nel. 2009. Particulate matter and atherosclerosis: role of particle size, composition and oxidative stress. Particle Fibre Toxicol. 6 (1):24. doi:10.1186/1743-8977-6-24.
- Ayres, J. G., P. Borm, F. R. Cassee, V. Castranova, K. Donaldson, A. Ghio, R. M. Harrison, R. Hider, F. Kelly, I. M. Kooter, et al. 2008. Evaluating the toxicity of airborne particulate matter and nanoparticles by measuring oxidative stress potential—a workshop report and consensus statement. Inhal. Toxicol. 20 (1):75–99. doi:10.1080/08958370701665517.
- Böhmer, A., J. Jordan, and D. Tsikas. 2011. High-performance liquid chromatography ultraviolet assay for human erythrocytic catalase activity by measuring glutathione as o-phthalaldehyde derivative. Anal. Biochem. 410 (2):296–303. doi:10.1016/j.ab.2010.11.026.
- Baker, M. A., G. J. Cerniglia, and A. Zaman. 1990. Microtiter plate assay for the measurement of glutathione and glutathione disulfide in large numbers of biological samples. Anal. Biochem. 190 (2):360–365. doi:10.1016/0003-2697(90)90208-Q.
- Bates, J. T., R. J. Weber, J. Abrams, V. Verma, T. Fang, M. Klein, M. J. Strickland, S. E. Sarnat, H. H. Chang, and J. A. Mulholland. 2015. Reactive oxygen species generation linked to sources of atmospheric particulate matter and cardiorespiratory effects. Environmental Sci. Technol. 49 (22):13605–13612. doi:10.1021/acs.est.5b02967.
- Becker, S., L. A. Dailey, J. M. Soukup, S. C. Grambow, R. B. Devlin, and Y.-C. T. Huang. 2005. Seasonal variations in air pollution particle-induced inflammatory mediator release and oxidative stress. Environ. Health Perspect. 113 (8):1032–1038. doi:10.1289/ehp.7996.
- Birben, E., U. M. Sahiner, C. Sackesen, S. Erzurum, and O. Kalayci. 2012. Oxidative stress and antioxidant defense. World Allergy Org. J. 5 (1):9. doi:10.1097/WOX.0b013e3182439613.
- Bonomini, F., S. Tengattini, A. Fabiano, R. Bianchi, and R. Rezzani. 2008. Atherosclerosis and oxidative stress. Histol. Histopathol. 23 (3):381–390. doi:10.14670/HH-23.381.
- Charrier, J., and C. Anastasio. 2012. On dithiothreitol (DTT) as a measure of oxidative potential for ambient particles: evidence for the importance of soluble transition metals. Atmos. Chem. Phys. 12 (19):9321. doi:10.5194/acp-12-9321-2012.
- Charrier, J. G., and C. Anastasio. 2015. Rates of hydroxyl radical production from transition metals and quinones in a surrogate lung fluid. Environ. Sci. Technol. 49 (15):9317–9325. doi:10.1021/acs.est.5b01606.
- Charrier, J. G., A. S. McFall, N. K. Richards-Henderson, and C. Anastasio. 2014. Hydrogen peroxide formation in a surrogate lung fluid by transition metals and quinones present in particulate matter. Environ. Sci. Technol. 48 (12):7010–7017. doi:10.1021/es501011w.
- Charrier, J., N. Richards-Henderson, K. Bein, A. McFall, A. Wexler, and C. Anastasio. 2015. Oxidant production from source-oriented particulate matter–Part 1: oxidative potential using the dithiothreitol (DTT) assay. Atmos. Chem. Phys. (15):2327–2340. doi:10.5194/acp-15-2327-2015.
- Charrier, J. G., A. S. McFall, K. K. Vu, J. Baroi, C. Olea, A. Hasson, and C. Anastasio. 2016. A bias in the “mass-normalized” DTT response–an effect of non-linear concentration-response curves for copper and manganese. Atmos. Environ. 144:325–334. doi:10.1016/j.atmosenv.2016.08.071.
- Cho, A. K., C. Sioutas, A. H. Miguel, Y. Kumagai, D. A. Schmitz, M. Singh, A. Eiguren-Fernandez, and J. R. Froines. 2005. Redox activity of airborne particulate matter at different sites in the Los Angeles Basin. Environ. Res. 99 (1):40–47. doi:10.1016/j.envres.2005.01.003.
- Chuang, K.-J., C.-C. Chan, T.-C. Su, C.-T. Lee, and C.-S. Tang. 2007. The effect of urban air pollution on inflammation, oxidative stress, coagulation, and autonomic dysfunction in young adults. Am. J. Resp. Crit. Care Med. 176 (4):370–376. doi:10.1164/rccm.200611-1627OC.
- Cohen, A. J., M. Brauer, R. Burnett, H. R. Anderson, J. Frostad, K. Estep, K. Balakrishnan, B. Brunekreef, L. Dandona, R. Dandona, et al. 2017. Estimates and 25-year trends of the global burden of disease attributable to ambient air pollution: an analysis of data from the global burden of diseases study 2015. Lancet 389 (10082):1907–1918. doi:10.1016/S0140-6736(17)30505-6.
- Crobeddu, B., L. Aragao-Santiago, L.-C. Bui, S. Boland, and A. B. Squiban. 2017. Oxidative potential of particulate matter 2.5 as predictive indicator of cellular stress. Environ. Pollut. 230:125–133. doi:10.1016/j.envpol.2017.06.051.
- D'Autréaux, B., and M. B. Toledano. 2007. ROS as signalling molecules: mechanisms that generate specificity in ROS homeostasis. Nat. Rev. Mol. Cell Biol. 8 (10):813. doi:10.1038/nrm2256.
- Delfino, R. J., N. Staimer, T. Tjoa, D. L. Gillen, J. J. Schauer, and M. M. Shafer. 2013. Airway inflammation and oxidative potential of air pollutant particles in a pediatric asthma panel. J. Exposure Sci. Environ. Epidemiol. 23 (5):466–473. doi:10.1038/jes.2013.25.
- Fang, T., V. Verma, J. T. Bates, J. Abrams, M. Klein, M. J. Strickland, S. E. Sarnat, H. H. Chang, J. A. Mulholland, P. E. Tolbert, et al. 2016. Oxidative potential of ambient water-soluble PM 2.5 in the southeastern United States: contrasts in sources and health associations between ascorbic acid (AA) and dithiothreitol (DTT) assays. Atmos. Chem. Phys. 16 (6):3865–3879. doi:10.5194/acp-16-3865-2016.
- Fang, T., V. Verma, H. Guo, L. King, E. Edgerton, and R. Weber. 2014. A semi-automated system for quantifying the oxidative potential of ambient particles in aqueous extracts using the dithiothreitol (DTT) assay: results from the Southeastern Center for Air Pollution and Epidemiology (SCAPE). Atmos. Meas. Tech. Discussions 7 (7):7245. doi:10.5194/amt-8-471-2015.
- Feng, S., D. Gao, F. Liao, F. Zhou, and X. Wang. 2016. The health effects of ambient PM2.5 and potential mechanisms. Ecotoxicol. Environ. Safety 128 :67–74. doi:10.1016/j.ecoenv.2016.01.030.
- Godri, K. J., R. M. Harrison, T. Evans, T. Baker, C. Dunster, I. S. Mudway, and F. J. Kelly. 2011. Increased oxidative burden associated with traffic component of ambient particulate matter at roadside and urban background schools sites in London. PLoS One 6 (7):e21961. doi:10.1371/journal.pone.0021961.
- Held, K. D., F. C. Sylvester, K. L. Hopcia, and J. E. Biaglow. 1996. Role of Fenton chemistry in thiol-induced toxicity and apoptosis. Radiation Res. 145 (5):542–553. doi:10.2307/3579272.
- Hu, S., A. Polidori, M. Arhami, M. Shafer, J. Schauer, A. Cho, and C. Sioutas. 2008. Redox activity and chemical speciation of size fractioned PM in the communities of the Los Angeles-Long Beach harbor. Atmos. Chem. Phys. 8 (21):6439–6451. doi:10.5194/acp-8-6439-2008.
- Hulskotte, J., H. Denier van der Gon, A. Visschedijk, and M. Schaap. 2007. Brake wear from vehicles as an important source of diffuse copper pollution. Water Sci. Technol. 56 (1):223–231. doi:10.2166/wst.2007.456.
- Janssen, N. A., M. Strak, A. Yang, B. Hellack, F. J. Kelly, T. A. Kuhlbusch, R. M. Harrison, B. Brunekreef, F. R. Cassee, and M. Steenhof. 2015. Associations between three specific a-cellular measures of the oxidative potential of particulate matter and markers of acute airway and nasal inflammation in healthy volunteers. Occupational Environ. Med. 72 (1):49–56. doi:10.1136/oemed-2014-102303.
- Janssen, N. A. H., A. Yang, M. Strak, M. Steenhof, B. Hellack, M. E. Gerlofs-Nijland, T. Kuhlbusch, F. Kelly, R. Harrison, B. Brunekreef, et al. 2014. Oxidative potential of particulate matter collected at sites with different source characteristics. Sci. Total Environ. 472 :572–581. doi:10.1016/j.scitotenv.2013.11.099.
- Künzli, N., I. S. Mudway, T. Götschi, T. Shi, F. J. Kelly, S. Cook, P. Burney, B. Forsberg, J. W. Gauderman, M. E. Hazenkamp, et al. 2006. Comparison of oxidative properties, light absorbance, and total and elemental mass concentration of ambient PM2. 5 collected at 20 European sites. Environ. Health Perspect. 114 (5):684–690. doi:10.1289/ehp.8584.
- Kampa, M., and E. Castanas. 2008. Human health effects of air pollution. Environ. Pollut. 151 (2):362–367. doi:10.1016/j.envpol.2007.06.012.
- Knaapen, A. M., P. J. Borm, C. Albrecht, and R. P. Schins. 2004. Inhaled particles and lung cancer. Part A: Mechanisms. Int. J. Cancer 109 (6):799–809. doi:10.1002/ijc.11708.
- Kodavanti, U. P., M. C. Schladweiler, A. D. Ledbetter, W. P. Watkinson, M. J. Campen, D. W. Winsett, J. R. Richards, K. M. Crissman, G. E. Hatch, and D. L. Costa. 2000. The spontaneously hypertensive rat as a model of human cardiovascular disease: evidence of exacerbated cardiopulmonary injury and oxidative stress from inhaled emission particulate matter. Toxicol. Appl. Pharmacol. 164 (3):250–263. doi:10.1006/taap.2000.8899.
- Li, N., C. Sioutas, A. Cho, D. Schmitz, C. Misra, J. Sempf, M. Wang, T. Oberley, J. Froines, and A. Nel. 2003. Ultrafine particulate pollutants induce oxidative stress and mitochondrial damage. Environ. Health Perspect. 111 (4):455. doi:10.1289/ehp.6000.
- Li, N., T. Xia, and A. E. Nel. 2008. The role of oxidative stress in ambient particulate matter-induced lung diseases and its implications in the toxicity of engineered nanoparticles. Free Radical Biol. Med. 44 (9):1689–1699. doi:10.1016/j.freeradbiomed.2008.01.028.
- Longhin, E., J. A. Holme, K. B. Gutzkow, V. M. Arlt, J. E. Kucab, M. Camatini, and M. Gualtieri. 2013. Cell cycle alterations induced by urban PM2. 5 in bronchial epithelial cells: characterization of the process and possible mechanisms involved. Particle Fibre Toxicol. 10 (1):63. doi:10.1186/1743-8977-10-63.
- Ma, S., K. Ren, X. Liu, L. Chen, M. Li, X. Li, J. Yang, B. Huang, M. Zheng, and Z. Xu. 2015. Production of hydroxyl radicals from Fe-containing fine particles in Guangzhou, China. Atmos. Environ. 123:72–78. doi:10.1016/j.atmosenv.2015.10.057.
- Maikawa, C. L., S. Weichenthal, A. J. Wheeler, N. A. Dobbin, A. Smargiassi, G. Evans, L. Liu, M. S. Goldberg, and K. J. G. Pollitt. 2016. Particulate oxidative burden as a predictor of exhaled nitric oxide in children with asthma. Environ. Health Perspect. 124 (10):1616. doi:10.1289/EHP175.
- Mudway, I. S., S. T. Duggan, C. Venkataraman, G. Habib, F. J. Kelly, and J. Grigg. 2005. Combustion of dried animal dung as biofuel results in the generation of highly redox active fine particulates. Particle Fibre Toxicol. 2 (1):6. doi:10.1186/1743-8977-2-6.
- Mudway, I. S., N. Stenfors, A. Blomberg, R. Helleday, C. Dunster, S. Marklund, A. J. Frew, T. Sandström, and F. J. Kelly. 2001. Differences in basal airway antioxidant concentrations are not predictive of individual responsiveness to ozone: a comparison of healthy and mild asthmatic subjects. Free Radical Biol. Med. 31 (8):962–974. doi:10.1016/S0891-5849(01)00671-2.
- Oh, S. M., H. R. Kim, Y. J. Park, S. Y. Lee, and K. H. Chung. 2011. Organic extracts of urban air pollution particulate matter (PM2. 5)-induced genotoxicity and oxidative stress in human lung bronchial epithelial cells (BEAS-2B cells). Mutation Res./Genetic Toxicol. Environ. Mutagenesis 723 (2):142–151. doi:10.1016/j.mrgentox.2011.04.003.
- Pervez, S., R. K. Chakrabarty, S. Dewangan, J. G. Watson, J. C. Chow, and J. L. Matawle. 2016. Chemical speciation of aerosols and air quality degradation during the festival of lights (Diwali). Atmos.c Pollution Res. 7 (1):92–99. doi:10.1016/j.apr.2015.09.002.
- Pham-Huy, L. A. H., He, and C. Pham-Huy. 2008. Free radicals, antioxidants in disease and health. Int. J. Biomed. Sci. 4 (2):89.
- Pietrogrande, M. C., I. Bertoli, F. Manarini, and M. Russo. 2019. Ascorbate assay as a measure of oxidative potential for ambient particles: Evidence for the importance of cell-free surrogate lung fluid composition. Atmos. Environ. 211 (2019):103–112. doi:10.1016/j.atmosenv.2019.05.012.
- Puthussery, J. V. C., Zhang, and V. Verma. 2018. Development and field testing of an online instrument for measuring the real-time oxidative potential of ambient particulate matter based on dithiothreitol assay. Atmos. Meas. Tech. 11 (10):5767–5780. doi:10.5194/amt-11-5767-2018.
- Rahman, T., I. Hosen, M. T. Islam, and H. U. Shekhar. 2012. Oxidative stress and human health. Adv. Biosci. Biotechnol. 3 (7):997. doi:10.4236/abb.2012.327123.
- Roušar, T., O. Kučera, H. Lotková, and Z. Červinková. 2012. Assessment of reduced glutathione: comparison of an optimized fluorometric assay with enzymatic recycling method. Anal. Biochem. 423 (2):236–240. doi:10.1016/j.ab.2012.01.030.
- Saffari, A., N. Daher, M. M. Shafer, J. J. Schauer, and C. Sioutas. 2014. Seasonal and spatial variation in dithiothreitol (DTT) activity of quasi-ultrafine particles in the Los Angeles Basin and its association with chemical species. J. Environ. Sci. Health, Part A 49 (4):441–451. doi:10.1080/10934529.2014.854677.
- Sarnat, S. E., H. H. Chang, and R. J. Weber. 2016. Ambient PM2. 5 and health: does PM2. 5 oxidative potential play a role? Am. J. Respir. Crit. Care Med. (194):530–531. doi:10.1164/rccm.201603-0589ED.
- Sauvain, J.-J., S. Deslarzes, F. Storti, and M. Riediker. 2015. Oxidative potential of particles in different occupational environments: a pilot study. Ann. Occupational Hygiene 59 (7):882–894. doi:10.1093/annhyg/mev024.
- Shen, H. A., Barakat, and C. Anastasio. 2011. Generation of hydrogen peroxide from San Joaquin Valley particles in a cell-free solution. Atmos. Chem. Phys. 11 (2):753–765. doi:10.5194/acp-11-753-2011.
- Son, Y., V. Mishin, W. Welsh, S.-E. Lu, J. D. Laskin, H. Kipen, and Q. Meng. 2015. A novel high-throughput approach to measure hydroxyl radicals induced by airborne particulate matter. Int. J. Environ. Res. Public Health 12 (11):13678–13695. doi:10.3390/ijerph121113678.
- Sun, Q., A. Wang, X. Jin, A. Natanzon, D. Duquaine, R. D. Brook, J.-G. S. Aguinaldo, Z. A. Fayad, V. Fuster, and M. Lippmann. 2005. Long-term air pollution exposure and acceleration of atherosclerosis and vascular inflammation in an animal model. JAMA 294 (23):3003–3010. doi:10.1001/jama.294.23.3003.
- Szigeti, T., C. Dunster, A. Cattaneo, D. Cavallo, A. Spinazzè, D. E. Saraga, I. A. Sakellaris, Y. de Kluizenaar, E. J. Cornelissen, and O. Hänninen. 2016. Oxidative potential and chemical composition of PM2.5 in office buildings across Europe–the OFFICAIR study. Environ. Int. 92:324–333. doi:10.1016/j.envint.2016.04.015.
- Torres-Ramos, Y. D., A. Montoya-Estrada, A. M. Guzman-Grenfell, J. Mancilla-Ramirez, B. Cardenas-Gonzalez, S. Blanco-Jimenez, J. D. Sepulveda-Sanchez, A. Ramirez-Venegas, and J. J. Hicks. 2011. Urban PM2.5 induces ROS generation and RBC damage in COPD patients. Frontiers Biosci. (Elite Edition) 3 E (3):808–817. doi:10.2741/e288.
- Verma, V., T. Fang, H. Guo, L. King, J. Bates, R. Peltier, E. Edgerton, A. Russell, and R. Weber. 2014. Reactive oxygen species associated with water-soluble PM 2.5 in the southeastern United States: spatiotemporal trends and source apportionment. Atmos. Chem. Phys. (14):12915–12930. doi:10.5194/acp-14-12915-2014.
- Verma, V., T. Fang, L. Xu, R. E. Peltier, A. G. Russell, N. L. Ng, and R. J. Weber. 2015a. Organic aerosols associated with the generation of reactive oxygen species (ROS) by water-soluble PM2. 5. Environ. Sci. Technol. 49 (7):4646–4656. doi:10.1021/es505577w.
- Verma, V., Z. Ning, A. K. Cho, J. J. Schauer, M. M. Shafer, and C. Sioutas. 2009. Redox activity of urban quasi-ultrafine particles from primary and secondary sources. Atmos. Environ. 43 (40):6360–6368. doi:10.1016/j.atmosenv.2009.09.019.
- Verma, V., R. Rico-Martinez, N. Kotra, L. King, J. Liu, T. W. Snell, and R. J. Weber. 2012. Contribution of water-soluble and insoluble components and their hydrophobic/hydrophilic subfractions to the reactive oxygen species-generating potential of fine ambient aerosols. Environ. Sci. Technol. 46 (20):11384–11392. doi:10.1021/es302484r.
- Verma, V., Y. Wang, R. El-Afifi, T. Fang, J. Rowland, A. G. Russell, and R. J. Weber. 2015b. Fractionating ambient humic-like substances (HULIS) for their reactive oxygen species activity–assessing the importance of quinones and atmospheric aging. Atmos. Environ. 120:351–359. doi:10.1016/j.atmosenv.2015.09.010.
- Vidrio, E., H. Jung, and C. Anastasio. 2008. Generation of hydroxyl radicals from dissolved transition metals in surrogate lung fluid solutions. Atmos. Environ. 42 (18):4369–4379. doi:10.1016/j.atmosenv.2008.01.004.
- Vidrio, E., C. H. Phuah, A. M. Dillner, and C. Anastasio. 2009. Generation of hydroxyl radicals from ambient fine particles in a surrogate lung fluid solution. Environ. Sci. Technol. 43 (3):922–927. doi:10.1021/es801653u.
- Visentin, M., A. Pagnoni, E. Sarti, and M. C. Pietrogrande. 2016. Urban PM2. 5 oxidative potential: Importance of chemical species and comparison of two spectrophotometric cell-free assays. Environ. Pollut. 219:72–79. doi:10.1016/j.envpol.2016.09.047.
- Wang, Y., M. J. Plewa, U. K. Mukherjee, and V. Verma. 2018. Assessing the cytotoxicity of ambient particulate matter (PM) using Chinese hamster ovary (CHO) cells and its relationship with the PM chemical composition and oxidative potential. Atmos. Environ. 179:132–141. doi:10.1016/j.atmosenv.2018.02.025.
- Weichenthal, S., E. Lavigne, G. Evans, K. Pollitt, and R. T. Burnett. 2016. Ambient PM2.5 and risk of emergency room visits for myocardial infarction: impact of regional PM2.5 oxidative potential: a case-crossover study. Environ. Health 15 (1):46. doi:10.1186/s12940-016-0129-9.
- West, J. J., A. Cohen, F. Dentener, B. Brunekreef, T. Zhu, B. Armstrong, M. L. Bell, M. Brauer, G. Carmichael, and D. L. Costa. 2016. What we breathe impacts our health: improving understanding of the link between air pollution and health. Environ. Sci. Technol. 50 (10):4895–4904. doi:10.1021/acs.est.5b03827.
- Xiong, Q., H. Yu, R. Wang, J. Wei, and V. Verma. 2017. Rethinking the dithiothreitol (DTT) based PM oxidative potential: Measuring DTT consumption versus ROS generation. Environ. Sci. Technol. 51 (11):6507–6514. doi:10.1021/acs.est.7b01272.
- Yan, Z., J. Wang, J. Li, N. Jiang, R. Zhang, W. Yang, W. Yao, and W. Wu. 2016. Oxidative stress and endocytosis are involved in upregulation of interleukin‐8 expression in airway cells exposed to PM 2.5. Environ. Toxicol. 31 (12):1869–1878. doi:10.1002/tox.22188.
- Yang, A., N. A. Janssen, B. Brunekreef, F. R. Cassee, G. Hoek, and U. Gehring. 2016. Children's respiratory health and oxidative potential of PM2.5: the PIAMA birth cohort study. Occupational Environ. Med. 73 (3):154–160. doi:10.1136/oemed-2015-103175.
- Yu, H., J. Wei, Y. Cheng, K. Subedi, and V. Verma. 2018. Synergistic and antagonistic interactions among the particulate matter components in generating reactive oxygen species based on the dithiothreitol assay. Environ. Sci. Technol. 52 (4):2261–2270. doi:10.1021/acs.est.7b04261.
- Zhang, X., N. Staimer, D. L. Gillen, T. Tjoa, J. J. Schauer, M. M. Shafer, S. Hasheminassab, P. Pakbin, N. D. Vaziri, C. Sioutas, and R. J. Delfino. 2016. Associations of oxidative stress and inflammatory biomarkers with chemically-characterized air pollutant exposures in an elderly cohort. Environ. Res. 150:306–319. doi:10.1016/j.envres.2016.06.019.