
 ?Mathematical formulae have been encoded as MathML and are displayed in this HTML version using MathJax in order to improve their display. Uncheck the box to turn MathJax off. This feature requires Javascript. Click on a formula to zoom.
Abstract
Fat content on upper airway soft tissue can alter the geometry of the human pharynx, most notably by narrowing the upper airway at the level of the epiglottis. Despite the important role of the epiglottis during respiration, there is a paucity of data on how its geometry can affect airway flow dynamics in an individual. This study shows how the narrowing of the human pharynx from lingual fats can potentially change airway flow dynamics and particle deposition. The velocity flow field in four geometrically realistic upper airway models representing a pharynx with different amounts of lingual fat was simulated using computational fluid dynamics (CFD) with the baseline case validated using particle image velocimetry (PIV). The deposition of particles was also computed using a standard discrete phase model (DPM) with results showing how particle deposition is affected by the narrowing of the pharynx.
Copyright © 2019 American Association for Aerosol Research
Introduction
Understanding airflow dynamics in the human upper airway is central to improving knowledge on issues such as pollutant related epidemiology (Martinez et al. Citation2018) and the design of inhaled drug delivery systems (Kourmatzis, Cheng, and Chan Citation2018). Detailed knowledge of airflow dynamics in the pharynx is not only critical to describe particle deposition in the upper and lower airways accurately, but is also necessary to elucidate the mechanisms that underpin respiratory diseases such as sleep apnea.
Although research has shed light on the potential effects of intrasubject variabilities in upper airway geometry on airflow dynamics and deposition (Nicolaou and Zaki Citation2013; Grgic, Finlay, Burnell, et al. Citation2004; Heenan et al. Citation2004), how specific pharyngeal anatomy affects particle transport and deposition in the human airways is still poorly understood. For example, the cross-sectional area of the upper airway in humans can be significantly affected by BMI (Brown et al. Citation2015; Cheng et al. Citation2011; Cheng, Brown, et al. Citation2014), and this is commonly related to the increase in fat deposits (Badr Citation2014; Kim et al. Citation2014; Sutherland et al. Citation2011) in soft tissues surrounding the pharynx. Indeed, the tongue is a complex muscle that forms a major section of the human pharynx and fat deposits can increase tongue volume and narrow the extrathoracic airway at the level of the epiglottis and base of the tongue (Azarbarzin et al. Citation2017). The increase in tongue volume at the tongue base in apneic patients compared to healthy controls further supports this theory, since obstructive sleep apnea is a disease that is related to a narrow, crowded, and collapsible upper airway.
The epiglottis, forming part of the upper airway, is a piece of elastic cartilage that has a leaf-like structure which projects obliquely cranially behind the tongue. This part of the airway can interfere with breathing, and studies using magnetic resonance imaging (MRI) have demonstrated that in some healthy human subjects, the tongue contracts to increase the upper airway space at the level of the epiglottis to improve or enable flow (Cheng, Brown, et al. Citation2014). Given the unique geometry of the epiglottis and that the pharynx tends to be the narrowest at this section of the upper airway, flow at the epiglottis is complex, but the implications of this on particle deposition remain poorly understood.
The primary aim of this study is to understand the effects of airway narrowing (from an increase in tongue size) on airflow dynamics at the epiglottis during nasal-only and oral-only inhalation, with the goal being to inform how change in BMI in a subject-specific individual may potentially affect airflow dynamics at the level of epiglottis in the human upper airway. The second aim of this study is to demonstrate flow features and particle deposition during oral-only inhalation, as a function of pharynx narrowing, presented as a reduction of cross-sectional area at the epiglottis.
Methods
Three-dimensional upper airway model
A three-dimensional model of the upper airway that consists of both the nasal and oral cavity was reconstructed using 3 D slicer, and the images were examined to ensure that there were sufficient details of the epiglottis and uvula. A voxel size of 0.25 mm cube was used to form an image stack with dimensions of 276 voxels by 448 voxels by 468 voxels. To create models with different epiglottis distance, the boundaries of the airway at the level of the epiglottis were carefully altered on 3 D slicer and on multiple images to ensure minimal effects on the geometry of the surrounding regions. Four different models, including the base model were developed, and all the three-dimensional models were overlaid to visually inspect that only the pharynx geometry at the epiglottis level was altered. The airway dimensions at the epiglottis level (antero-posterior dimension measured in the sagittal plane between the epiglottis tip and back pharyngeal wall) created in the four models are 3,4,5 and 6 mm. The upper airway model used for the numerical simulations included both the nasal cavity and oropharyngeal portion of the airway.
Numerical method and test cases studied
The meshing of the computational models and simulations were performed using the finite-volume method with the commercial CFD package ANSYS FLUENT 18.2. Steady flow fields were analyzed using an incompressible laminar model for low flow rate cases (5LPM) and a realizable k-omega model for high flow rate (20LPM) simulations. In addition to the nasal-only inhalation condition, oral-only inhalation was also modeled to investigate how this may affect the flow field in the extrathoracic airway. For both inhalations, the inlet flow-rates were kept constant resulting in Reynolds numbers of 642 and 2567 for the nasal only 5 L/min and 20 L/min flow rates respectively and Reynolds numbers of 428 and 1712 for the 5 L/min and 20 L/min oral only cases respectively.
The steady-state equations for the conservation of mass and momentum are:
(1)
(1)
(2)
(2)
where
is the velocity component, xi is spatial location,
the pressure,
the density and
the kinematic viscosity. A second-order spatial Discretization scheme was used for pressure and momentum. The SIMPLEC algorithm was employed for pressure velocity coupling and the steady-state convergence criterion of each variable was 1 × 10⁻⁵ (Li et al. Citation2017). The inlet velocity boundary condition and outflow conditions with standard atmospheric pressure (1 atm) were employed in all simulations. To investigate the effects of high flow rate (20 L/min), a turbulent intensity of 5% and turbulent viscosity ratio of 10 were prescribed for the inlet boundaries of the models (Tu, Inthavong, and Ahmadi Citation2013).
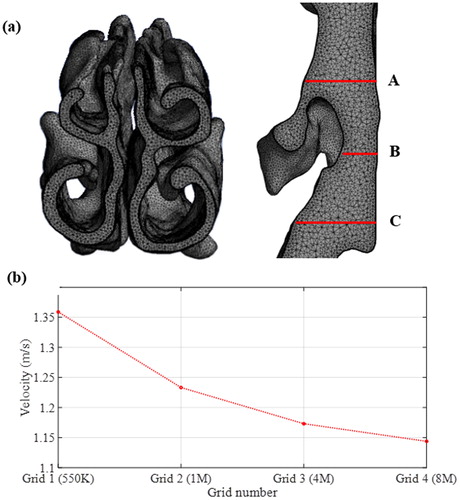
The computational mesh for the models (shown in the Appendix) was generated such that there were at least five-layers of prism mesh at the model boundaries. A minimum cell length of 0.2 mm was generated at the surface of the models to capture high gradients of the velocity near walls with the first layer mesh height of 30 µm. The initial mesh was refined by both gradient and boundary adaptation until grid independence of the solutions was achieved. The figure in the Appendix shows the steady-state velocity of a monitoring point located at the center of the epiglottis region obtained using four grid resolutions –550 K, 1 M, 4 M, and 8 M cells in the base model (pharynx antero-posterior dimension is 6 mm). The results in the Appendix show that the 4 M resolution is suitable, and it was therefore used for the simulations.
Particle deposition simulation using DPM for the base model and oral inhalation
It is widely known from previous studies (Chen et al. Citation2012; Li et al. Citation2003) that deposition is correlated with the Stokes number, Stk. Stk can be determined as the ratio of the particle relaxation time, τp (an estimation of the response time of a particle to a flow disturbance), to a time characteristic of the flow, τf
where ρp (
) is the particle density, dp (m) the particle diameter, μg the gas dynamic viscosity, and D and U the characteristic length and velocity scales respectively. For situations where Stk ⪡ 1, i.e., τp ⪡ τf, particles will tend to follow the flow with less deposition, whereas for Stk ⪢ 1, i.e., τp ⪢ τf, higher deposition of injected particles along the airway is expected due to their inertia.
In this study, we tracked monodisperse particles of size 1, 5 and 10 microns, which all had Stokes numbers ≪ 1 (e.g., a 10micron particle corresponds to Stk∼0.01). The velocity and length-scales were calculated using the inlet mean velocity and inlet mean length-scale (lumen diameter) respectively. Particle simulations were conducted using the Discrete Phase Model (DPM) using both laminar and turbulent flow rates (5 L/min, 20 L/min). The density of the particles was 1000 and 4,000 particles were uniformly injected through the oral inlet surface. Simulations were run with 1000, 2000, and 4000 particles injected at the surface, and convergence was achieved, with the distribution of deposition fraction across the airway changing by less than 5% when increasing from 2000 to 4000 particles. Initial particle velocities were identical to the ambient airflow (no slip velocity between the dispersed and carrier phase). The deposited particle number was measured along the length of the upper airway and the results were analyzed as a function of airway geometry with different airway dimensions at the epiglottis level and for the two different flowrates.
Validation of velocity field at epiglottis in the base model using particle image velocimetry (PIV)
shows the experimental setup and the upper airway replica (manufactured using silicone) used to acquire the PIV measurements. The setup consists of the replica submerged in a 200 mm × 350 mm × 100 mm sized glass tank, a pump controlled by a linear actuator system, a PCO camera with a spatial resolution of 1600 pixel × 1200 pixel and a double-pulse Nd: YAG laser (EverGreen 200). The glass tank was filled with a glycerol-water mixture (56:44) to match the refractive index of the silicone upper airway replica, and a grid test was performed to ensure that there was no image distortion. The ILA GmbH software was used for image processing. The silicone upper airway replica used for PIV did not include the nasal cavity region, and therefore comparisons made between PIV and numerical model were restricted to flows through the oral inlet only.
Figure 1. (a) Anatomical landmarks of the upper airway and region of interest (rectangular inset represented by red dotted lines), (b) experimental setup, and (c) the upper airway replica.
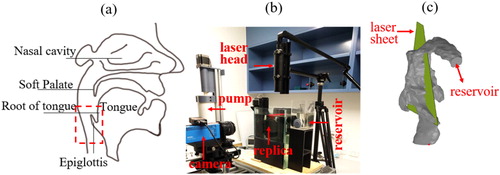
The camera was positioned at 290 mm away from the laser sheet located at the mid-sagittal plane of the upper airway replica. The field of view (FOV) was 70 mm × 52.5 mm, and it was positioned in the epiglottal region, as indicated in . The glycerol-water mixture was seeded with 20 μm polyamide particles and a density of 5 ∼ 10 particles per interrogation window were achieved in the measurements. The fluid flow rate was maintained at 3.70 LPM (equivalent to air flowrate of 5 L/min). Imaging was employed using a dual frame mode, and the imaging frequency was 3 Hz. Digital cross-correlation was used during image processing to determine the displacement of particles, and a single-pass cross-correlation with a constant interrogation window size of 32 pixels × 32 pixels with zero overlap was adopted.
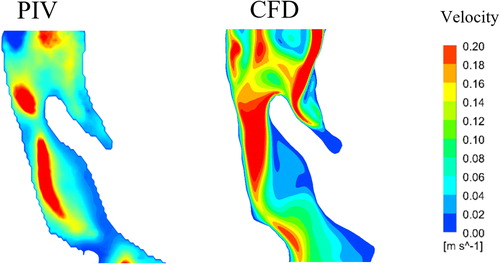
shows that the velocity field in the CFD simulation corresponds well with the results obtained from the PIV experiments, and this, therefore, validates the quality of the laminar simulation and its ability to reproduce the overall flow-field structure. Results from the computational modeling and PIV experiments show that the maximum velocity distribution is skewed towards the posterior wall of the pharynx, and there is near-zero velocity at the back of the tongue and caudal to the epiglottis. While there are some minor dissimilarities in isolated areas, the key region of interest in this contribution is past the epiglottis, where the flow becomes progressively simpler.
Figure 2. Velocity field reconstructed from PIV measurements and simulated using CFD in base model at the region of interest (see .
Results
Velocity field
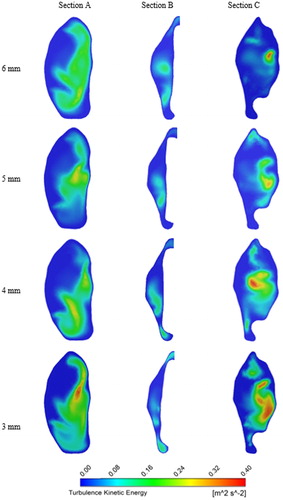
To study the influence of pharyngeal narrowing on flow behavior adjacent to the epiglottis, three axial planes are selected (see ), and they are located at the level of the epiglottis tip (section B), 10 mm above section B (section A) and 10 mm below section B (section C). shows the velocity vectors at these sections (axial plane) for the 5 L/min and 20 L/min flow rates for nasal-only inhalation. High-velocity flow can be observed at the airway center for all models and in all the three sections with section B having the highest average velocity as it has the smallest cross-sectional area. Recirculating flow patterns can also be observed in all cases. Results show that narrowing of the airway at the epiglottis level has negligible effects on the velocity magnitude and flow field pattern above the epiglottis for both the flow rates considered in this study. On the other hand, narrowing of the pharynx at the epiglottis affects both the velocity magnitude and flow field pattern at section C. The blue-coloured vectors in the figure represent the stagnation zone (no flow region), and results suggest that these regions can be enlarged by pharyngeal narrowing. The increase in the stagnation zone area corresponds with the increase in velocity at a region adjacent to the center of the airway. shows contours of turbulent kinetic energy (TKE) for the 20LPM case, at the same locations as with . As with the mean velocity field, the overall structure of the TKE in this case is not greatly affected upstream of the point of narrowing, however downstream, at position C, a significant effect can be seen. A localized high zone of turbulent kinetic energy can be seen in the 6 mm case, however this clearly spreads throughout the lumen with narrowing, indicating that increased turbulence would be expected with a narrowed lumen at the level of epiglottis. This is expected due to the local increase in velocity; however, the results interestingly indicate that there is a change in the distribution of this turbulent kinetic energy which results in higher turbulence both in the center of the lumen and adjacent to the wall.
Figure 3. Cross-sectional velocity contours at sections A, B, and C for nasal-only inhalation.
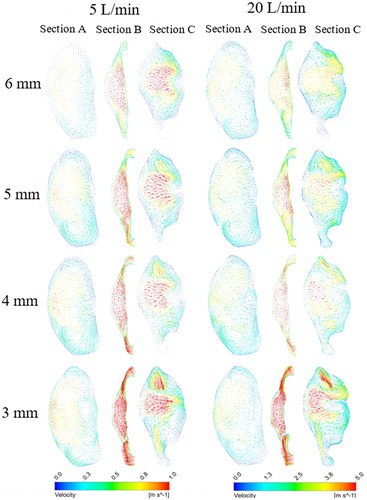
Figure 4. Turbulence kinetic energy (TKE) contours for nasal-only inhalation at sections A, B, and C.
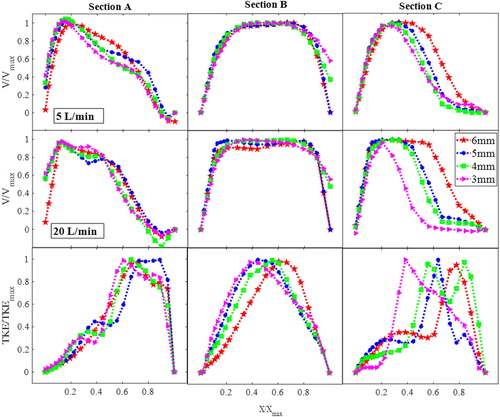
(top two rows) shows the velocity normalized by the maximum stream-wise velocity plotted vs. normalized airway lateral dimensions, at sections A, B and C, for the nasal-only inhalation cases. The bottom row of shows the normalized turbulent kinetic energy profile. For both flow-rates, narrowing of the velocity profile can be observed at section C where the maximum velocity is skewed away from the stagnation region, and with the higher flow-rate case showing a much narrower velocity profile with the narrower pharynx-with the flow approaching that of a jet-like flow (Kourmatzis, O’Loughlin, and Masri Citation2013) and these flow features are similar to existing studies using simple airway models (Shinneeb and Pollard Citation2012b, Citation2012a). indicates that the confined-jet type flow, which is a result of high velocity and sudden expansion in the area downstream of the epiglottis, is likely to be more prominent in individuals with higher BMI. For the 20 L/min case (section C), the flow profile demonstrates the existence of a shear layer (steep mean velocity gradient) further from the wall when compared to lower flow-rates and larger openings (from 0.2 < X/Xmax<0.6 for 3 mm compared to 0.6 < X/Xmax for 6 mm). This existence of a shear layer manifests as a local increase in the turbulent kinetic energy which can be seen in the bottom row of . At section A, as inferred through , there is a minimal change in the overall structure of the turbulent kinetic energy profile with narrowing, however this is clearly not the case at section C, where a shift in the peak of the turbulent kinetic energy is seen. There is also a significant change in the turbulent kinetic energy profile across the lumen from X/Xmax=0 until X/Xmax=0.4. The 6 mm and 5 mm narrowed cases show an initially steeper increase in the TKE in that region compared to the 3 mm and 4 mm cases. The results suggest that lumen narrowing can have an impact not only on the overall degree of turbulence at the level of the epiglottis, but it can also re-distribute the TKE in the lumen.
Figure 5. Velocity profiles (top and middle row) and turbulence kinetic energy (TKE) profiles (nasal-only inhalation-bottom row for 20LPM) at sections A, B, and C.
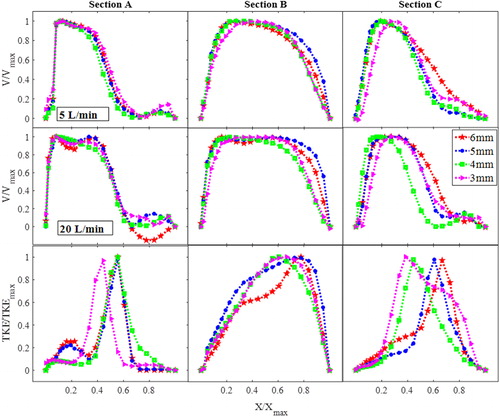
The case of oral-only inhalation is shown in , and a key result which is of interest is the much less obvious effect of epiglottal narrowing on the mean flow field downstream of the epiglottis in the case of the oral-only inhalation when compared to the nasal-only inhalation. This diminished effect is apparent for both the low and high flow-rates with the trend for the 20 L/min case not being as well-defined as in the nasal-only inhalation case. This shows that the overall structure of the mean flow is not as affected by the narrowing of the epiglottis in the case of oral-only inhalation. The reader is reminded that these plots are normalized by the maximum velocity. The situation of oral-only inhalation results in a much simpler flow entering into the oropharynx, given the simplicity of the mouth geometry compared to that of the nasal cavity. The flow emanating from the nasal cavity has yet to develop downstream, therefore interacting differently with the narrowing of the epiglottis. These results suggest that the effect of epiglottal narrowing may influence the mean flow field in the upper airway differently depending on the mode of breathing (oral or nasal), with narrowing seeming to have a more significant effect during nasal-only inhalation. While the mean flow-field is not significant affected, the third row of shows the TKE which does demonstrate an effect of narrowing. The location of the TKE peak trends clearly with the degree of narrowing, shifting from X/Xmax ∼ 0.38 for the 3 mm case to X/Xmax ∼ 0.7 for the 6 mm case demonstrating how the maximum degree of turbulence can move in the anterior-posterior direction for individuals with more lingual fats.
Figure 6. Velocity profiles (top and middle row) and turbulence kinetic energy (TKE) profiles (oral-only inhalation-bottom row for 20LPM) at sections A, B, and C.
Particle deposition (oral-only inhalation)
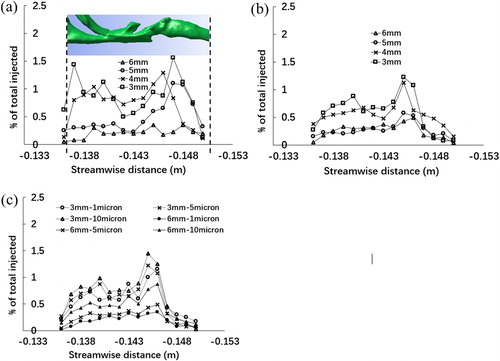
In the context of particle deposition, the key application of interest is oral inhalation drug delivery. Injection of particles through the nasal cavity, while relevant to applications of intranasal drug delivery or inspiration of environmental aerosols, results in the majority of deposition occurring in the nasal cavity, therefore significantly diminishing the importance of epiglottal lumen structure, which is the key focus of this contribution. In this section, therefore, the focus is only on the effect of narrowing at the level of epiglottis-on oropharyngeal particle deposition, for the case of oral-only inhalation. shows the results of regional deposition fraction with different degrees of narrowing (local particle number deposited/total particle number injected) for the case of 5 micron particles with 5 L/min (a) and 20 L/min (b) and for the case of 1, 5, and 10 micron particles for 20 L/min (c). The three-dimensional airway model is embedded within the figure. Regardless of the degree of narrowing, and for all particle sizes, there tends to be a steady increase in the deposition fraction just past the epiglottis, while it is also clear that deposition is significant as the air flow turns direction (at the back of the mouth). For both the 5 and 20 L/min cases, generally the 5 and 6 mm airways consistently show a lower deposition fraction than the 3 and 4 mm airways, suggesting a clear effect of narrowing. shows the effect of particle sizes for both the narrowest and widest airways. As expected, a decrease in the particle size results in lower extrathoracic deposition due to the lower Stokes numbers of the particles which are able to traverse through the airway without making contact with the wall. It is of interest to note that for the 6 mm airway, the particle size seems to have a more significant effect on deposition, which is most apparent when comparing the 5 to 10 micron particles. The role of the epiglottis on deposition is also much clearer with the 3 mm airway, given the sharper increase in deposition fraction in that region, for all particle sizes. At these physiologically relevant particle sizes, narrowing does clearly have an effect on deposition both for the laminar and the turbulent cases, as does the particle size (Grgic, Finlay, Burnell, et al. Citation2004; Grgic, Finlay, and Heenan Citation2004). Further work is clearly merited in order to fully understand the driving mechanisms behind these different degrees of deposition, though it is clear that fat deposits, causing narrowing, will influence deposition.
Figure 7. Particle deposition expressed as ratio of regional number of particles deposited to total number of particles injected for (a) 5 L/min-5microns, (b) 20 L/min-5microns, and (c) 20 L/min-1,5 and 10 microns for oral breathing only along the perpendicular dimension of the interested upper airway model.
Discussion and limitations
This study shows that pharyngeal narrowing at the level of the epiglottis, which potentially occurs during weight gain can change airflow dynamics and deposition in the upper airway. To the best of the author's knowledge, this is the first study which has demonstrated the change in flow behavior as a function of pharyngeal dimensions at the epiglottis in a three-dimensional, realistic upper airway model. While the effects of BMI changes on airway flow mechanics can also be undertaken using multiple airway models reconstructed from a sample human population with different BMI, doing so may present a challenge when comparing the results, since the upper airway geometry varies significantly between individuals. Hence, in contrast to existing works, this study uses a single airway model to systematically analyze the possible effects that pharynx narrowing may have on airway flow dynamics in an individual, and experimental validation has been conducted with a geometrically realistic upper airway. The experimental flow field was only measured in the replica of the upper airway model with no narrowing, and for a laminar flow only. PIV measurements from a fully constricted airway remain challenging due to demanding resolution requirements and also the need to avoid optical distortion, which becomes increasingly challenging with significantly deformed airways. Micro-PIV could be employed in future work in order to ameliorate the resolution issue and further work on optical correction algorithms could assist with the PIV post-processing. Further experimental work to validate the flow field for the 20 L/min case is also necessary where the flow is turbulent so as to further study the effectiveness of RANS models for this problem. This requires achieving higher flowrates using refractive index-matched liquid over the full respiratory cycle. In this study, a turbulent intensity of 5% and turbulent viscosity ratio of 10 were prescribed for the 20 L/min flow rate simulation, and this is accepted in the literature (Bass and Worth Longest Citation2018; Ghahramani et al. Citation2014; Tu, Inthavong, and Ahmadi Citation2013).
This study was confined to steady-state flows to obtain insights on the potential effects of pharyngeal narrowing in an individual during inhalation. Future studies may include analyzing transient flow to obtain comprehensive details on the effects of the pharyngeal narrowing on airflow dynamics. Secondly, most biological organs exhibit active or passive physiological motion that affects biological fluid flow (Cheng, Jacobson, and Bilston Citation2007; Cheng, Fletcher, et al. Citation2014), but rigid airway walls have been assumed in the computational models despite the fact that upper airway muscles have been demonstrated to contract actively during respiration (Cheng et al. Citation2011). While dynamic wall motion is important, based on existing measurements of upper airway muscle motility, static airways which demonstrate little or no motion during inhalation can exist in a sub-population of healthy human beings (Cheng et al. Citation2008), and therefore the assumptions made in the models are still physiologically relevant for a sub-section of individuals. Furthermore, although the computational results provided here are from rigid airway wall simulations, they present the impact of a change in the airway cross-sectional area which could follow from a deformation. Therefore the change in flow “post-deformation” can be inferred, however wall motion will also impact the transient nature of the velocity profiles and turbulence, and these features cannot be inferred from this study. Finally, the widest section of the airway in obese humans can be as small as 3 mm based on existing works (Brown et al. Citation2013). Hence, the dimension of the airway geometries used in this parametric study to demonstrate flow dynamics upstream and downstream of the epiglottis as a function of the antero-posterior dimensions at that level of the upper airway is therefore reasonable and relevant.
The results showed in demonstrated that in nasal-only inhalation, the shear layer located further from the lumen wall (with narrowing) could result in a higher turbulent intensity closer to the centerline of the flow. This is likely to be experienced by individuals with higher BMI, which may have implications on necessary breathing effort to achieve a particular flow-rate in those individuals. Results from the particle deposition simulations show that the effect of airway geometry change with narrowing is complex which agrees with recent experimental work that investigates particle deposition using a physiological realistic airway replica (Cheng et al. Citation2019). However, what can be said from the simulation results is that the narrowest airway results in a higher percentage of deposition, with a distinct increase in deposition fraction at the region of the epiglottis. The results here indicate that pharynx narrowing with increased BMI has the potential to influence particle transport and clearly merits further study.
Conclusions
The decrease in pharyngeal cross-sectional area at the epiglottis can have a significant effect on the flow-field in the airway and influence the regional deposition fraction in a situation of direct relevance to oral inhalation drug delivery. Such changes in flow behavior with pharynx narrowing suggest that BMI is an important factor to consider in the analysis of upper airway flow and inhaled particulate matter.
Appendix
Figure A1. (a) Quality of computational mesh at the nasal cavity and upper airway and (b) mesh independency study.
Additional information
Funding
References
- Azarbarzin, A., M. Marques, S. A. Sands, S. O. De Beeck, P. R. Genta, L. Taranto-Montemurro, C. M. De Melo, L. Messineo, O. M. Vanderveken, D. P. White, and A. Wellman. 2017. Predicting epiglottic collapse in patients with obstructive sleep apnoea. European Respiratory Journal 50 (3):1700345. doi:10.1183/13993003.00345-2017.
- Badr, M. S. 2014. Back to basics regarding upper airway obstruction during sleep—size matters. Sleep 37 (6):1031. doi:10.5665/sleep.3752.
- Bass, K., and P. Worth Longest. 2018. Recommendations for simulating microparticle deposition at conditions similar to the upper airways with two-equation turbulence models. Journal of Aerosol Science 119:31. doi:10.1016/j.jaerosci.2018.02.007.
- Brown, E. C., S. Cheng, D. K. McKenzie, J. E. Butler, S. C. Gandevia, and L. E. Bilston. 2015. Tongue stiffness is lower in patients with obstructive sleep apnea during wakefulness compared with matched control subjects. Sleep 38 (4):537. doi:10.5665/sleep.4566.
- Brown, E. C., S. Cheng, D. K. McKenzie, J. E. Butler, S. C. Gandevia, and L. E. Bilston. 2013. Respiratory movement of upper airway tissue in obstructive sleep apnea. Sleep 36 (7):1069–1076. doi:10.5665/sleep.2812.
- Chen, X., W. Zhong, B. Sun, B. Jin, and X. Zhou. 2012. Study on gas/solid flow in an obstructed pulmonary airway with transient flow based on CFD-DPM approach. Powder Technology 217:252. doi:10.1016/j.powtec.2011.10.034.
- Cheng, S., E. C. Brown, A. Hatt, J. E. Butler, S. C. Gandevia, and L. E. Bilston. 2014. Healthy humans with a narrow upper airway maintain patency during quiet breathing by dilating the airway during inspiration. Journal of Physiology 592:4763–4774.
- Cheng, S., J. E. Butler, S. C. Gandevia, and L. E. Bilston. 2011. Movement of the human upper airway during inspiration with and without inspiratory resistive loading. Journal of Applied Physiology 110:69–75. doi:10.1152/japplphysiol.00413.2010.
- Cheng, S., J. E. Butler, S. C. Gandevia, and L. E. Bilston. 2008. Movement of the tongue during normal breathing in awake healthy humans. Journal of Physiology 586:4283–4294.
- Cheng, S., D. Fletcher, S. Hemley, M. Stoodley, and L. Bilston. 2014. Effects of fluid structure interaction in a three dimensional model of the spinal subarachnoid space. Journal of Biomechanics 47 (11):2826. doi:10.1016/j.jbiomech.2014.04.027.
- Cheng, S., E. Jacobson, and L. E. Bilston. 2007. Models of the pulsatile hydrodynamics of cerebrospinal fluid flow in the normal and abnormal intracranial system. Computer Methods in Biomechanics and Biomedical Engineering 10 (2):151. doi:10.1080/10255840601124753.
- Cheng, S., A. Kourmatzis, T. Mekonnen, H. Gholizadeh, J. Raco, L. Chen, P. Tang, and H. Chan. 2019. Does upper airway deformation affect drug deposition? International Journal Of Pharmaceutics :118773. doi:10.1016/j.ijpharm.2019.118773.
- Ghahramani, E., O. Abouali, H. Emdad, and G. Ahmadi. 2014. Numerical analysis of stochastic dispersion of micro-particles in turbulent flows in a realistic model of human nasal/upper airway. Journal of Aerosol Science 67:188. doi:10.1016/j.jaerosci.2013.09.004.
- Grgic, B., W. H. Finlay, P. K. P. Burnell, and A. F. Heenan. 2004. In vitro intersubject and intrasubject deposition measurements in realistic mouth-throat geometries. Journal of Aerosol Science 35 (8):1025. doi:10.1016/j.jaerosci.2004.03.003.
- Grgic, B., W. H. Finlay, and A. F. Heenan. 2004. Regional aerosol deposition and flow measurements in an idealized mouth and throat. Journal of Aerosol Science 35 (1):21. doi:10.1016/S0021-8502(03)00387-2.
- Heenan, A. F., W. H. Finlay, B. Grgic, A. Pollard, and P. K. P. Burnell. 2004. An investigation of the relationship between the flow field and regional deposition in realistic extra-thoracic airways. Journal of Aerosol Science 35 (8):1013. doi:10.1016/j.jaerosci.2004.03.004.
- Kim, A. M., B. T. Keenan, N. Jackson, E. L. Chan, B. Staley, H. Poptani, D. A. Torigian, A. I. Pack, and R. J. Schwab. 2014. Tongue fat and its relationship to obstructive sleep apnea. Sleep 37 (10):1639. doi:10.5665/sleep.4072.
- Kourmatzis, A., S. Cheng, and H. K. Chan. 2018. Airway geometry, airway flow, and particle measurement methods: implications on pulmonary drug delivery. Expert Opinion on Drug Delivery 15 (3):271. doi:10.1080/17425247.2018.1406917.
- Kourmatzis, A., W. O’Loughlin, and A. R. Masri. 2013. Effects of turbulence, evaporation and heat release on the dispersion of droplets in dilute spray jets and flames. Flow, Turbulence and Combustion 91 (2):405. doi:10.1007/s10494-013-9493-5.
- Li, C., J. Jiang, H. Dong, and K. Zhao. 2017. Computational modeling and validation of human nasal airflow under various breathing conditions. Journal of Biomechanics 64:59. doi:10.1016/j.jbiomech.2017.08.031.
- Li, C. J., T. Wu, C. X. Li, and B. Sun. 2003. Effect of spray particle trajectory on the measurement signal of particle parameters based on thermal radiation. Journal of Thermal Spray Technology 12 (1):80. doi:10.1361/105996303770348537.
- Martinez, G. S., J. V. Spadaro, D. Chapizanis, V. Kendrovski, M. Kochubovski, and P. Mudu. 2018. Health impacts and economic costs of air pollution in the metropolitan area of Skopje. International Journal of Environmental Research And Public Health 15 (4):626. doi:10.3390/ijerph15040626.
- Nicolaou, L., and T. A. Zaki. 2013. Direct numerical simulations of flow in realistic mouth-throat geometries. Journal Of Aerosol Science 57:71. doi:10.1016/j.jaerosci.2012.10.003.
- Shinneeb, A. M., and A. Pollard. 2012a. Investigation of the flow physics in the human pharynx/larynx region. Experiments in Fluids 53 (4):989. doi:10.1007/s00348-012-1336-y.
- Shinneeb, A. M., and A. Pollard. 2012b. Identification of vortical structures inside the human pharynx/larynx region from POD-reconstructed velocity fields. Experiments in Fluids 53 (2):353. doi:10.1007/s00348-012-1293-5.
- Sutherland, K., R. W. W. Lee, C. L. Phillips, G. Dungan, B. J. Yee, J. S. Magnussen, R. R. Grunstein, and P. A. Cistulli. 2011. Effect of weight loss on upper airway size and facial fat in men with obstructive sleep apnoea. Thorax 66 (9):797. doi:10.1136/thx.2010.151613.
- Tu, J., K. Inthavong, and G. Ahmadi. 2013. Computational fluid and particle dynamics in the human respiratory system. Netherlands: Springer. doi:10.1007/978-94-007-4488-2.