
 ?Mathematical formulae have been encoded as MathML and are displayed in this HTML version using MathJax in order to improve their display. Uncheck the box to turn MathJax off. This feature requires Javascript. Click on a formula to zoom.
Abstract
A toroidal-shaped differential mobility analyzer (DMA), called toroidal Hanyang-DMA (toroidal Hy-DMA), was developed for particle characterization. The height, width, and weight of the newly developed toroidal Hy-DMA are 8 cm, 14 cm, and 1.2 kg, respectively, indicating that it is much more compact and lighter than the TSI long-DMA; nevertheless, the classifiable particle size range is up to 400 nm. Therefore, the toroidal Hy-DMA can be useful for many applications in a limited space owing to its small size. The performance of the Hy-DMA was evaluated using tandem differential mobility analyzer (TDMA) experiments with two identical Hy-DMAs and numerical simulations using a single-particle tracking analysis in a Lagrangian framework. To simulate particle behaviors, a flow-rate-weighted particle injection method, which is more realistic, was employed, and the proposed particle tracking method can be widely applied to any non-plug flow conditions. The obtained experimental data and numerical results of central particle sizes are consistent with each other. Empirical and numerical transfer functions of the toroidal Hy-DMA were obtained and compared with those of other types of well-known DMAs. It is concluded that the toroidal Hy-DMA has an empirical transmission probability ranging from 0.5 to 0.9 and a sizing resolution ranging from 5.5 to 9.0, which indicates acceptable performance in classifying monodisperse particles within the test size range of 20 to 400 nm.
Copyright © 2019 American Association for Aerosol Research
EDITOR:
1. Introduction
Particle size is one of the most important parameters to understand the effects of atmospheric aerosols on the environment including human health and climate change (Fuzzi et al. Citation2015; Kim, Kabir, and Kabir Citation2015). The deposition behaviors of airborne particles are mostly defined by their sizes in respiratory systems, which have been directly associated with health problems (Brown et al. Citation2013). In terms of the effects on climate, atmospheric airborne particles tend to scatter and absorb solar radiation, which in turn changes temperature, visibility and other atmospheric properties (Turnock et al. Citation2015; Liu et al. Citation2018; Wang, Zhang, and Yu Citation2019). In addition, airborne particles can be a source in cloud formation as condensation nuclei, and their sizes are considered a key factor for changing regional and global environments (Fofie, Donahue, and Asa-Awuku Citation2018; Benduhn et al. Citation2016). Therefore, the development and improvement of characterization methods and instruments should be encouraged for a better understanding of the influences of atmospheric airborne particles on environments (McMurry Citation2000).
There are particle classifying methods such as diffusion batteries, impactors, and cyclones, employing diffusivity and inertia of aerosols, which are also based on their sizes (Onischuk et al. Citation2018; Zhang et al. Citation2019; Elmes and Gasparon Citation2017; Cai et al. Citation2019). The operations of these instruments are relatively simple and easy; however, the limited classifiable size ranges and resolutions prevent them from being frequently and effectively used. In terms of high resolution and sensitivity, a differential mobility analyzer (DMA) is considered an essential instrument for aerosol research and its applications by generating and classifying sub-micrometer monodisperse airborne particles based on their electrical mobility, Zp, which is related to particle diameter, dp, as follows:
(1)
(1)
where n is the number of elementary charges, e is the elementary charge, μ is the fluid viscosity, and Cc is the Cunningham slip correction factor, which can be found in Kim et al. (Citation2005). The DMA was first introduced by Hewitt (Citation1957), and since then it has been developed further by many researchers (Liu and Pui Citation1974; Knutson and Whitby Citation1975; Rosell-Llompart et al. Citation1996; Santos et al. Citation2009; Chen et al. Citation1996; Chen et al. Citation1998; Myojo, Takaya, and Ono-Ogasawara Citation2002; Birmili et al. Citation1997; Reischl, Mäkelä, and Necid Citation1997; Stolzenburg et al. Citation2018). Several DMA designs have been suggested to cover various applications and to satisfy the increasing demands in aerosol research, and several representative DMAs have been developed in the early period. The most popular and well-known DMAs are from TSI Inc., the world’s biggest aerosol instrumentation company. Depending on the DMA size, i.e., the length of cylindrical electrodes, they are classified as follows: TSI standard long-DMA (Liu and Pui Citation1974), TSI short-DMA (Kousaka et al. Citation1986), and TSI nano-DMA (Chen et al. Citation1998) for classifying fine particles to ultrafine particles. Owing to the increasing demands on classifying sub-10 nm particles and atomic clusters, studies on DMAs with higher resolution and transmission of small particles have been performed (Cai et al. Citation2018; Reischl, Mäkelä, and Necid Citation1997; Stolzenburg et al. Citation2018; Kangasluoma et al. Citation2016; Fernández de la Mora and Kozlowski Citation2013; Brunelli, Flagan, and Giapis Citation2009; Winklmayr et al. Citation1991). Furthermore, particle losses on the wall of DMAs for sub-10 nm particles with high diffusivity have been mitigated by adopting higher operating flow rates to reduce the particle residence time in a classification zone (De Juan and Fernández De La Mora Citation1998; Chen et al. Citation1999).
Other than the standard design of DMAs with cylindrical electrodes, different DMA geometries such as parallel-plate and circular-disk analyzers have been reported to have higher transmission efficiency and better resolution of sub-20 nm particles (Zhang et al. Citation1995; Alsharifi and Chen Citation2018; Liu and Chen Citation2016; Li et al. Citation2009). By reducing diffusional broadening effects from a shorter residence time, Zhang et al. (Citation1995) developed a radial DMA targeting sub-10 nm particle classification and obtained a transmission efficiency of 0.85 to 0.90 for 3 to 10 nm particles. Similar to the classification principle of a radial DMA, Li et al. (Citation2009) employed two parallel disk electrodes in a compact mini-disk electrostatic aerosol classifier and achieved a transmission efficiency of approximately 67% for 10 nm particles. These designs have attracted attention owing to their compactness and portability, which paved the way for their widespread use in ground stations and airborne platforms for aerosol research.
Generally, but not always, DMAs are operated in two size ranges; 1) single-digit nanometers to tens of nanometers and 2) tens of nanometers to sub-1 μm. Mostly, the operating size range is determined by the size of the DMA owing to the particle residence time at the classification zone. Relatively larger particles require longer residence time in the classification region to be transferred to a sampling slit by an electric force, which inevitably occupies a certain volume of space. So far, most of the developments in terms of the design of a DMA focused on miniaturizing the DMA size to classify sub-20 nm particles as described above. However, it is also very important to classify relatively larger particles up to hundreds of nanometers, and the TSI standard long-DMA is most widely used in this size range. There are other types of DMAs for measuring and classifying large particles of size hundreds of nanometers, and they are usually bulky in size as longer residence time is unavoidable for the particle classification. Furthermore, the designs of DMAs are limited to a straight shape with cylindrical electrodes. Therefore, it is necessary to develop a compact-designed DMA for the classification of large particles of size up to hundreds of nanometers and very small ultrafine particles.
The availability of various DMAs renders them employable for different applications. Recently, the assessment of air quality using ground-based monitoring, manned aircrafts, and unmanned aerial vehicles (UAVs) has become very important in atmospheric research (Zang et al. Citation2017; Villa et al. Citation2016; Harrison et al. Citation2015; Mölders et al. Citation2015; Bates et al. Citation2013). Especially, in situ air-quality monitoring using small UAVs equipped with various sensors is attracting attention owing to their access to dangerous, risky, or complex sites, providing comprehensive local and regional data (Gu, Michanowicz, and Jia Citation2018; Villa et al. Citation2016; Diaz et al. Citation2015). Therefore, it is beneficial to develop smaller and lighter instruments for air-quality monitoring systems. In this study, we introduce a newly developed DMA, called the toroidal Hanyang-DMA (Hy-DMA) with a toroidal configuration, which has a U-shaped classification zone. This configuration has never been introduced before. The designed configuration enables relatively larger particles to migrate with a sufficiently long residence time inside the DMA and to be classified. The performance of the Hy-DMA was evaluated via an experiment, and numerical simulations were performed by tracking individual particles in a Lagrangian framework to evaluate the transmission efficiency and resolution, i.e., height and full-width at half-maximum (FWHM) of the transfer function. The toroidal Hy-DMA has a smaller size and lighter weight compared with those of present DMAs for the classification of relatively large particles. Its performance will inspire other researchers to improve future DMA designs, and our numerical simulations using the single-particle tracking method will be a promising guideline to evaluate DMA performances.
2. Methods
2.1. Design of the toroidal Hy-DMA
shows a schematic diagram of the toroidal Hy-DMA. It has a height of 8 cm, width of 14 cm, and weight of 1.2 kg, and is much smaller and lighter than other typical types of DMAs widely used for large particle classification as summarized in . In Figure S1 in Supplemental Information, the real picture of the Hy-DMA and a TSI standard long-DMA (model 3081, TSI Inc.) is shown for size comparison. The Hy-DMA has a toroidal configuration with the U-shaped classification zone, and hence, particles have sufficiently longer residence time in the classification zone; therefore, it enables relatively larger particles with mobility-equivalent diameter up to 400 nm to be classified, but with smaller DMA size. The body of the Hy-DMA including the electrode is made of aluminum, and the base of the body, where ports are located as shown in , is made of a plastic material.
Figure 1. Schematic diagram of the toroidal Hy-DMA.
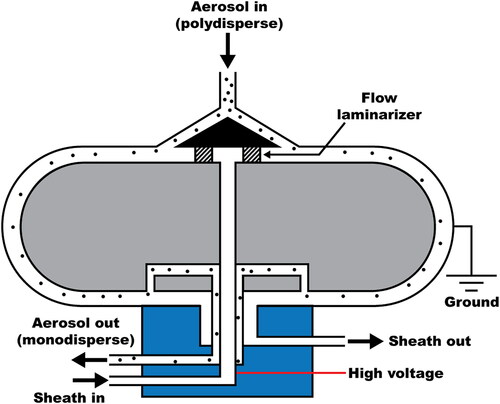
Table 1. Representative cylindrical DMAs for classifying large particles.
In the toroidal Hy-DMA, there is one port at the top of the instrument where polydisperse aerosol particles (0.3 and 0.5 L/min) are introduced, and three ports are located at the base of the Hy-DMA body for clean sheath air (3 or 5 L/min), excess air (3 or 5 L/min), and monodisperse aerosols (0.3 and 0.5 L/min). The sheath air enters the DMA along its center axis and forms laminar flow by passing through a porous material, i.e., laminarizer made of polyethylene material with a pore size larger than 200 μm. The introduced sheath flow is combined with the polydisperse aerosol flow before the classification zone with a 5 mm gap between the inner and outer walls, i.e., electrodes. High voltage ranging from −10 to −4000 V is applied to the inner wall, and the outer wall is grounded. The electric field is formed between the walls and differentiates charged particles based on their electrical mobilities. Particles inside a narrow electrical mobility band are transported to a 0.5 mm slit located at the end of the classification region. Therefore, the classified monodisperse aerosol particles exit the aerosol outlet connected to the bottom of the DMA. Notably, the key feature of the Hy-DMA is the U-shaped classification zone as shown in . It is employed to miniaturize the toroidal Hy-DMA and to have a similar performance to DMAs with a cylindrical type in terms of the classifiable particle size range. Therefore, we expect that the small and light Hy-DMA can be utilized in a limited space effectively and portably for various applications.
2.2. Experimental setup and procedure
shows schematic diagrams of experiments for the evaluation of the performance of the toroidal Hy-DMA. We employed two different setups as shown in . is used for comparing voltages applied to the Hy-DMA and TSI long-DMA for the same central particle size classification. From the experiment, we observed the relationship between the applied voltages of the two DMAs, and the data were used for the demonstration of the sizing accuracy of numerical simulations. In the experiment, compressed clean air was supplied to a Collison atomizer, and 0.01–0.1 wt% NaCl solutions were used for particle generation. The droplets with NaCl particles generated from the atomizer were dried during transportation by using a diffusion dryer and then became polydisperse NaCl particles. The particles passed through a neutralizer with a radioactive source of Po-210 to achieve a bipolar charge distribution before entering the Hy-DMA. The toroidal Hy-DMA was operated at a fixed voltage to generate singly-charged monodisperse particles, which were introduced to the TSI standard long-DMA. The monodisperse particles generated from the Hy-DMA outlet were scanned in a stepwise manner by the standard DMA, and the concentration of the scanned particles was measured using a condensation particle counter (CPC, model 3775, TSI Inc.). The sheath-to-aerosol flow rate ratio for the Hy-DMA was set to be 10:1, i.e., 3:0.3 and 5:0.5 L/min, which was also applied to the standard DMA.
Figure 2. Experimental schematics for the evaluation of the toroidal Hy-DMA (a) using a TSI standard long-DMA and CPC for sizing accuracy and (b) using two identical Hy-DMAs to obtain the transfer functions of the toroidal Hy-DMA.
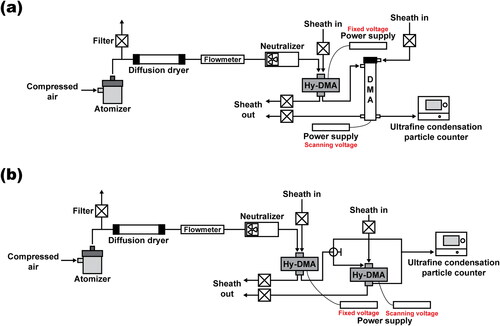
Notably, even though the experiment using the setup in can provide the sizing accuracy of the toroidal Hy-DMA compared with the long-DMA as a reference DMA, it is insufficient to evaluate the overall performance of the Hy-DMA, i.e., the transfer function. Therefore, other experiments were performed using the setup in to obtain the empirical transfer function of the toroidal Hy-DMA. In the setup, two identical Hy-DMAs were aligned in series (tandem), which improves the accuracy of the deconvoluted scan results (Stratmann et al. Citation1997; Fissan et al. Citation1996). The general experimental procedure is the same as the one used in . The voltage in the first Hy-DMA was fixed to generate monodisperse particles, which were scanned by the second Hy-DMA in a stepwise manner, and the upstream and downstream concentrations of the second Hy-DMA were measured. We ensured that the upstream concentration was in the order of 104 particles/cm3 to obtain the statistically reliable downstream concentrations. The scan cycle with the voltage raised in a stepwise manner by a factor of 1.05 required approximately less than 20 min, which was sufficiently long to avoid distortions of concentration responses.
The tandem differential mobility analyzer (TDMA) scan data are the results of convolution of the two Hy-DMA transfer functions. An iterative deconvolution algorithm developed for two identical DMAs was employed, assuming two DMAs have the identical triangular transfer functions. The height and width of the two identical transfer functions were adjusted to find the best fit of the predicted (fitted) concentrations to measured concentrations downstream of the second Hy-DMA at each data point was achieved by minimizing the error parameter of the sum of squares of residuals, i.e., the difference between the predicted and measured results. The details on the deconvolution process can be found in Rader and Mcmurry (Citation1986). The obtained transfer function was compared with the numerical transfer function of the toroidal Hy-DMA.
2.3. Numerical simulation
The performance of the toroidal Hy-DMA was also evaluated by performing computational fluid dynamics simulation of particle classification in a Lagrangian framework using an individual-particle tracking method. The height and FWHM of the numerical transfer function for each particle size were obtained for the performance evaluation of the Hy-DMA. Furthermore, numerically obtained central particle sizes at the applied voltages were compared with the experimental data.
2.3.1. Simulation domain
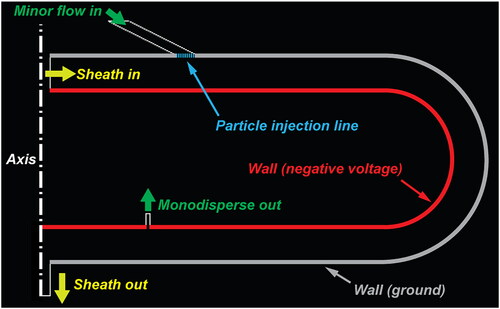
shows the calculation domain of the toroidal Hy-DMA. A 2-D axisymmetric calculation domain and meshes were created using Gambit software. The meshes were regular and structured quadrilateral elements for the entire domain. The calculation domain contains two inlets and two outlets, i.e., one minor air flow inlet with particles (aerosol flow), one sheath air flow inlet, one minor air flow outlet with classified particles, and one sheath air flow outlet. A “velocity inlet” boundary condition was set to both inlets, and velocity inputs were calculated based on the areas of the minor and sheath flow inlets and flow rate used in the experiments, i.e., 3:0.3 and 5:0.5 L/min. An “outflow” boundary condition was set for the two outlets with flow rate weightings, i.e., 1.0 and 0.1 for the sheath flow out and minor air flow out, respectively, to achieve the sheath-to-aerosol flow rate ratio of 10:1.
Figure 3. Calculation domain for the numerical study of the toroidal Hy-DMA and the boundary conditions.
2.3.2. Flow and electric field calculation
In this study, we assumed steady, incompressible and laminar flow conditions and solved continuity, momentum and energy equations using ANSYS Fluent v18.0 software. Along with these three equations, the electric potential equation was solved simultaneously to exert the electric force to charged particles. A constant potential was applied to the inner wall, and the zero potential, i.e., ground, was set to the outer wall as the wall boundary condition. For the convergence criteria, the local pressure, velocity and flow rate were monitored during the calculation, and we ensured that these values were stable and the relative error in every equation was below 10−7 at the end of the iteration process.
2.3.3. Particle tracking method
After calculating flow fields for different conditions depending on the flow rate (3:0.3 and 5:0.5 L/min) and electric potential with different fixed voltages on the toroidal Hy-DMA, we employed the discrete phase model (DPM) embedded in ANSYS Fluent software, which is a Lagrangian approach to track individual particles throughout the calculation domain. During the DPM process, a particle position is obtained at a given time, and the related force balance equation can be expressed as follows:
(2)
(2)
where v is the particle velocity, t is the time, mp is the particle mass and, F is the force acting on the particle. The dominant forces acting on particles are Brownian diffusion, gravitational settling, Stokes drag with slip correction and electric force. In this study, the gravitational effects for the size range of particles are negligible, and we confirmed that models with and without considering the gravitational settling produce equivalent estimates of transmission efficiency.
In the DPM process, particles with an identical size, i.e., single-sized particles, were injected to calculate the transmission probability of the toroidal Hy-DMA. The numerical transmission probability was calculated as follows:
(3)
(3)
where Nin and Nout are the number of particles injected from an injection line and the number of particles escaping through the 0.5 mm slit at the end of the classification zone, respectively (please refer to for the locations). Notably, this numerical particle-tracking method employing single-sized particles does not require any data inversion or deconvolution process to obtain the DMA transfer function. Therefore, the transmission probabilities obtained by injecting single-sized particles directly represent the height of the transfer function of the toroidal Hy-DMA.
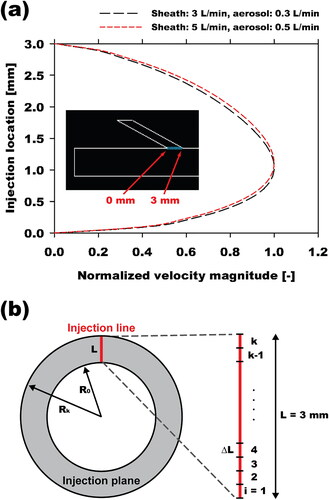
For the particle injection, we designated an injection location and the number of injected particles. Particles are injected from the location denoted in . The injection method in the standard DPM considers particles with a constant spacing at the injection line. However, owing to the axisymmetric configuration of the toroidal Hy-DMA the flow velocity at the injection line varies depending on the location of the injection line as shown in . Therefore, to be more realistic, the particle injection method with the weighted flow rate at the aerosol inlet, i.e., injection line, should be employed. By doing this, we can simulate more particles injected proportional to the local flow rate. To consider this, first we divided the particle injection line (length: L) into segments (number of segments: k) evenly as shown in . Therefore, each segment has a length of ΔL = L/k. The flow rate at each segment, Qi, can be expressed as follows:
(4)
(4)
where vi and Ai are the average flow velocity at the ith segment and the annular area at the segment, respectively. The velocity at each segment, vi, was obtained from the flow field calculation as shown in , and the area, Ai, can be calculated as follows:
(5)
(5)
where i is from 1 to k, and Ri is the distance from the center of the circle in to the end of the ith segment. From this calculation, we obtained the number of particles in each segment proportional to the flow rate, i.e., there are more particles in the segment with higher flow rate. Subsequently, particles are placed at randomized locations within each segment until the number of placed particles reaches the determined number of particles for the segment. All these calculations and processes were performed using MATLAB code. Using the proposed injection method, we presented the exemplary injected particles placed at the injection line according to the different values of the number of segments and particles, k and Nin, respectively, in Figure S2 in Supplemental Information. In this study, we injected 2000 particles, i.e., Nin = 2000, with 50 segments, i.e., k = 50, at the injection line. These injected particles were tracked in a Lagrangian framework, and the number of particles escaping through the 0.5 mm slit located at the end of the classification zone, Nout, were obtained to determine the transmission probability using EquationEquation (3)
(3)
(3) .
Figure 4. (a) Normalized velocity magnitude at the injection line in the aerosol inlet and (b) schematic explanation of the single particle tracking method.
3. Results and discussion
3.1. Experiment
3.1.1. Experimental mobility distribution
The relation between particle size and voltage applied to the toroidal Hy-DMA was determined by using the TSI standard long-DMA. In the experiments as described in the previous section, at a fixed voltage on the Hy-DMA, monodisperse NaCl particles were scanned by the long-DMA in a stepping mode from the smallest voltage setting to achieve the left tail until the concentration measurement of the CPC showed zero count after finding a peak concentration. The relation between the voltages applied to the Hy-DMA and long-DMA for peak concentration is shown in Figure S3 in the online supplementary information.
Based on the cylindrical DMA theory, the central electrical mobility, Zp*, for a cylindrical DMA can be calculated as (Knutson and Whitby Citation1975)
(6)
(6)
where Qsh and Qex are the sheath and excess flows, respectively, L is the effective classification length of the long-DMA, and V is the voltage applied to the DMA central electrode. R1 and R2 are the inner radius of the electrode and outer cylinder, respectively. According to EquationEquations (1)
(1)
(1) and Equation(6)
(6)
(6) , the scan voltages applied to the long-DMA were converted to particle size, and the normalized concentrations as a function of particle size are shown in Figures S4a and S4b in Supplemental Information for the sheath-to-aerosol flow rate ratio of 3:0.3 and 5:0.5 L/min, respectively. From the results, we can evaluate the central particle sizes classified by the toroidal Hy-DMA. The details on the central particle size data will be discussed together with those obtained from the numerical simulations in the later section. Furthermore, in Figures S4c and S4d (Supplemental Information), the normalized mobility distributions with the normalized central electrical mobility, Zp* as the abscissa, calculated from EquationEquation (6)
(6)
(6) are shown. The broadness of the mobility distribution of the smallest particle size of approximately 20 nm classified at the fixed voltages of 20 V for 3:0.3 L/min and 30 V for 5:0.5 L/min case (both red circles) is greater than other particle sizes owing to the diffusion effect, which is also observed in other studies (Hummes et al. Citation1996; Fissan et al. Citation1996).
Notably, a combination of geometric parameters such as electrode length and radii of inner and outer electrodes can be expressed by a single geometry factor (GF). For example, the GF of a cylindrical DMA and radial DMA are, respectively, defined as:
(7)
(7)
and
(8)
(8)
where b is the spacing between two flat electrodes, Ri is the radius of the aerosol inlet to the classification region, and Ro is the radius of the sampling outlet. By using a known GF with operating flow rates and applied voltage, the central electrical mobility can be easily estimated. In this study, we obtained the empirical GF of the toroidal Hy-DMA. From the voltages applied to the long-DMA for obtaining the central particle sizes classified by the Hy-DMA, we obtained the central electrical mobilities using EquationEquation (6)
(6)
(6) . represents the obtained central electrical mobility as a function of voltage applied to the Hy-DMA for the sheath-to-aerosol flow rate ratio of 3:0.3 and 5:0.5 L/min. The central electrical mobility has a relation to the GF as follows:
(9)
(9)
Figure 5. Central electrical mobility as a function of voltage applied to the toroidal Hy-DMA for the sheath-to-aerosol flow rate ratio of 3:0.3 and 5:0.5 L/min.
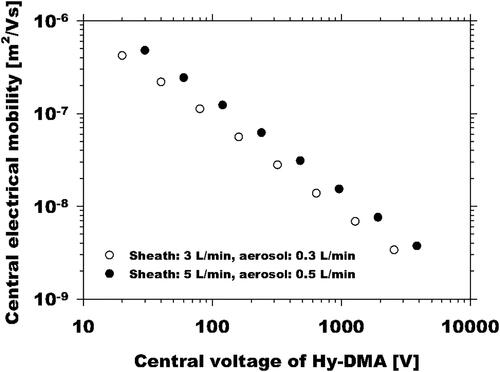
According to EquationEquation (9)(9)
(9) , we obtained 0.176 for the GF of the toroidal Hy-DMA. Notably, the GF for the TSI long-DMA is approximately 0.265 calculated from EquationEquation (7)
(7)
(7) . The higher GF indicates a higher applied voltage required for classifying particles with the same central electrical mobility.
3.1.2. Empirical transfer function
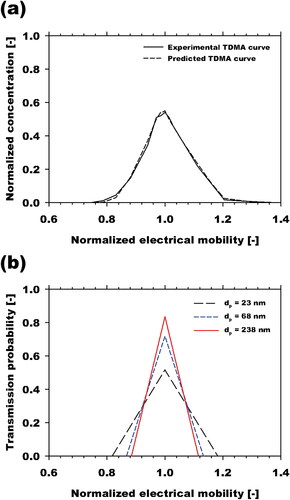
As mentioned previously, the transfer functions obtained from the deconvolution process of measured data by using two identical DMAs were analyzed to determine the toroidal Hy-DMA performances. shows the exemplary experimental and numerical TDMA data for 68 nm particles obtained by using two identical Hy-DMAs at the sheath and aerosol flow rates of 3 and 0.3 L/min, respectively. It was observed that the theoretically retrieved TDMA curve after the optimization process is consistent with the experimental TDMA curve. The deconvoluted transfer functions of the Hy-DMA for the three different particle sizes of 23, 68, and 238 nm are presented in . It can be observed that the heights of the obtained empirical transfer functions cannot reach the ideal value of 1.0 because they decrease with the decrease in particle size and the functions become broader. The heights and FWHMs of the empirical transfer functions will be compared with those of the numerical transfer functions in the following sections.
Figure 6. (a) Comparison between experimental and predicted TDMA curves for the toroidal Hy-DMA for 68 nm particles and (b) transfer functions of the toroidal Hy-DMA for 23, 68, and 238 nm particle sizes obtained via the deconvolution process at the sheath-to-aerosol flow rate ratio of 3:0.3 L/min.
3.2. Numerical simulation
3.2.1. Flow and electric field
show the exemplary velocity streamline and electric field, respectively, at the sheath-to-aerosol flow rate ratio of 5:0.5 L/min and the applied voltage of 480 V. As we designed the aerodynamical aerosol inlet with a 25° tilted shape, which is the same as the real configuration of the toroidal Hy-DMA, we observed that there is no recirculation zone in the inlet region, which is an important feature to mitigate particle losses owing to diffusion by the reduced particle residence time in the inlet (Chen et al. Citation1999). shows the vectors of electric field colored by electric potential at the aerosol inlet and monodisperse outlet. The slight instability of the electric field is presented at the connection to the inlet of the classification region, i.e., angulated spots. Significant distortions of electric field might result in additional electrophoretic losses.
Figure 7. Schematic diagram of (a) velocity streamline and (b) vectors of electric field colored by electric potential at the aerosol inlet and monodisperse outlet. The units are [m/s] for the velocity streamline and [V] for the electric potential.
![Figure 7. Schematic diagram of (a) velocity streamline and (b) vectors of electric field colored by electric potential at the aerosol inlet and monodisperse outlet. The units are [m/s] for the velocity streamline and [V] for the electric potential.](/cms/asset/f5419d94-94cb-47dc-9e3c-bae3b32969d8/uast_a_1701625_f0007_c.jpg)
3.2.2. Particle tracking
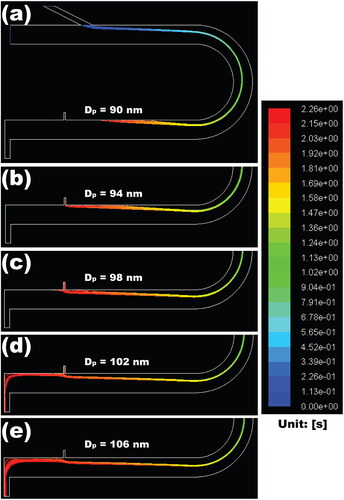
To obtain the numerical transfer function of the toroidal Hy-DMA, monodisperse particles were injected using the DPM, and their transport behaviors and sampling efficiencies were obtained. The representative particle trajectories of different-sized particles from 90 to 106 nm at 320 V colored by particle residence time are shown in . The sheath and aerosol flow rates are 3 and 0.3 L/min, respectively. Notably, the residence time of particles in the classification region is mainly dependent on the sheath and aerosol flow rates. The estimated mean residence times for the sheath flow rates of 3 and 5 L/min in this study are 2.2 and 1.3 s, respectively. In , it is observed that the 90 nm particles, which have the highest electrical mobility, could not reach the sampling slit and were deposited on the inner wall, and the particles with electrical mobility lower than the central mobility, i.e., larger particles as shown in , were not collected at the sampling slit and escaped to the sheath flow outlet. At a fixed applied voltage, we injected 2000 particles of each particle size with electrical mobility near the central mobility and calculated the transmission probabilities from zero (no particle enters the slit) to a maximum value as a function of particle size to obtain the numerical transfer function. This DPM process was repeated for different voltage and flow rate conditions.
Figure 8. Exemplary particle trajectories of different-sized particles in the toroidal Hy-DMA under the voltage of 320 V and sheath-to-aerosol flow rate ratio of 3:0.3 L/min: (a) 90 nm; (b) 94 nm; (c) 98 nm; (d) 102 nm; (e) 106 nm.
3.2.3. Particle sizing and numerical transfer function
The DMA performance is typically evaluated using the height and FWHM of a transfer function, and this was performed via the single-particle tracking analysis numerically. shows the transmission probabilities at different fixed voltages on the toroidal Hy-DMA. The transmission probability represents the height of the transfer function. summarizes comparison of the central particle sizes at test voltages on the Hy-DMA obtained experimentally (Figure S4, Supplemental Information) and numerically (). Within the voltage range, the particles have sizes from 20 to 400 nm, and the relative errors between experimental data and numerical results of the central particle sizes are less than 5%, showing very good consistency with each other.
Figure 9. Transmission probabilities of the toroidal Hy-DMA as a function of particle diameter obtained by the single particle tracking analysis for the sheath-to-aerosol flow rate ratio of (a) 3:0.3 and (b) 5:0.5 L/min.
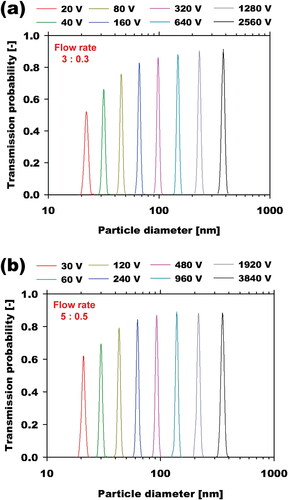
Table 2. Comparison of central particle sizes obtained by experiments and numerical simulations.
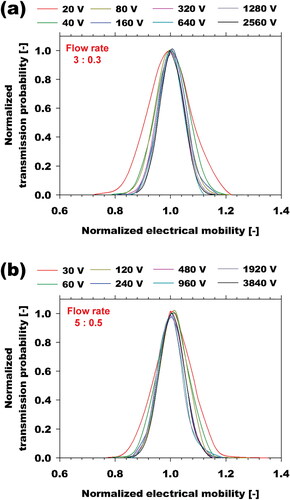
The numerical transmission probability increases with particle size, which is a consequence of the diffusion effect. When comparing the cases between the different sheath-to-aerosol flow rate ratios of 3:0.3 and 5:0.5 L/min, for relatively small central particle sizes, e.g., 20–30 nm, the transmission probability for the 0.3:3 L/min case is lower than that of the 0.5:5 L/min case as the longer residence time in the DMA at the sheath flow rate of 3 L/min results in a more broadening effect, or additional particle losses might occur. The normalized numerical transmission probabilities were plotted as a function of the particle electrical mobility normalized by the central mobility in . The plot using the normalized transmission probability enables to compare the broadness of the transfer functions distinctly. The trend of transfer functions is similar to the normalized concentration plot shown in Figures S4c and S4d (Supplemental Information), indicating more diffusion broadening effect for the smallest particles at the lowest fixed voltage (red line). From the results of , we evaluated the FWHM of each transfer function, which is an important factor for assessing the DMA resolution.
Figure 10. Normalized transmission probabilities as a function of normalized particle electrical mobility obtained by the single particle tracking analysis for the sheath-to-aerosol flow rate ratio of (a) 3:0.3 and (b) 5:0.5 L/min.
3.3. Characteristics of transfer function
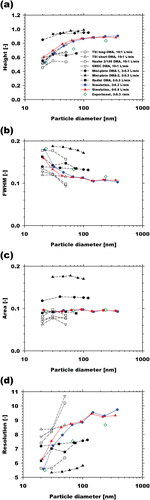
The plots for the height, FWHM, area, and sizing resolution (inversion of FWHM) of the toroidal Hy-DMA transfer function obtained via the experiment and numerical simulation are shown in . It is observed that the numerical transmission probabilities and sizing resolutions are slightly higher than the experimentally obtained ones. Instrumental imperfections, machining errors in the Hy-DMA, and other factors might lead to flow or electric field instability, resulting in the deviations. As shown in , the height of the transfer function of the Hy-DMA tends to increase whereas the FWHM decreases with the increase in particle size, and both plateau owing to the negligible diffusion effect for larger particles. The minimum height and maximum FWHM (minimum sizing resolution) were observed for the smallest particle size, i.e., 20 nm in this study. Notably, accounting for the diffusion broadening of particles but not the particle loss, the transfer function of a DMA becomes broader while maintaining the area (Martinsson, Karlsson, and Frank Citation2001). Therefore, the area of a transfer function is a good indicator for particle loss in a DMA. As shown in , we observed that the numerically and experimentally obtained areas of the transfer functions of the Hy-DMA are over 0.09, which indicates that the particle losses are less than 10% in the Hy-DMA when comparing the ideal area of 0.1 at the tested condition, i.e., the sheath-to-aerosol flow rate ratio of 10:1. The characteristics of transfer functions of other DMAs are also shown in for comparison, including the TSI long/short-DMAs, Hauke 3/150 DMA, SMEC (Spectromètre de Mobilite Electriqué Circulaire) DMA, radial DMA, and two mini-plate DMAs, whose results were extracted from other studies (Liu and Chen Citation2016; Birmili et al. Citation1997; Fissan et al. Citation1996). These DMAs were developed especially for classifying smaller nanoparticles down to sub-10 nm. The data for particle size smaller than 20 nm are not shown in . Generally, the cases of the 10 L/min sheath flow for the TSI long/short-DMAs and SMEC DMA have narrow FWHMs, i.e., high sizing resolution, owing to the shorter residence time, resulting in less diffusion effect. Even though a direct comparison might be difficult owing to the different sheath and aerosol flow rates, the toroidal Hy-DMA shows acceptable performance among them. Furthermore, it has a distinct advantage for the classification of particle size range with the consideration of the compact DMA size.
Figure 11. (a) Heights and (b) FWHMs, (c) area and (d) sizing resolution of the toroidal Hy-DMA transfer function plotted with those of different types of DMAs from other literatures.
4. Discussion and conclusions
A newly developed DMA with a toroidal shape (called toroidal Hy-DMA in this article) was introduced and evaluated experimentally and numerically. The TDMA experiments were conducted using two identical toroidal Hy-DMAs, and the empirical transfer functions of the Hy-DMA were obtained from the TDMA scan results by employing deconvolution algorithms. The obtained transfer functions were compared with the numerical transfer functions. For numerical simulations, we analyzed particles in a Lagrangian framework with the flow-rate-weighted particle injection method. The numerically obtained central particle sizes are consistent with the experimental data within the 5% relative errors. From the results of empirical and numerical transfer functions, the particle loss was estimated less than 10%, but the diffusion broadening effect is more significant, especially for particles smaller than 50 nm. When comparing the transfer functions of the Hy-DMA with those of other types of DMAs, acceptable performance was shown in terms of transmission and resolution, and the classifiable size was observed to be up to 400 nm under the test flow rate conditions.
As the toroidal Hy-DMA has a toroidal-shaped electrode, the fabrication of the Hy-DMA might be an exacting task compared with that of other DMAs with a cylindrical electrode. Therefore, special care should be taken with an elaborate machining process. Despite the complex geometry, the configuration of the toroidal Hy-DMA will be useful in many applications with limited space owing to its compact size, light weight, and less energy use. In this study, we employed the Hy-DMA for the classification and generation of monodisperse particles under the stepping voltage conditions. However, a DMA is widely used for size distribution measurement in a fast voltage scanning mode. A more complete study of the toroidal Hy-DMA in size distribution measurement with an inversion process should be reported in the future.
Supplemental Material
Download MS Word (1.1 MB)Additional information
Funding
References
- Alsharifi, T., and D.R. Chen. 2018. On the design of miniature parallel-plate differential mobility classifiers. J. Aerosol. Sci. 121:1–11. doi:10.1016/j.jaerosci.2018.04.003.
- Bates, T.S., P.K. Quinn, J.E. Johnson, A. Corless, F.J. Brechtel, S.E. Stalin, C. Meinig, and J.F. Burkhart. 2013. Measurements of atmospheric aerosol vertical distributions above Svalbard, Norway, using unmanned aerial systems (UAS). Atmos. Meas. Tech. 6 (8):2115–20. doi:10.5194/amt-6-2115-2013.
- Benduhn, F., A. Franchin, A. Kurten, E.M. Dunne, M. Kulmala, J. Kirkby, P.E. Wagner, J. Kangasluoma, A. Onnela, J.N. Smith, et al. 2016. Global atmospheric particle formation from CERN CLOUD measurements. Science 354 (6316):1119–24. doi:10.1126/science.aaf2649.
- Birmili, W., F. Stratmann, A. Wiedensohler, D. Covert, L.M. Russell, and O. Berg. 1997. Determination of differential mobility analyzer transfer functions using identical instruments in series. Aerosol. Sci. Technol. 27 (2):215–23. doi:10.1080/02786829708965468.
- Brown, J.S., T. Gordon, O. Price, and B. Asgharian. 2013. Thoracic and respirable particle definitions for human health risk assessment. Part. Fibre Toxicol. 10 (1):1–12. doi:10.1186/1743-8977-10-12.
- Brunelli, N.A., R.C. Flagan, and K.P. Giapis. 2009. Radial differential mobility analyzer for one nanometer particle classification. Aerosol. Sci. Technol. 43 (1):53–9. doi:10.1080/02786820802464302.
- Cai, C., L. V. Stebounova, D.W. Peate, and T.M. Peters. 2019. Evaluation of a portable aerosol collector and spectrometer to measure particle concentration by composition and size. Aerosol. Sci. Technol. 53 (6):1–13.
- Cai, R., M. Attoui, J. Jiang, F. Korhonen, J. Hao, T. Petäjä, and J. Kangasluoma. 2018. Characterization of a high-resolution supercritical differential mobility analyzer at reduced flow rates. Aerosol. Sci. Technol. 52 (11):1332–43.
- Chen, D., D.Y.H. Pui, D. Hummes, H. Fissan, F.R. Quant, and G.J. Sem. 1996. Nanometer differential mobility analyzer (nano-DMA): Design and numerical modeling. J. Aerosol. Sci. 27:S137–S8.
- Chen, D.-R., D. Y.H. Pui, G. W. Mulholland, and M. Fernandez. 1999. Design and testing of an aerosol sheath inlet for high resolution measurements with a DMA. J. Aerosol. Sci. 30 (8):983–99. doi:10.1016/S0021-8502(98)00767-8.
- Chen, D.R., D.Y.H. Pui, D. Hummes, H. Fissan, F.R. Quant, and G.J. Sem. 1998. Design and evaluation of a nanometer aerosol differential mobility analyzer (nano-DMA). J. Aerosol. Sci. 29 (5–6):497–509. doi:10.1016/S0021-8502(97)10018-0.
- De Juan, L., and J. Fernández De La Mora. 1998. High resolution size analysis of nanoparticles and ions: Running a Vienna DMA of near optimal length at Reynolds numbers up to 5000. J. Aerosol. Sci. 29 (5–6):617–26. doi:10.1016/S0021-8502(97)10028-3.
- Diaz, J.A., D. Pieri, K. Wright, P. Sorensen, R. Kline-Shoder, C.R. Arkin, M. Fladeland, G. Bland, M.F. Buongiorno, C. Ramirez, et al. 2015. Unmanned aerial mass spectrometer systems for in-situ volcanic plume analysis. J. Am. Soc. Mass Spectrom. 26 (2):292–304. doi:10.1007/s13361-014-1058-x.
- Elmes, M., and M. Gasparon. 2017. Sampling and single particle analysis for the chemical characterisation of fine atmospheric particulates: A review. J. Environ. Manage. 202:137–50. doi:10.1016/j.jenvman.2017.06.067.
- Fernández de la Mora, J., and J. Kozlowski. 2013. Hand-held differential mobility analyzers of high resolution for 1–30nm particles: Design and fabrication considerations. J. Aerosol. Sci. 57:45–53. doi:10.1016/j.jaerosci.2012.10.009.
- Fissan, H., D. Hummes, F. Stratmann, P. Büscher, S. Neumann, D.Y.H. Pui, and D. Chen. 1996. Experimental comparison of four differential mobility analyzers for nanometer aerosol measurements. Aerosol. Sci. Technol 24 (1):1–13. doi:10.1080/02786829608965347.
- Fofie, E.A., N.M. Donahue, and A. Asa-Awuku. 2018. Cloud condensation nuclei activity and droplet formation of primary and secondary organic aerosol mixtures. Aerosol. Sci. Technol. 52 (2):242–51. doi:10.1080/02786826.2017.1392480.
- Fuzzi, S., U. Baltensperger, K. Carslaw, S. Decesari, H. Denier Van Der Gon, M.C. Facchini, D. Fowler, I. Koren, B. Langford, U. Lohmann, et al. 2015. Particulate matter, air quality and climate: Lessons learned and future needs. Atmos. Chem. Phys. 15 (14):8217–99. doi:10.5194/acp-15-8217-2015.
- Gu, Q., D.R. Michanowicz, and C. Jia. 2018. Developing a modular unmanned aerial vehicle (UAV) platform for air pollution profiling. Sensors 18 (12):4363–14. doi:10.3390/s18124363.
- Harrison, W.A., D.J. Lary, B.J. Nathan, and A.G. Moore. 2015. Using remote control aerial vehicles to study variability of airborne particulates. Air Soil Water Res. 8:43–51.
- Hewitt, G.W. 1957. The charging of small particles for electrostatic precipitation. Trans. AIEE Part I: Comm. Electron. 76 (3):300–6. doi:10.1109/TCE.1957.6372672.
- Hummes, D., S. Neumann, H. Fissan, and F. Stratmann. 1996. Experimental determination of the transfer function of a differential mobility analyzer (DMA) in the nanometer size range. Part. Part. Syst. Charact. 13 (5):327–32. doi:10.1002/ppsc.19960130513.
- Kangasluoma, J., M. Attoui, F. Korhonen, L. Ahonen, E. Siivola, and T. Petäjä. 2016. Characterization of a Herrmann-type high-resolution differential mobility analyzer. Aerosol. Sci. Technol. 50 (3):222–9.
- Kim, J.H., G.W. Mulholland, S.R. Kukuck, and D.Y.H. Pui. 2005. Slip correction measurements of certified PSL nanoparticles using a nanometer differential mobility analyzer (nano-DMA) for Knudsen number from 0.5 to 83. J. Res. Natl. Inst. Stand. Technol. 110 (1):31. doi:10.6028/jres.110.005.
- Kim, K.H., E. Kabir, and S. Kabir. 2015. A review on the human health impact of airborne particulate matter. Environ. Int. 74:136–43. doi:10.1016/j.envint.2014.10.005.
- Knutson, E.O., and K.T. Whitby. 1975. Aerosol classification by electric mobility: Apparatus, theory, and applications. J. Aerosol. Sci. 6 (6):443–51. doi:10.1016/0021-8502(75)90060-9.
- Kousaka, Y., K. Okuyama, M. Adachi, and T. Mimura. 1986. Effect of Brownian diffusion on electrical classification of ultrafine aerosol particles in differential mobility analyzer. J. Chem. Eng. Japan. JCEJ. 19 (5):401–7. doi:10.1252/jcej.19.401.
- Li, L., D.R. Chen, C. Qi, and P.S. Kulkarni. 2009. A miniature disk electrostatic aerosol classifier (mini-disk EAC) for personal nanoparticle sizers. J. Aerosol. Sci. 40 (11):982–92. doi:10.1016/j.jaerosci.2009.09.003.
- Liu, B.Y.H., and D.Y.H. Pui. 1974. A submicron aerosol standard and the primary, absolute calibration of the condensation nuclei counter. J. Colloid Interface Sci. 47 (1):155–71. doi:10.1016/0021-9797(74)90090-3.
- Liu, P., M. Song, T. Zhao, S.S. Gunthe, S. Ham, Y. He, Y.M. Qin, Z. Gong, J.C. Amorim, A.K. Bertram, et al. 2018. Resolving the mechanisms of hygroscopic growth and cloud condensation nuclei activity for organic particulate matter. Nat. Commun. 9 (1):4076.
- Liu, Q., and D.R. Chen. 2016. Experimental evaluation of miniature plate DMAs (Mini-plate DMAS) for future ultrafine particle (UFP) sensor network. Aerosol. Sci. Technol. 50 (3):297–307. doi:10.1080/02786826.2016.1149547.
- Martinsson, B.G., M.N.A. Karlsson, and G. Frank. 2001. Methodology to estimate the transfer function of individual differential mobility analyzers. Aerosol. Sci. Technol. 35 (4):815–23. doi:10.1080/027868201753227361.
- McMurry, P.H. 2000. A review of atmospheric aerosol measurements. Atmos. Environ. 34 (12–14):1959–99. doi:10.1016/S1352-2310(99)00455-0.
- Mölders, N., M.K. Butwin, J.M. Madden, H.N.Q. Tran, K. Sassen, and G. Kramm. 2015. Theoretical investigations on mapping mean distributions of particulate matter, inert, reactive, and secondary pollutants from wildfires by unmanned air vehicles (UAVs). OJAP. 04 (03):149–74. doi:10.4236/ojap.2015.43014.
- Myojo, T., K. Ehara, H. Koyama, and K. Okuyama. 2004. Size measurement of polystyrene latex particles larger than 1 micrometer using a long differential mobility analyzer. Aerosol. Sci. Technol. 38 (12):1178–84. doi:10.1080/02786826.2004.10399460.
- Myojo, T., M. Takaya, and M. Ono-Ogasawara. 2002. DMA as a gas converter from aerosol to “Argonsol” for real-time chemical analysis using ICP-MS. Aerosol. Sci. Technol. 36 (1):76–83. doi:10.1080/027868202753339096.
- Onischuk, A.A., A.M. Baklanov, S. V. Valiulin, P.P. Moiseenko, and V.G. Mitrochenko. 2018. Aerosol diffusion battery: The retrieval of particle size distribution with the help of analytical formulas. Aerosol. Sci. Technol. 52 (2):165–81. doi:10.1080/02786826.2017.1387642.
- Rader, D.J., and P.H. Mcmurry. 1986. Application of the tandem differential mobility analyzer to studies of droplet growth or evaporation. Technology 17 (5):771–87. doi:10.1016/0021-8502(86)90031-5.
- Reischl, G.P., J.M. Mäkelä, and J. Necid. 1997. Performance of Vienna type differential mobility analyzer at 1.2–20 nanometer. Aerosol. Sci. Technol. 27 (6):651–72. doi:10.1080/02786829708965503.
- Rosell-Llompart, J., I.G. Loscertales, D. Bingham, and J. Fernández De La Mora. 1996. Sizing nanoparticles and ions with a short differential mobility analyzer. J. Aerosol. Sci. 27 (5):695–719. doi:10.1016/0021-8502(96)00016-X.
- Santos, J.P., E. Hontañón, E. Ramiro, and M. Alonso. 2009. Performance evaluation of a high-resolution parallel-plate differential mobility analyzer. Atmos. Chem. Phys. 9 (7):2419–29. doi:10.5194/acp-9-2419-2009.
- Seol, K.S., J. Yabumoto, and K. Takeuchi. 2002. A differential mobility analyzer with adjustable column length for wide particle-size-range measurements. J. Aerosol. Sci. 33 (11):1481–92. doi:10.1016/S0021-8502(02)00094-0.
- Stolzenburg, M.R., J.H.T. Scheckman, M. Attoui, H.S. Han, and P.H. McMurry. 2018. Characterization of the TSI model 3086 differential mobility analyzer for classifying aerosols down to 1 nm. Aerosol. Sci. Technol. 52 (7):748–56.
- Stratmann, F., T. Kauffeldt, D. Hummes, and H. Fissan. 1997. Differential electrical mobility analysis: A theoretical study. Aerosol. Sci. Technol. 26 (4):368–83. doi:10.1080/02786829708965437.
- Turnock, S.T., D. V. Spracklen, K.S. Carslaw, G.W. Mann, M.T. Woodhouse, P.M. Forster, J. Haywood, C.E. Johnson, M. Dalvi, N. Bellouin, et al. 2015. Modelled and observed changes in aerosols and surface solar radiation over Europe between 1960 and 2009. Atmos. Chem. Phys. 15 (16):9477–500. doi:10.5194/acp-15-9477-2015.
- Villa, T., F. Gonzalez, B. Miljievic, Z. Ristovski, and L. Morawska. 2016. An overview of small unmanned aerial vehicles for air quality measurements: Present applications and future prospectives. Sensors 16 (7):1072–20. doi:10.3390/s16071072.
- Wang, X., R. Zhang, and W. Yu. 2019. The effects of PM 2.5 concentrations and relative humidity on atmospheric visibility in Beijing. J. Geophys. Res. Atmos. 124 (4):2235–59.
- Winklmayr, W., G.P. Reischl, A.O. Lindner, and A. Berner. 1991. A new electromobility spectrometer for the measurement of aerosol size distributions in the size range from 1 to 1000 nm. J. Aerosol. Sci. 22 (3):289–96. doi:10.1016/S0021-8502(05)80007-2.
- Zang, Z., W. Wang, W. You, Y. Li, F. Ye, and C. Wang. 2017. Estimating ground-level PM2.5 concentrations in Beijing, China using aerosol optical depth and parameters of the temperature inversion layer. Sci. Total Environ. 575 (60):1219–27. doi:10.1016/j.scitotenv.2016.09.186.
- Zhang, P., G. Chen, J. Duan, and W. Wang. 2019. Experimental evaluation of separation performance of fine particles of circulatory circumfluent cyclone separator system. Sep. Purif. Technol. 210:231–5. doi:10.1016/j.seppur.2018.08.008.
- Zhang, S.H., Y. Akutsu, L.M. Russell, R.C. Flagan, and J.H. Seinfeld. 1995. Radial differential mobility analyzer. Aerosol. Sci. Technol. 23 (3):357–72. doi:10.1080/02786829508965320.