
 ?Mathematical formulae have been encoded as MathML and are displayed in this HTML version using MathJax in order to improve their display. Uncheck the box to turn MathJax off. This feature requires Javascript. Click on a formula to zoom.
Abstract
Solid particle number vehicle exhaust measurements necessitate an aerosol conditioning system that removes efficiently volatile particles, does not create artifacts, and minimizes solid nucleation particle losses. Here, we present the development and evaluation of a catalytic stripper (CS) based on a unique dual-function monolithic reactor that oxidizes hydrocarbons and stores sulfur material. The CS was tested for its tetracontane particle removal efficiency, sulfur adsorption capacity with sulfur dioxide, and particle penetration with solid CAST-generated particles. The optimal operation conditions were examined including different aerosol flows and configurations, i.e., as a stand-alone device and as part of a volatile removal system with a hot and a cold dilution stage upstream and downstream of the CS, respectively. The CS managed to comply with current legislation requirements for solid particle number measurements down to 23 nm as a stand-alone device and showed great potential as part of a volatile particle removal (VPR) system for measurements at least down to 10 nm. Finally, we compared the performance of two VPR systems that use the developed CS (VPR-CS) and an evaporation tube (VPR-ET), respectively. Our results suggest that the VPR-CS exhibits higher volatile removal efficiency without creating artifacts while the particle losses are lower with the VPR-ET. Nevertheless, when measuring solid nucleation particles generated by a diesel engine with the VPR-CS, the measurement uncertainty was very low due to its high particle penetration fractions.
EDITOR:
1. Introduction
Aerosol sampling is fundamental for accurate aerosol measurements and should ensure that a representative sample is obtained both in terms of particle concentration and size distribution (Hinds Citation1999). When sampling hot aerosol that contains humidity and volatile material, special attention should be given to condensation and other gas-to-particle conversion processes either physical or chemical that influence particle mass, number, and size (Friedlander Citation2000). An application of great importance where hot aerosol sampling plays a key role is the vehicle’s exhaust particle number measurement.
European legislation, in Euro 5b for Diesel and Euro 6 for Gasoline Direct Injection (G-DI) engines, sets a solid particle number limit for particles with mobility diameter, Dm ≥ 23 nm in addition to traditional mass-based limits. Particle number homologation measurements rely exclusively on a protocol defined by the Particle Measurement Program (PMP) (Martini, Giechaskiel, and Dilara Citation2009). Accordingly, the raw exhaust is driven to a full dilution tunnel with constant volume sampling (CVS). CVS typically operates at relatively low dilution ratios (DR around 10) and the dilution air is at ambient temperature enhancing the nucleation of volatile material and/or the condensation on solid particles. Downstream of the CVS, a volatile particle remover (VPR) setup is necessary to ensure that the measured particle number refers to solid particles. VPR consists of a heated tube, also called evaporation tube (ET), and a hot and a cold dilution stage upstream and downstream of the evaporation tube, respectively. Finally, particle number is measured downstream of the VPR system with a particle counter with 50% counting efficiency at 23 nm.
Over the last years, there is a debate on lowering the cutoff size of 23 nm which is not sufficient for some modern vehicle technologies that emit a large fraction of solid particles in the sub-23 nm size region which may be even larger than 50% of the total (Giechaskiel, Manfredi, and Martini Citation2014). Lowering the cutoff size necessitates more efficient aerosol conditioning technologies that will remove volatile and semi-volatile material with minimal size-dependent particle losses and avoid the creation of artifacts (i.e., particles that did not exist initially at the aerosol but were created in the conditioning system). The evaporation tube is a simple and robust method when measuring down to Dm = 23 nm but may be prone to re-nucleation of semi-volatile species. Specifically, this technology is able to completely evaporate hydrocarbons at temperatures >200 °C. Nevertheless, re-nucleation occurs at high hydrocarbon particle concentrations, >107 #/cm3 (Giechaskiel and Drossinos Citation2010) and higher primary dilution ratios are required in order to measure solid particles in the sub-23 nm size region (Yamada et al. Citation2015). Moreover, sulfuric acid re-nucleation is possible, forming nuclei in the range of 1–2 nm which, can grow to sizes larger than 10 nm in the presence of hydrocarbons. These artifacts are rarely larger than 23 nm (Giechaskiel and Martini Citation2014).
Alternatively, the separation of volatile and nonvolatile aerosol fractions can be achieved by thermodesorption with the thermodenuder method (Burtscher et al. Citation2001). Accordingly, the aerosol flow is first heated in order to desorb any volatile and semi-volatile material from the solid particles as well as to evaporate possible nucleation mode volatile particles. In a second stage, an adsorbing material (typically activated carbon) adsorbs the evaporated species preventing any re-nucleation. This technology is very efficient in removing hydrocarbons with low dilution ratios, but its efficiency may decrease with time due to the limited lifetime of the adsorbing material. Moreover, Swanson and Kittelson (Citation2010) found experimentally that the thermodenuder may introduce artifacts that are created due to charring or pyrolysis reactions and are enhanced at the presence of sulfuric acid. Again, the current cutoff size at 23 nm eliminates any impact of artifacts at the particle number measurements, but by lowering the cutoff size there may be implications with the thermodenuder method.
Semi-volatile material removal may be more efficient with the use of a catalytic stripper (CS), a system that combines two catalytically driven functions; the removal of hydrocarbons and sulfate species by oxidation and trapping, respectively. The first CS, developed by Khalek and Kittelson (Citation1995), was a commercial oxidation catalyst followed by a cooling coil. The rationale for adding a sulfur-trap at the CS was twofold; to prevent any poisoning of the oxidation catalyst by trapping the sulfur species (Stenitzer Citation2003) and to avoid the creation of sulfuric acid artifacts due to the conversion of SO2 to SO3 in the presence of humidity (Amanatidis et al. Citation2013). The sulfur trap can be placed either upstream (Swanson and Kittelson Citation2010) or downstream (Zheng et al. Citation2011) of the oxidation catalyst. Amanatidis et al. (Citation2013) tested both setups and found that oxidation efficiency was similar whereas the sulfur capacity, tested with gaseous SO2, increased when the sulfur trap was placed downstream of the oxidation catalyst. The reason behind that is the SO2 adsorption mechanism, thus, the conversion of SO2 to SO3 by an oxidation component and subsequently the oxidative adsorption of sulfate species on the surface and bulk of a storage component (Polato et al. Citation2005). The presence of an oxidation component may increase the SO2 storage capacity by up to 90% (Schreier et al. Citation2006).
CSs exhibit much better performance than the evaporation tube in removing volatile particles (Khalek and Bougher Citation2011). The main drawback of the CS method is the high size-dependent particle losses due to diffusion. The size-dependence becomes important below ∼50 nm and makes number concentration correction very complicated. The inclusion of sub-23 nm particles in the solid particle number measurements may increase the measurement uncertainty due to strongly size-dependent particle losses that result in non-representative average correction factors. While volatile removal efficiency increases with more dense and long monolithic reactor structures, the particle penetration efficiency decreases. Thus, the CS design is a compromise between these two parameters. Khalek (Citation2007) developed a solid particle sampling system equipped with an oxidation catalyst that was able to remove 98% of oil droplets with only 15% of particle loss at 10 nm. CSs with dual-function monolithic reactors that comply with PMP requirements were reported to achieve 50% solid particle penetration cutoff size, d50, at 10 nm (Swanson et al. Citation2013; Amanatidis et al. Citation2013).
Herein, we present the development and evaluation of a CS capable of separating volatile and semi-volatile species from solid particles with minimal particle losses. Such a system can be used in automotive but also other applications where only solid particle measurements are required. The main novelty we introduce is the use of a monolith with 200 cells/in2, cpsi, much lower than typically used for this application (Khalek Citation2007; Swanson et al. Citation2013; Amanatidis et al. Citation2013), in order to achieve high particle penetration fractions. The CS was evaluated as a stand-alone device in a wide range of flows but also as part of a VPR and compared to an ET. We examined the oxidation efficiency with tetracontane and semi-volatile CAST-generated particles and the solid particle penetration of both CS and ET and compared their performance. Moreover, the CS’s sulfur storage capacity was tested with SO2 synthetic gas with the purpose of detecting possible SO3 creation. Finally, we studied the effect of the CS’s size-dependent losses when sampling sub-23 nm diesel engine exhaust particles.
2. Catalytic stripper description
The developed CS consists of a unique dual function monolithic reactor placed in a stainless-steel canister. A honeycomb flow-through cordierite monolith configuration (length: 50 mm, diameter: 25 mm) is selected, typical for such applications (Zarvalis et al. Citation2011), with cell density 200 cpsi and 14.57 mils wall thickness. The monolithic reactor is coated with active catalytic materials that oxidize hydrocarbons and store sulfur species. shows a schematic of the CS’s principle of operation.
Figure 1. Schematic of the catalytic stripper’s principle of operation.
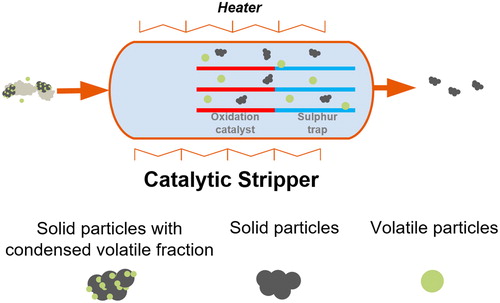
Sulfur trapping is performed with a ceria–zirconia mixed oxide. This material was selected after an extensive study of the sulfur adsorption capacity of different metal oxides like BaO, CaO, Al2O3, and MnO2 (Koidi Citation2017). Ceria acts both as oxidation and storage component (Kylhammar et al. Citation2008) while zirconia as storage and refractory component (Limousy et al. Citation2003). The ceria–zirconia mixed oxide is used as the washcoat of the monolithic reactor. The first half of the coated monolith that oxidizes the hydrocarbons is impregnated with Pt. In our configuration, the flow first passes through the oxidation catalyst and subsequently through the sulfur-trap.
The stainless-steel canister has a total length of 270 mm. It is heated via a ceramic heating resistance, the heated part being longer than the monolith, 140 mm, offering an aerosol preheating that enhances volatile particle removal (VPR). The CS operation temperature is defined by the wall temperature, Tw, which is controlled with a temperature controller and is Tw = 400 °C at all tests described in the following sections. Downstream of the monolithic reactor, a thermocouple is placed to measure the actual flow temperature that depends on the wall temperature, the inlet flow, and the inlet aerosol temperature, parameters that are examined in this study.
3. Experimental methods
3.1. Aerosol conditioning systems
Three different conditioning systems were evaluated in this study; the CS as a stand-alone device (SA-CS), a VPR equipped with the CS (VPR-CS), and a VPR equipped with an evaporation tube (VPR-ET). SA-CS consisted of the CS and an ejector diluter (DEKATI, DI-1000) adjusted to have 8 (l/min) inlet aerosol flow. presents the gas hourly space velocity (GHSV) in the monolithic reactor and in the total heated part, as well as the aerosol outlet T, Tout, at different operating flows.
Table 1. The gas hourly space velocity, GHSV, of the monolith reactor and of the total CS heated part (including the monolith), as well as the outlet aerosol T, Tout, at different operating flows.
The diluter’s dilution factor (DF) was specified with a multi-gas analyzer (MEXA 7400D) using CO2. At ambient temperature, it was 8.6 while for hot CS, it varied in the range 9.2–10.8 depending on the aerosol temperature (Giechaskiel et al. Citation2009).
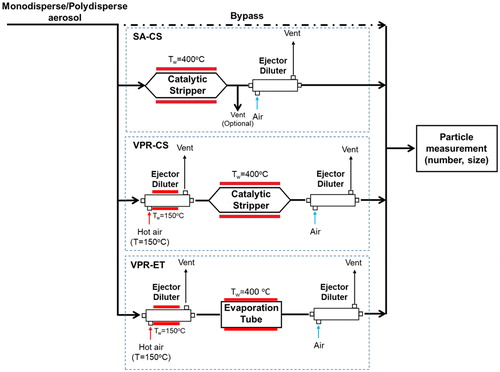
The CS was further tested as part of a VPR system. Accordingly, a hot and cold dilution stage were placed upstream and downstream of the CS, respectively. The dilution was achieved with two ejector diluters (DEKATI, DI-1000). The hot diluter Tw and the dilution air temperature were 150 °C. Similar to the SA-CS, the cold ejector diluter’s inlet flow was 8 (l/min). Downstream of the CS the aerosol temperature was Tout = 280 °C. This setup is identical to the conditioning system proposed by the PMP protocol and we will call it from now on VPR-CS. Additionally, we tested an identical VPR system equipped with an evaporation tube (VPR-ET) with length 150 mm, residence time 0.8 s, and Tw = 400 °C. The aerosol flow through the ET was 5 (l/min) and the aerosol outlet temperature was Tout = 211 °C. The different CS and ET aerosol outlet temperatures should result in different DF. However, due to the different cold ejector diluter settings the final DF, measured with the HORIBA multi gas analyzer, was similar and equal to ∼82. shows a schematic of the three conditioning systems. Any modifications applied in our experimental setups are specified in the next sections.
Figure 2. Schematic of the three aerosol conditioning systems tested in this study; the stand-alone catalytic stripper (SA-CS), the volatile particle remover equipped with a catalytic stripper (VPR-CS), and the volatile particle remover equipped with an evaporation tube (VPR-ET).
3.2. Volatile particle removal
3.2.1. Tetracontane particles
The efficiency of the CS in removing laboratory-grade volatile particles was tested with tetracontane particles, C40H82. Hydrocarbons like tetracosane and dioctyl sebacate have also been proposed in the literature (Swanson and Kittelson Citation2010). However, tetracontane particles are more difficult to be removed and this challenge aerosol is considered to represent the hydrocarbon portion of exhaust for the evaluation of VPRs by the PMP protocol (Andersson et al. Citation2007). Tetracontane particle removal decreases with increasing particle size, number concentration, and lower residence time (Giechaskiel and Drossinos Citation2010). According to the PMP protocol, the VPR should be able to remove 99% of >104 #/cm3 tetracontane particles with Dm ≥ 30 nm. Additionally, European RDE regulation requires a >99% removal efficiency of polydisperse alkane with mean size >50 nm and mass >1 mg/m3 (EU 2017).
Tetracontane particles were produced by an in-house volatile particle generator based on the evaporation–condensation technique (Friedlander Citation2000). Accordingly, tetracontane in the solid phase was placed in a ceramic crucible which was situated in a tube furnace. As the temperature increased, tetracontane evaporated and the vapors were driven with a nitrogen flow to a dilution chamber. Between the tube furnace and the dilution chamber, particles grew in size by coagulation. In the dilution chamber, high particle-free air flow was inserted and the tetracontane particles stabilized in terms of size and number concentration. The tetracontane particle size distribution (PSD) is determined by the tube furnace temperature, the nitrogen flow, and the dilution air flow.
We tested SA-CS, VPR-CS, and VPR-ET for their tetracontane particle removal efficiency using polydisperse tetracontane particles with mean sizes ∼30 nm and >50 nm. The SA-CS was tested at different flows in the range 5–30 (l/min) by adjusting the volatile particle generator’s dilution air flow. When the flow was 5 (l/min), the ejector diluter was adjusted to less than 5 (l/min) inlet flow.
Tetracontane particle number concentration and size distribution were measured both upstream and downstream of the tested conditioning systems with a Scanning Mobility Particle Sizer (SMPS) that consisted of a Long-DMA (TSI, 3081) operating with 15 l/min sheath and 1.5 l/min aerosol flow to cover the particle size range ∼6–230 nm and a CPC (TSI, 3775) operating at high flow. SMPS measurements were taking into account the diffusion losses in the instrument. Additionally, the number concentration downstream of the conditioning systems was measured with a CPC (TSI, 3776) with d50 = 2.5 nm operating at high flow. Figures S1 and S2 in the online supplementary information (SI) show the tetracontane particle removal setup for the SA-CS and the 2 VPRs, respectively. The tetracontane PSD characteristics and the mass concentration are also presented in the SI in Tables S1–S4.
3.2.2. CAST-generated particles semi-volatile fraction removal
The semi-VPR efficiency of VPR-CS and VPR-ET was additionally tested with particles generated by the diffusion flame soot generator Combustion Aerosol Standard, CAST (Matter Engineering, CAST2). The motivation for this test stems from the need for generating large quantities of thermally stable sub-23 nm particles to determine the solid particle penetration through the different conditioning systems. While CAST is widely used as a reference soot particle generator for automotive applications, recent studies have shown that under specific operating conditions it may produce a large fraction of semi-volatile material and aerosol treatment is very important for the calibration of VPR systems (Mamakos et al. Citation2013).
According to CAST’s operation principle, soot particles are formed in a co-flow diffusion flame of propane (C3H8) where the combustion air is coaxially supplied. Subsequently, soot particles are mixed with a quenching nitrogen flow to stabilize them and prevent any further combustion processes. CAST exhaust may be either measured downstream of the burner unit or diluted in a rotary diluter. The particle size and properties can be controlled by the fuel to oxidation air ratio in the flame and by the fuel premixing with nitrogen. Herein, we examined the possibility to generate large quantities of sub-23 nm particles by premixing propane with N2.
Two CAST set points (SPx) were used for this test; SP40 and SP15. The number x indicates the mean mobility diameter. lists the CAST operating conditions. Set point SP40 was standard (provided by the manufacturer) while SP15 arose from a parametric study we performed. CAST-generated particles were sampled downstream of the burner unit without any further dilution. Afterwards, the aerosol flow passed either through the VPR-CS or the VPR-ET. Finally, the PSD was measured with an SMPS composed of a nano-DMA (TSI, 3085) and a CPC (TSI, 3776). Figure S3 in the SI shows a schematic of the experimental setup.
Table 2. Operating conditions of different CAST set points.
3.3. Sulfur adsorption capacity
The CS was tested for its sulfur adsorption capacity with gaseous SO2. The scope of this test was twofold; to investigate possible SO2 to SO3 conversion and to measure the quantity of S that can be stored in the monolithic reactor. The sulfur adsorption capacity experiments were performed with a gas mixture theoretically consisting of 23 ppm SO2 and 10% O2 in N2. However, the measured SO2 concentration varied between 23 and 24 ppm and the exact value will be specified for each experiment. The monolithic reactors after being saturated with S were further tested for possible SO2 to SO3 conversion using higher SO2 concentration; 500 ppm SO2 and 10% O2 in N2. These SO2 concentrations are much higher than typical values emitted by diesel vehicles that use low sulfur fuels and are equipped with diesel oxidation catalysts (see www.dieselnet.com/tech/emi_gaa.php). However, the adsorption capacity of a catalyst is not sensitive to the SO2 concentration (Limousy et al. Citation2003). Thus, higher SO2 concentrations can be used to reduce the gas analyzer’s resolution and sensitivity effect as well as the duration of the experiment.
The gas compositions 23 and 500 ppm SO2 were achieved by using a 46 ppm SO2 and a 1000 ppm SO2 in N2 bottle, respectively, and clean air. The mixing gas flows were controlled by two mass flow controllers (MFCs). The tests were performed with gas flows 8 (l/min) and 15 (l/min) while the gas flow was optionally heated upstream of the CS at 150 °C similarly to the temperature of the aerosol flow at the outlet of a hot dilution stage of a VPR. Downstream of the CS, the gas flow passed through a cooling spiral and then was measured by the MRU VarioPlus gas analyzer (accuracy ±5%). The instrument’s response time was calculated by bypassing the CS, τ90 ∼ 14–20 s, and then was used to correct the measurement. At each flow/temperature condition, we tested only one monolith. Figure S4 in the SI shows a schematic of the test apparatus.
The monolithic reactor that exhibited the higher sulfur storage capacity was regenerated in a tube reactor placed in a high-temperature furnace. The reactor was fed with 1.3 (l/min) N2 and the outlet was guided to the MRU VarioPlus gas analyzer. The temperature was increased with a rate of 5 °C/min from T ambient to 750 °C. The regenerated monolithic reactor sulfur adsorption capacity was tested de novo under the same experimental conditions. This procedure was repeated in total two times.
3.4. Particle losses determination
3.4.1. Theoretical particle losses calculation
The main mechanisms responsible for ultrafine particle losses in the CS are diffusion and thermophoresis. The total penetration fraction, P, can be calculated by the product of the penetration fractions due to diffusion losses, Pd, times the respective penetration fraction due to thermophoretic losses, Pt. Diffusion losses depend strongly on particle size and become important for smaller particles. Thermophoretic losses occur due to the force that aerosol particles experience when a temperature gradient is established in a gas and depend mainly on the temperature difference and weakly on the particle size (Hinds Citation1999).
Here, we calculated the diffusion losses and compared them to experimental results with the CS operating as a stand-alone device at T ambient. The calculation was performed as summarized in Giechaskiel et al. (Citation2012). Accordingly,
(1)
(1)
where ξ is a dimensionless parameter and Sh is the Sherwood number that depends on the diffusion coefficient, the volumetric flow rate, and the length of the tube.
3.4.2. Experimental determination of particle losses
The experimental determination of particle losses was performed with monodisperse particles generated by CAST. We used four CAST set points (SPx); SP80, SP40, SP20, and SP15. lists the CAST operation conditions. Similar to SP15, the SP20 arose from a parametric study performed for the needs of this work. The size-specific penetration fraction, Pi, is determined by the ratio of the number concentration of particles with size i at the outlet, Nout,i, to the inlet, Nin,i, of the CS. When dilution is applied, Nout,i should be corrected with the DF.
Two different configurations were tested; the CS at ambient T without any dilution and the SA-CS setup. Both tests were performed at 8 (l/min) flow. In the first configuration, CAST-generated particles were size-selected by a long-DMA (TSI, 3081) for sizes Dm = [100, 50, 30] nm and by a nano-DMA (TSI, 3085) for sizes Dm = [15, 10, 7.5] nm. The sheath to aerosol was 1.5:15 in all cases. Subsequently, a make-up particle-free air flow was added before the monodisperse particles passed through the CS. Upstream and downstream of the CS, a CPC (TSI, 3776) measured the number concentration. Finally, a pump was employed downstream of the CS in order to achieve the required sample flow. Figure S5 in the SI shows a schematic of the experimental setup.
The SA-CS setup was tested with a similar setup with sizes Dm = [100, 50, 30, 15] nm. CAST-generated particles first passed through a PMP-like setup (oxicat setup) to ensure that they are solid and thermally stable. The oxicat setup consisted of a hot dilution stage (T = 150 °C), an oxidation catalyst operating at Tw = 450 °C, and a cold dilution stage. The number concentration was simultaneously measured upstream and downstream of the SA-CS with a CPC 3776 and a CPC 3775 in order to maintain the aerosol to the make-up air flow ratio constant. In average, the CPC 3776 counts were 10% higher than the CPC 3775. The two CPCs position changed after each measurement and the penetration fraction was determined individually for each CPC. This procedure was repeated six times for each particle size. The number concentrations measured upstream of the SA-CS were >5000 #/cm3 as required by the PMP protocol. For Dm = 15 nm, we removed the first hot dilution stage in the oxi-cat setup in order to achieve the required particle number. Figure S6 plots the experimental setup.
3.4.3. Particle number concentration reduction factor
According to the PMP protocol, solid particle number measurements are corrected with an average particle number concentration reduction factor, PCRFav that equals the ratio of the dilution factor to the average size-specific penetration fraction. The sizes used to determine PCRFav for measurements down to 23 nm, PCRFav(23), are Dm = [100, 50, 30] nm (Giechaskiel et al. Citation2010). Moreover, there are limits for the ratios PCRF100/PCRF50 < 1.2 and PCRF100/PCRF30 < 1.3 that guarantee a low measurement uncertainty.
The inclusion of sub-23 nm particles at the legislation may require the addition of smaller sizes at the average penetration fraction calculation. Giechaskiel and Martini (Citation2014) proposed that PCRFav(23) may be used even for measurements down to 10 nm when the mean particle size is >40 nm. Yamada et al. (Citation2015) proposed the inclusion of particles with Dm = 15 nm as most suitable for type approval tests down to 10 nm. Accordingly,
(2)
(2)
Giechaskiel, Lähde, and Drossinos (Citation2019) proposed the application of two PCRFs for measurements down to 10 nm; the PCRFav(23) for measurements down to 23 nm and the PCRF15 correction for particles in the range 10–23 nm. Herein, we determined experimentally the PCRF of VPR-CS and VPR-ET for sizes Dm = [100, 50, 30, 15] nm. The setup we employed was identical for the SA-CS particle losses determination and is presented in Figure S6 in the SI.
3.5. Diesel engine
Solid particle measurement with VPR-CS and VPR-ET was further tested with diesel engine exhaust particles. For this scope, we used a single-cylinder, four-stroke, 5 kW, air-cooled direct injection diesel engine that operated at 27% of its maximum load with a low-sulfur diesel fuel (<10 ppm) with 29.4 ml of fuel additive/l of fuel. Under these conditions, the diesel engine generates, additionally to the main size distribution, a solid nucleation mode (Baltzopoulou et al. Citation2019). The diesel engine PSD was measured downstream of the VPR systems with an SMPS. The experimental setup is depicted in Figure S3 in the SI.
4. Results and discussion
4.1. Tetracontane particle removal efficiency
plots the SA-CS, the VPR-CS, and the VPR-ET tetracontane particle removal efficiency as a function of aerosol flow. In , we present the results for tetracontane mean size ∼30 nm and in for mean size >50 nm. The solid line indicates the 99% removal efficiency and the dashed line the 99.9%. The tetracontane PSD characteristics are presented in the SI (Tables S1–S4). The removal efficiency plotted in is defined as the ratio of the number concentration upstream of the conditioning system measured with an SMPS, SMPSu, to the corresponding downstream measured with a CPC, CPCd, and corrected with the DF, with the thermophoretic losses, and with the losses in the ejector diluter,
(3)
(3)
Figure 3. Tetracontane removal efficiency as a function of aerosol flows for tetracontane particles mean size (a) ∼30 nm (see Tables S1 and S3) and (b) >50 nm (see Tables S2 and S4). The solid line indicates the 99% removal efficiency and the dash line the 99.9%.
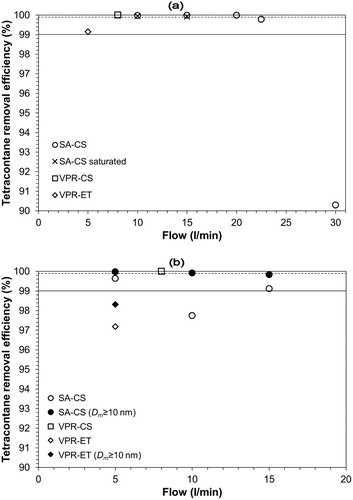
The thermophoretic losses were assumed to be 10% for ∼15 cm distance between the CS and the diluter and temperature drop of ∼80 °C (Giechaskiel et al. Citation2012), while the ejector diluter’s losses ∼5% (Giechaskiel et al. Citation2009). The CPCd measurements were on average ∼50% higher than SMPSd when almost all tetracontane particles were removed. This difference may be attributed to the lower SMPS detection size (6 nm), the CPCs difference (∼10%), and the low concentration SMPS measurement uncertainty. Howbeit, the removal efficiency definition excludes any possible overestimation. When high tetracontane concentrations were detected downstream of the conditioning systems, the difference between CPCd and SMPSd were >100%. In this case, we also plot the removal efficiency using the SMPSd measurement for particles >10 nm which we indicate as Dm > 10 nm (see ).
suggests that SA-CS is able to completely remove tetracontane particles (RE > 99.9%) with mean size ∼30 nm for flows up to 20 (l/min). The same RE was also measured for a SA-CS that used a saturated with SO2 monolithic reactor. At Q = 22.5 (l/min) RE is still higher than 99% while at Q = 30 (l/min) the removal efficiency is much lower, ∼90%, and the SA-CS fails to comply with PMP protocol demands. The tetracontane removal efficiency, for constant monolith diameter, depends mainly on the residence time, τ, and on the flow temperature, Tout. By increasing the aerosol flow, we reduce both τ and Tout and, thus, the removal efficiency decreases. The same results were observed for three monolithic reactors tested with ∼30 nm tetracontane particles. One monolithic reactor failed to pass the relative test possibly due to not appropriate Pt impregnation.
For larger tetracontane sizes () the SA-CS does not reach 99.9% RE but still removes more than 99% of tetracontane particles at flows 5 and 15 (l/min). Surprisingly at flow 10 (l/min) RE < 99% something that can be attributed to the much higher mass concentration compared to 15 (l/min) (see Table S1). The RE for Dm ≥ 10 nm is higher than 99% and reaches 99.9% at 5 (l/min). Instead, the VPR-CS achieves >99.9% removal efficiency at all testing conditions. Thus, the SA-CS may comply with new RDE regulation at low flows, but its use in a VPR system would be beneficial.
VPR-ET shows lower volatile removal efficiency than SA-CS, even for cases where the aerosol outlet T is similar. Specifically, it removes tetracontane particles with mean size ∼30 nm with >99% efficiency, but it fails to remove larger particles (). When the RE is calculated with SMPSd (Dm ≥ 10 nm), the efficiency increases but remains lower than 99% and, thus, the VPR-ET with the specific low primary dilution factor does not comply with the new RDE regulation.
4.2. CAST semi-volatiles removal efficiency
displays the changes in the PSD of CAST set points SP40 () and SP15 () when particles pass through VPR-ET and VPR-CS. The plotted values are only corrected for the DF of the VPR systems.
Figure 4. The particle size distribution of CAST-generated particles downstream VPR-CS and VPR-ET for CAST set points (a) SP40 and (b) SP15.
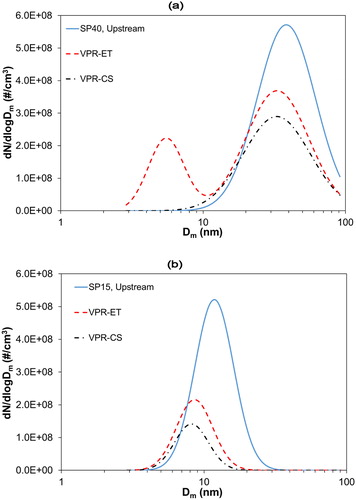
We observe some noticeable effects on the PSDs. At SP40 () the initial unimodal distribution decreases in number and size when passes through the VPR systems. Specifically, downstream of the VPR-CS the number concentration decreases by 42% and the size by ∼10%. Instead, downstream of the VPR-ET, the size distribution becomes bimodal as nucleation particles appear at size ∼6 nm. We should note that we received the same result also after cleaning the ET to exclude the formation of particles by residuals. The total number concentration remained the same, but if we exclude the nucleation artifacts from our calculation the concentration decreases by 31% and the size by ∼10%. SP15 () decreases drastically downstream of the VPR systems both in number concentration and size. Specifically, number concentration decreases 61% downstream of the VPR-ET while downstream of the VPR-CS it decreases by 76%. The particle size decreases by ∼30% in both VPRs.
suggests that CAST produces semi-volatile material that is removed in the two VPR systems with different efficiencies. The number concentration reduction downstream of the two VPRs can only be partially explained by particle losses which at 30 nm are 20% and 26% and at 15 nm are 27% and 35% for VPR-ET and VPR-CS, respectively (see Section 4.5). Moreover, the mean particle size decrease also indicates the existence of semi-volatile material that was condensed on less-volatile or solid cores. VPR-CS exhibited higher oxidation efficiency while VPR-ET created artifacts in the sub-10 nm that may be attributed to semi-volatile material re-nucleation in the cold diluter. Our results are well supported by previous studies. Mamakos et al. (Citation2013) found that under different operating conditions, CAST particles contain semi-volatile material that may even survive through the CS. Nevertheless, CS removed a high organic carbon fraction and the authors proposed high-temperature catalytic pretreatment to ensure that particles are thermally stable. Maricq (Citation2014) investigated the black carbon (BC) content of CAST-generated and found that when the fuel was pre-mixed with nitrogen, the BC decreased. He also measured the effect of a thermodesorption tube on the CAST-generated particles as a function of fuel premixing with nitrogen and he observed, similarly to our study, a shift of the nucleation mode to smaller sizes and a decrease of the number concentration. At the same operating conditions, the black carbon content (BC) was very low (<20%) and did not increase significantly when particles were thermally treated showing that pre-mixed fuel with nitrogen may drive to the generation of immature soot.
4.3. Sulfur adsorption capacity before and after regeneration
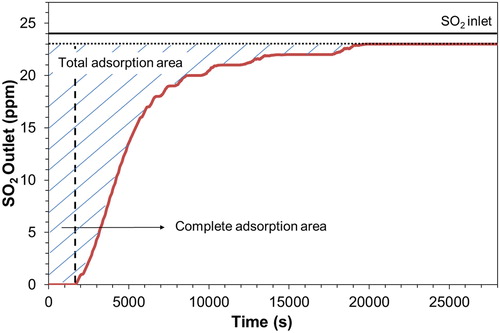
Sulfur adsorption capacity is typically defined by the total sulfur storage capacity measured until the monolithic reactor is saturated. However, at automotive applications, even a low sulfur concentration may drive to artifacts creation (Amanatidis et al. Citation2013). For this purpose, additionally to the total, we also define the complete sulfur adsorption capacity as the amount of sulfur that can be stored on the monolith while it achieves 100% removal efficiency. plots the SO2 concentration downstream of the CS when the inlet flow was 8 (l/min) and the inlet temperature 150 °C. The solid black line indicates the inlet SO2 concentration which was 24 ppm. The SO2 concentration downstream of the CS was 0 ppm for 1730 s and we define this as the complete sorption area. Afterwards, the SO2 concentration gradually increased until it stabilized and reached 23 ppm (dashed black line). The final outlet SO2 concentration was 4% lower than the initial indicating that a small amount of SO2 was converted to SO3. This was the only testing condition where the inlet and outlet SO2 concentrations differed. The complete and total sulfur storage capacity were calculated by integrating the corresponding areas defined by the outlet concentration (Amanatidis et al. Citation2013).
Figure 5. The SO2 concentration downstream the CS plotted against time for 8 (l/min) flow and 150 °C inlet temperature.
plots the complete and the total adsorption capacity of the CS. We observe that SO2 adsorption capacity is larger at 8 (l/min) compared to 15 (l/min) flow and the gas flow preheating enhances the sulfur storage capacity. Specifically, at 8 (l/min) with a preheated gas flow the complete sulfur adsorption capacity is 0.31 g of S/l of the monolithic reactor or 7.3 mg S, while the total adsorption capacity is 0.98 g/l. This complete sulfur adsorption capacity is slightly higher than the 0.27 g/l measured in Amanatidis et al. (Citation2013) where, however, the inlet flow was not heated. At the same flow, 8 (l/min), when the inlet gas flow temperature is ambient, the complete sulfur capacity decreases to 0.16 g/l. This difference shows that our catalyst performs better at T = 280 °C (8 l/min and gas preheating) compared to T = 225 °C (8 l/min without gas preheating). When the gas flow increases to 15 (l/min) the complete sulfur adsorption capacity decreases dramatically to 0.03 g/l and 0.07 g/l when the inlet temperature is ambient and 150 °C, respectively. Thus, while the tetracontane removal efficiency of the CS is very high at flows up to 20 (l/min), the sulfur adsorption capacity sets limits for the maximum aerosol flow limit. Moreover, the use of a hot dilution stage upstream of the CS is advantageous as it increases the sulfur removal efficiency.
Figure 6. The catalytic stripper’s sulfur storage capacity at 8 and 15 (l/min) with and without preheating of the inlet gas flow at 150 °C.
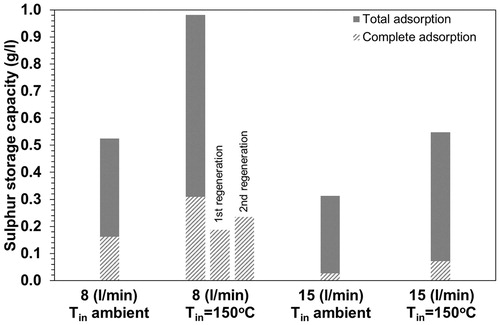
The sulfur adsorption capacity test was repeated at the optimal conditions, 8 (l/min) and gas flow at 150 °C, for the regenerated monolithic reactor. The complete sulfur adsorption capacity of the monolithic reactor after the 1st and the 2nd regeneration is between 60% and 75% of the initial. The volatile removal efficiency of the regenerated monolithic reactors was tested with tetracontane particles with mean size ∼30 nm at flows 8 and 15 (l/min) and the removal efficiency exceeded 99.9% showing that the CS offers rigorous measurements also after its regeneration and the operation time may be prolonged without influencing its efficiency.
Our initial tests showed that only at 8 (l/min) flow with preheating 4% of SO2 converted to SO3. However, the 1 ppm difference between the inlet and outlet SO2 concentration was near the gas analyzer’s detection limit and we performed additional tests with 500 ppm SO2 to confirm it. Again, the outlet and inlet SO2 concentrations were identical under all experimental conditions except for the 8 (l/min) flow with flow preheating. In this case, the outlet SO2 concentration was 485 ppm indicating that 3.5% of SO2 was converted to SO3 in agreement to the 4% difference that was found. The SO2 to SO3 conversion in an oxidation catalyst should initiate at T > 200 °C (Giechaskiel et al. Citation2007). In our tests, the aerosol flow overcomes this temperature in all operating conditions except for 15 (l/min) without preheating. Nevertheless, Tout is measured at the outlet of the monolith and the temperature in the oxidation catalyst is lower. This possibly explains why we receive a very low SO2 to SO3 conversion only at 8 (l/min) with flow preheating. In conclusion, when our CS operates in a VPR system, the sulfur trap is necessary to avoid SO2 to SO3 conversion. This applies for 8 (l/min) flow but may be important also at higher flows if the hot dilution temperature is higher than 150 °C.
4.4. Solid particle penetration fraction
plots the size-specific penetration fraction, Pi, of the CS operating at T ambient and of the SA-CS against the mobility diameter, Dm. Additionally, the theoretical penetration fraction calculated with EquationEquation (1)(1)
(1) is plotted for CS operating at T ambient. The penetration fractions are averaged over six measurements. The error bars in show the ± one standard deviation.
Figure 7. Size-specific solid particle penetration fraction against the particle’s mobility diameter, Dm, determined theoretically (solid line) and experimentally for cold CS that operates without any dilution, and experimentally determined for the SA-CS setup (hot CS followed by a cold diluter).
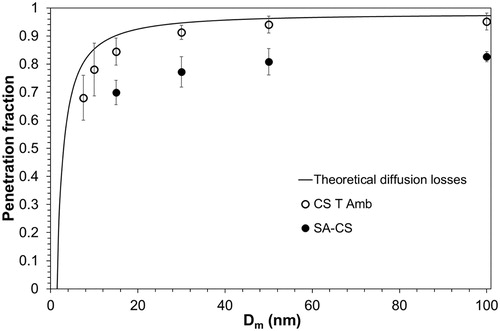
Penetration fraction for ambient T is relatively stable and almost size-independent down to 15 nm showing that diffusion losses are very low in the CS. Even down to Dm = 10 nm, we obtain a high penetration fraction, P10 = 0.78. The cutoff size, d50, cannot be observed experimentally because CAST generates a sufficient number of particles down to 7.5 nm where penetration efficiency is P7.5 = 0.68. The theoretical calculation is in good agreement with experimental results albeit slightly overpredicting Pi. The maximum relative difference between theoretical and experimental results is less than 17% for all sizes. SA-CS also exhibits very high penetration fractions down to 15 nm, P15 = 0.70. The difference between CS T amb and SA-CS penetration fractions is due to thermophoretic losses and losses in the ejector diluter. Their difference slightly increases from 15% to 20% with decreasing particle size. If we assume that the ejector diluter’s losses are ∼5% (Giechaskiel et al. Citation2009), then the thermophoretic losses from the CS to the ejector diluter are ∼10%. According to these assumptions and by taking into account the CS’s diffusion losses, the SA-CS particle penetration at 10 nm would be P10 ∼ 0.66.
The CS evaluated in Amanatidis et al. (Citation2013) exhibited 0.73 penetration fraction at 18 nm but had a steep drop at smaller sizes. Their tests were performed with polydisperse particles. Swanson et al. (Citation2013) found d50 = 10.5 nm, while Otsuki et al. (Citation2014) measured d50 = 15 nm for a VPR system equipped with a commercial CS. Finally, the higher penetration of 10 nm particles was achieved by Khalek (Citation2007), P10 ∼ 0.85.
4.5. Particle number concentration reduction factor (PCRF)
presents the PCRFi, the ratio of PCRFi with PCRF100 as well as the averages PCRFav(23) and PCRFav(10) of VPR-CS and VPR-ET. The dilution factor of the two VPR systems is 82.
Table 3. The size-specific, PCRFi, and the average particle concentration reduction factors (PCRFav(23)–PCRFav(10)), of the VPR-ET and the VPR-CS determined experimentally with monodisperse particles.
VPR-ET has lower PCRFav(23) and PCRFav(10) than the VPR-CS. The difference at sizes Dm = [100 50 30] nm may be mainly attributed to thermophoretic losses, but at 15 nm also diffusion losses play an important role. Nevertheless, the difference between the two conditioning systems is relatively low ∼8% for the PCRFav(23) and ∼11% for PCRFav(10). Most importantly, the highest PCRFav standard deviation of the VPR-CS is 10%. Furthermore, for both VPR-ET and VPR-CS, PCRF50/PCRF100 < 1.2 and PCRF30/PCRF100 < 1.3 according to the PMP requirements. Instead, the non-legislated ratio PCRF15/PCRF100 is 1.18 for the VPR-ET and 1.25 for the VPR-CS, even lower than the current PCRF30/PCRF100 limit. VPR-CS performance may be even improved with specially designed dilution systems for sub-23 nm measurements (Chasapidis et al. Citation2019).
4.6. Diesel engine exhaust particles measurement
Solid particles produced by diesel engines lie in the accumulation mode. However, under some special conditions – like fuel additive, lubrication oil, and DPF regeneration – solid nucleation particles may also be generated and the distribution becomes bi-modal. Bi-modal distributions are difficult to be reproduced downstream of a VPR system by using an average penetration fraction. The size dependence of particle losses may drive to underestimation of the total number concentration measurement. Herein, we employed a diesel engine to generate a bi-modal distribution by using a low sulfur diesel with 29.4 ml of a Ce-based fuel additive per fuel liter. compares the PSDs measured downstream of the VPR-ET and the VPR-CS. VPR-ET measurement is corrected with PCRFav(10) and is considered to represent the reference PSD due to its low size-dependent losses. The PSD measurement downstream of the VPR-CS is corrected with the DF, the PCRFav(23), and the PCRFav(10). The stability of the PSD generated by the diesel engine is relatively high (±5%).
Figure 8. Particle size distribution measurement of diesel engine generated particles downstream a VPR-ET and a VPR-CS system. The corrections applied (DF, PCRFav(23), PCRFav(10)) are indicated for each setup.
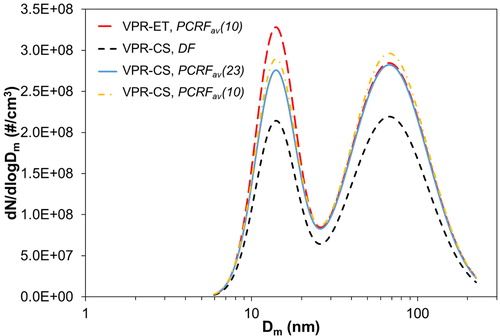
The initial bi-modal distribution exhibits a peak at Dm = 70 nm and a second peak at Dm = 14 nm that may be attributed to the Ce content of the fuel. The sub-23 nm particles fraction is 37%. Downstream of the VPR-CS, when only DF correction is applied, the PSD is lower than the reference. The PSDs are in very good agreement between them when the PSDs are corrected with the PCRFs. If we divide the PSD in two size ranges, 23–225 nm and 5–23 nm, then by applying the PCRFav(23) we manage to reproduce exactly the 70 nm peak while in the small particles size range the particles concentration is underestimated 13%. By applying the PCRFav(10), larger particles are slightly overestimated (3%) while the agreement with VPR-ET is improved at smaller particles. The total number concentration difference is 6% by applying the PCRFav(23) and 1% for the PCRFav(10). By applying the correction method suggested in Giechaskiel, Lähde, and Drossinos (Citation2019), the number concentrations are identical to the reference. In all cases, the difference is very low suggesting that the weak size dependence of the CS losses may permit robust solid particle number measurements down to 10 nm.
5. Conclusions
The objective of our study was to describe the development and evaluation of a CS; a device used for aerosol conditioning when solid particles are only measured. Our scope was to combine high catalytic function efficiency with low particle losses in order to overcome the barriers that set currently available aerosol conditioning technologies to achieve robust solid particle number measurements down to at least 10 nm. The evaluation of the CS included the determination of VPR efficiency, sulfur storage capacity, solid particle penetration, and diesel engine exhaust particles measurement. The developed CS was tested at different aerosol flows as a stand-alone device combined with a cold diluter (SA-CS), as part of a VPR (VPR-CS), and compared to a VPR system equipped with an evaporation tube (VPR-ET).
Our results indicated that the SA-CS removed with >99% efficiency tetracontane particles with mass >1 mg/m3 when the cutoff size was set at 10 nm. Instead, VPR-ET (with primary dilution ∼10) failed to overcome the 99% efficiency for the same challenge aerosol and cutoff size, even when the VPR-ET aerosol Tout was higher than the SA-CS Tout. Instead, the VPR-CS completely removed, >99.9%, tetracontane mass concentration 1.57 mg/m3 down to 2.5 nm. However, when CS was operated in a VPR, we found that a small fraction of SO2 (4%) was converted to SO3. This conversion would have been larger if the hot dilution temperature was higher. In any case, the sulfur trap of the CS was able to remove 7.3 mg S or 0.31 g of S/l of monolith volume before any SO2 was measured downstream of the CS. Our results suggest that SO2 to SO3 conversion tests would be beneficial for CSs to exclude the creation of artifacts.
The VPR systems were also tested for their efficiency to remove the semi-volatile fraction that CAST produces when propane is premixed with nitrogen. Downstream of the VPR systems the PSDs decreased in terms of number concentration and size. VPR-CS was more efficient in removing the semi-volatile material. Interestingly, downstream of the VPR-ET in one CAST set point, we obtained a nucleation artifact with size ∼6 nm. This test is much different than the tetracontane test, where large volatile particles should be removed. In any case, the artifacts created by the VPR-ET are lower than 10 nm whereas the tetracontane particles survived downstream of the VPR-ET were >10 nm. An important conclusion from CAST semi-volatiles removal tests is that catalytic treatment should be preferred compared to thermal treatment in order to obtain thermally stable CAST particles.
We determined the diffusion losses through the CS at ambient T and 8 (l/min) flow. Down to 15 nm, losses were weakly dependent on size and penetration even down to 7.5 nm was 0.68. Solid particle penetration tests through SA-CS including a cold dilution downstream of the CS, showed 15–20% lower penetration mainly due to the thermophoretic losses, estimated to be ∼10%. VPR-CS and VPR-ET exhibited relatively stable particle concentration reduction factors (PCRF) down to 15 nm, fulfilling the current PMP protocol requirements and showing promising performance for measurements down to 10 nm. Measurements of diesel engine exhaust solid sub-23 nm particles confirmed that VPR-CS may predict very well the solid particle number with different correction approaches; with PCRFav(23) that is currently used for measurements down to 23 nm, but also with two approaches proposed in the literature for measurements down to 10 nm.
In conclusion, the use of a CS increases the volatile removal efficiency compared to an evaporation tube. The implementation of the CS in a VPR is beneficial for its performance, but special care should be given to SO3 creation with dedicated tests. Finally, CSs have more diffusion losses than evaporation tubes, but it is possible to achieve high penetration fractions that permit solid particle measurements down to 10 nm with low uncertainty.
Supplemental Material
Download PDF (543 KB)Additional information
Funding
References
- Amanatidis, S., L. Ntziachristos, B. Giechaskiel, D. Katsaounis, Z. Samaras, and A. Bergmann. 2013. Evaluation of an oxidation catalyst (‘catalytic stripper’) in eliminating volatile material from combustion aerosol. J. Aerosol Sci. 57:144–55. doi: 10.1016/j.jaerosci.2012.12.001.
- Andersson, J., B. Giechaskiel, R. Muñoz-Bueno, E. Sandbach, and P. Dilara. 2007. Particle Measurement Programme (PMP) Light-Duty Inter-Laboratory Correlation Exercise (ILCE_LD). JRC Scientific and Technical Report, EUR 22775 EN.
- Baltzopoulou, P., A.D. Melas, N. Vlachos, D. Deloglou, E. Papaioannou, and A.G. Konstandopoulos. 2019. Solid Nucleation Mode Engine Exhaust Particles Detection at High Temperatures with an Advanced Half Mini DMA. SAE Technical Paper 2019-24-0052.
- Burtscher, H., U. Baltensperger, N. Bukowiecki, P. Cohn, C. Hüglin, M. Mohr, U. Matter, S. Nyeki, V. Schmatloch, N. Streit, et al, 2001. Separation of volatile and non-volatile aerosol fractions by thermodesorption: instrumental development and applications. J. Aerosol Sci. 32 (4):427–42. doi: 10.1016/S0021-8502(00)00089-6.
- Chasapidis, L., A.D. Melas, A. Tsakis, D. Zarvalis, and A.G. Konstandopoulos. 2019. A Sampling and Conditioning Particle System for Solid Particle Measurements Down to 10 nm. SAE Technical Papers 2019-24-0154.
- EU. 2017. Commission Regulation (EU) 2017/1154 of 7 June 2017 amending Regulation (EU) 2017/1151 supplementing Regulation (EC) No 715/2007 of the European Parliament and of the Council on type-approval of motor vehicles with respect to emissions from light passenger and commercial vehicles (Euro 5 and Euro 6) and on access to vehicle repair and maintenance information, amending Directive 2007/46/EC of the European Parliament and of the Council, Commission Regulation (EC) No 692/2008 and Commission Regulation (EU) No 1230/2012 and repealing Regulation (EC) No 692/2008 and Directive 2007/46/EC of the European Parliament and of the Council as regards real-driving emissions from light passenger and commercial vehicles (Euro 6). Official J. European Union L175:708–32.
- Friedlander, S. K. 2000. Smoke, dust and haze. 2nd ed. New York: Oxford University Press.
- Giechaskiel, B., M. Arndt, W. Schindler, A. Bergmann, W. Silvis, and Y. Drossinos. 2012. Sampling of non-volatile vehicle exhaust particles: a simplified guide. SAE Technical Paper 2012-01-0443.
- Giechaskiel, B., M. Carriero, G. Martini, A. Krasebrink, and D. Scheder. 2009. Calibration and validation of various commercial particle number systems. SAE Technical Paper 2009-01-1115.
- Giechaskiel, B., M. Cresnoverh, H. Jörgl, and A. Bergmann. 2010. Calibration and accuracy of a particle number measurement system. Meas. Sci. Technol. 21 (4):045102. doi: 10.1088/0957-0233/21/4/045102.
- Giechaskiel, B., and Y. Drossinos. 2010. Theoretical investigation of volatile removal efficiency of particle number measurement systems. SAE Technical Paper 2010-01-1304.
- Giechaskiel, B., T. Lähde, and Y. Drossinos. 2019. Regulating particle number measurements from the tailpipe of light-duty vehicles : the next step ? Environ. Res. 172:1–9. doi: 10.1016/j.envres.2019.02.006.
- Giechaskiel, B., U. Manfredi, and G. Martini. 2014. Engine exhaust solid sub-23 nm particles: I. Literature survey. SAE Int. J. Fuels Lubr. 7 (3):950–64. doi: 10.4271/2014-01-2834.
- Giechaskiel, B., and G. Martini. 2014. Engine exhaust solid sub-23 nm particles: II. Feasibility study for particle number measurement systems. SAE Int. J. Fuels Lubr. 7 (3):935–49. doi: 10.4271/2014-01-2832.
- Giechaskiel, B., L. Ntziachristos, Z. Samaras, R. Casati, V. Scheer, and R. Vogt. 2007. Effect of speed and speed-transition on the formation of nucleation mode particles from a light duty diesel vehicle. SAE Technical Paper 2007-01-1110.
- Hinds, W. C. 1999. Aerosol technology: properties, behavior, and measurement of airborne particles. 2nd ed. New York: John Wiley & Sons, Inc.
- Khalek, I. A. 2007. Sampling system for solid and volatile exhaust particle size, number, and mass emissions. SAE Technical Paper 2007-01-0307.
- Khalek, I. A., and T. Bougher. 2011. Development of a solid exhaust particle number measurement system using a catalytic stripper technology. SAE Technical Paper 2011-01-0635.
- Khalek, I. S., and D. B. Kittelson. 1995. Real time measurement of volatile and solid exhaust particles using a catalytic stripper. SAE Technical Paper 950236.
- Koidi, V. 2017. Design and development of a catalytic stripper. Thessaloniki: Aristotle University of Thessaloniki.
- Kylhammar, L., P. A. Carlsson, H. H. Ingelsten, H. Grönbeck, and M. Skoglundh. 2008. Regenerable ceria-based SOx traps for sulfur removal in lean exhausts. Appl. Catal. B: Environ. 84 (1–2):268–76. doi: 10.1016/j.apcatb.2008.04.003.
- Limousy, L., H. Mahzoul, J. F. Brilhac, P. Gilot, F. Garin, and G. Maire. 2003. SO2 sorption on fresh and aged SOx traps. Appl. Catal. B: Environ. 42 (3):237–49. doi: 10.1016/S0926-3373(02)00235-7.
- Mamakos, A., I. Khalek, R. Giannelli, and M. Spears. 2013. Characterization of combustion aerosol produced by a mini-CAST and treated in a catalytic stripper. Aerosol Sci. Technol. 47 (8):927–36. doi: 10.1080/02786826.2013.802762.
- Maricq, M. M. 2014. Examining the relationship between black carbon and soot in flames and engine exhaust. Aerosol Sci. Technol. 48 (6):620–29. doi: 10.1080/02786826.2014.904961.
- Martini, G., B. Giechaskiel, and P. Dilara. 2009. Future European emission standards for vehicles: the importance of the UN-ECE particle measurement programme. Biomarkers 14 (Sup1):29–33. doi: 10.1080/13547500902965393.
- Otsuki, Y., K. Takeda, K. Haruta, and N. Mori. 2014. A solid particle number measurement system including nanoparticles smaller than 23 nanometers. SAE Technical Paper 2014-01-1604.
- Polato, C. M. S., C. A. Henriques, A. A. Neto, and J. L. F. Monteiro. 2005. Synthesis, characterization and evaluation of CeO2/Mg,Al-mixed oxides as catalysts for SOx removal. J. Mol. Catal. A: Chem. 241 (1–2):184–93. doi: 10.1016/j.molcata.2005.07.006.
- Schreier, E., R. Eckelt, M. Richter, and R. Fricke. 2006. Sulphur trap materials based on mesoporous Al2O3. Appl. Catal. B: Environ. 65 (3–4):249–60. doi: 10.1016/j.apcatb.2006.02.004.
- Stenitzer, M. 2003. Nanoparticle formation in the exhaust of internal combustion engines. Wien: Technischen Universitat Wien.
- Swanson, J., and D. B. Kittelson. 2010. Evaluation of thermal denuder and catalytic stripper methods for solid particle measurements. J. Aerosol Sci. 41 (12):1113–22. doi: 10.1016/j.jaerosci.2010.09.003.
- Swanson, J., D. Kittelson, B. Giechaskiel, A. Bergmann, and M. Twigg. 2013. A miniature catalytic stripper for particles less than 23 nanometers. SAE Technical Paper 2013-01-1570.
- Yamada, H., K. Funato, and H. Sakurai. 2015. Application of the PMP methodology to the measurement of sub-23 nm solid particles: calibration procedures, experimental uncertainties, and DATA correction methods. J. Aerosol Sci. 88:58–71. doi: 10.1016/j.jaerosci.2015.06.002.
- Zarvalis, D., A. Zygogianni, S. Lorentzou, C. Severin, M. Schoenen, R. Vedder, M. Fiebig, J. Lavy, S. Zinola, and A. G. Konstandopoulos. 2011. Performance assessment of a multi-functional reactor under conventional and advanced combustion diesel engine exhaust conditions. SAE Technical Paper 2011-01-0606.
- Zheng, Z., K. C. Johnson, Z. Liu, T. D. Durbin, S. Hu, T. Huai, D. B. Kittelson, and H. S. Jung. 2011. Investigation of solid particle number measurement: existence and nature of sub-23 nm particles under PMP methodology. J. Aerosol Sci. 42 (12):883–97. doi: 10.1016/j.jaerosci.2011.08.003.