
Abstract
Single particle mass spectrometer (SPMS) instruments have been used for in-situ chemical characterization of atmospheric aerosols, both in the field and laboratory, for over two decades. SPMSs typically combine precise optical particle sizing with laser desorption and ionization followed by time of flight mass spectrometry. Among the advantages of SPMSs over other aerosol chemistry measurement techniques are their single particle resolution and high sensitivity to trace chemical species. The AeroMegt Laser Ablation Aerosol Particle Time of Flight Mass Spectrometer (LAAPToF) is a commercially available member of this instrument class, aiming for a compact size and simplicity for the end user. This article quantifies the performance of LAAPToF with an emphasis on optical counting efficiency. Recommendations for improving detection compared to the base LAAPToF hardware are described. Our results show that changes to the optical detection scheme can lead to over two orders of magnitude improvement in optical counting efficiency in the size range 500–2000 nm vacuum aerodynamic diameter. We also present mass spectral performance for characterizing atmospherically relevant particles in a comparison to a current SPMS design, the Particle Analysis by Laser Mass Spectrometry.
Copyright © 2020 American Association for Aerosol Research
EDITOR:
1. Introduction
Aerosols of both natural and anthropogenic origin have an effect on climate, atmospheric chemistry and human health (Boucher et al. Citation2013; George and Abbatt Citation2010; Miller et al. Citation2007). Aerosol concentration, size distributions and chemical composition need to be measured in order to better understand those effects. In contrast to bulk filter collections, single particle mass spectrometry measurements can differentiate internal and external mixtures and volatile and refractory components. Compared to mass spectrometry, bulk techniques also suffer from poor temporal resolution and can be affected by sampling artifacts, such as chemical reactions of the collected sample or losses due to evaporation (Sullivan and Prather Citation2005). Since the mid-1990s, mass spectrometric techniques have been instrumental in determining the chemical composition of atmospheric aerosols in-situ and with high temporal resolution. Such instruments are also able to probe small aerosol loadings (∼1 fg) with high sensitivity to trace elements, as well as both refractory and volatile components (Cziczo et al. Citation2013; Jimenez et al. Citation2009; Murphy, Thomson, and Mahoney Citation1998).
Commonly used mass spectrometric techniques differ primarily in the method of vaporization and ionization of aerosol particles. One class of instruments, such as the Aerodyne aerosol mass spectrometer (AMS), uses thermal vaporization via aerosol impaction on a resistively heated surface followed by electron impact ionization (DeCarlo et al. Citation2006; Jayne et al. Citation2000). Another, including PALMS, Aerosol Time-of-Flight Mass Spectrometer (ATOFMS) and LAAPToF, uses laser ablation and ionization (Cziczo et al. Citation2006; Pratt et al. Citation2009). This article focuses on the latter class of instruments, collectively termed Single Particle Mass Spectrometers (SPMSs). SPMS instruments have been covered in detail in several previous review papers (Coe and Allan Citation2006; Johnston Citation2000; Murphy Citation2007).
Most current SPMS instruments use an aerodynamic inlet to introduce aerosol particles into a differentially pumped low-pressure (∼10−5 Torr) region and to collimate the particles into a low-diverging particle beam of around 100 µm diameter (Cziczo et al. Citation2006; Pratt et al. Citation2009; Zelenyuk and Imre Citation2005). Particles are then detected via light scattering from a continuous wave (CW) laser. Using two continuous wave laser beams allows accurate determination of vacuum aerodynamic diameter of particles by measuring the particle transit time between them (Cziczo et al. Citation2006; Gard et al. Citation1997). The scattering events trigger the ablation/ionization laser(s). The particles undergo ablation and ionization, either simultaneously or as a two-step process (Morrical, Fergenson, and Prather Citation1998; Zelenyuk et al. Citation1999). Chemical composition is typically analyzed via time of flight mass spectrometry (Cziczo et al. Citation2006; Murphy Citation2007; Zelenyuk et al. Citation2009).
One important design constraint of SPMS instruments is the choice of the ablation/ionization laser. Pulsed UV lasers such as a 193 nm excimer or a 266 nm frequency-quadrupled Neodymium: Yttrium-Aluminum-Garnett (Nd:YAG) laser are commonly used because they can ionize most atmospherically relevant components (Thomson, Middlebrook, and Murphy Citation1997). When the ablation/ionization laser is triggered by a scattering event, an excimer laser can fire quickly with a delay on the order of a few hundred nanoseconds. A Nd:YAG laser requires more than 100 μs to produce a pulse, during which time the transiting particle has typically moved ∼10 cm. Nd:YAG-based instruments therefore require a trigger delay and a different spacing of internal components: the ablation/ionization region has to be physically removed from the optical detection region (Gard et al. Citation1997; Pratt et al. Citation2009; Su et al. Citation2004). Conversely, excimer-based instruments can have a more compact construction: the ablation/ionization laser beam can be positioned very close to the particle detection laser beam.
The majority of modern SPMS instruments are custom-built. Exceptions are the now-discontinued TSI Aerosol Time of Flight Mass Spectrometer (ATOFMS 3800 series) (Dall’Osto and Harrison Citation2006; Drewnick, Dall’Osto, and Harrison Citation2008), Single Particle Aerosol Mass Spectrometer (SPAMS) manufactured by the Hexin Company in China (Chen et al. Citation2016) and the topic of this article, the AeroMegt LAAPToF. Among the current SPMS designs are PALMS (Cziczo et al. Citation2006; Thomson, Schein, and Murphy Citation2000), ATOFMS (Gard et al. Citation1997; Pratt et al. Citation2009), the Aircraft-based Laser Ablation Aerosol Mass Spectrometer (ALABAMA) (Brands et al. Citation2011) and the mini-Single Particle Laser Ablation Time of Flight Mass Spectrometer (mini-SPLAT) (Zelenyuk and Imre Citation2005; Zelenyuk et al. Citation2009, Citation2015). All but LAAPToF rely on a large-area elliptical reflector to collect light scattered from a CW laser and transmit it into a photomultiplier tube (PMT) detector for particle detection. The LAAPToF instrument takes a different approach, using a fiber optic assembly, the details of which are described in the following sections, to extract scattered light. Generally, the optical counting efficiency of an SPMS is limited at smaller sizes by the low sensitivity of light collection to weak scatter signals and at the upper end to the inlet transmission efficiency of super-micron particles. Within this range, both optical detection and physical transmission efficiency are largely determined by the size of the CW laser spot compared to the width of the particle beam produced by the aerodynamic focusing lens.
ATOFMS and ALABAMA both use a 266 nm Nd:YAG ablation/ionization laser, necessitating the use of a trigger delay and a physical separation of the optical detection and the ion source region (Brands et al. Citation2011; Gard et al. Citation1997; Pratt et al. Citation2009; Su et al. Citation2004). On the other hand, the PALMS instrument uses a 193 nm excimer laser, allowing the instrument to be more compact due to the smaller trigger delay. Despite using a 193 nm excimer laser for ionization, the optical detection stages and the ion source region are physically separated in the SPLAT instrument, allowing for greater flexibility in design of the optical stages (Zelenyuk and Imre Citation2005; Zelenyuk et al. Citation2009, Citation2015) which is not possible for the compact source region on PALMS (Cziczo et al. Citation2006). The LAAPToF instrument design attempts to combine the compact source region of the PALMS design with a modern bipolar mass spectrometer. As discussed in subsequent sections, this comes at the price of optical counting efficiency as space for large-area elliptical reflectors is not permitted in this design.
Aspects of the LAAPToF instrument performance were recently assessed by two other groups (Gemayel et al. Citation2016; Marsden et al. Citation2016). In one case, the performance of the base commercial LAAPToF version is described (Gemayel et al. Citation2016). The other study reports on development of an improved particle detection scheme using a high-powered collimated laser (Marsden et al. Citation2016). This study also demonstrates modifications to the base LAAPToF hardware; however, it concentrates on improving the light detection efficiency.
This article aims to (1) assess the performance of LAAPToF by comparison to established SPMS designs, (2) discuss modifications that can be made to the existing hardware to increase the optical counting efficiency and (3) provide an initial comparison of LAAPToF mass spectra to those acquired by PALMS.
2. Experimental
2.1. Inlet and pumping scheme
LAAPTOF has been previously described, but an overview of the specific version of the instrument investigated here is given in this and following sections (Gemayel et al. Citation2016; Marsden et al. Citation2016). The instrument used in this work is LAAPToF serial number 001 and all descriptions are specific to this instrument version. A LAAPToF schematic is depicted in . It consists of four differentially pumped regions with a total length of 47 cm. The instrument functions at low pressure using a turbomolecular pump with four pumping stages (SplitFlow 270, Pfeiffer Vacuum, Asslar, Germany), backed by a 1.7 m3/h membrane pump (MD 1 VARIO-SP, Vacuubrand, Essex, CT, USA).
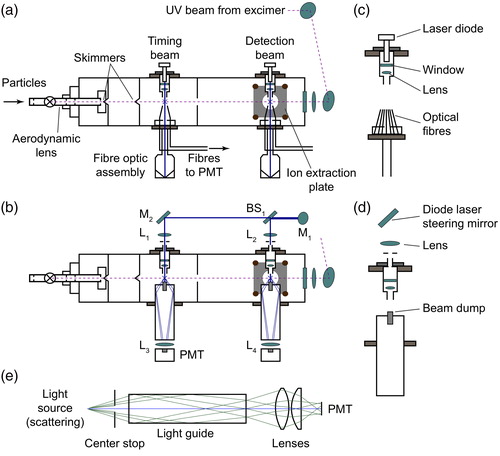
Figure 1. (a) Base LAAPToF configuration with light scattered by particles collected with fiber optics. Note that the mass spectrometer axes come in and out of the page in this orientation (the ion extraction plate is shown for clarity). (b) LAAPToF with enhanced light collection using light guides. Note that a signal at the detection beam is required to trigger the desorption and ionization laser. An additional signal at the timing beam is required for a determination of particle vacuum aerodynamic diameter. Optics are labeled in the schematic. M1—diode laser steering mirror; BS1—beam splitter; M2—steering mirror for the timing beam; L1 and L2—focusing lenses for the diode laser; L3 and L4—focusing lenses for scattered light. (c) Detail of the fiber ring used to collect the scattered light in the base instrument configuration. (d) Detail of the scattering regions with the light guide. (e) Ray trace of the light guide described in this article together with detail of lenses used to focus the scattered light onto the PMT. Ray trace prepared with the OSLO software (Lambda Research Corporation, Littleton, MA, USA).
The aerodynamic focusing lens is used to introduce particles into the vacuum region and collimate them into a beam. Two lenses have been used. The initial design uses the Aerodyne standard lens (Aerodyne Research, Inc., Billerica, MA, USA), described previously by Zhang et al. (Citation2002, Citation2004), with approximately unity transmission in the range 90–700 nm. However, an Aerodyne PM2.5 lens (Aerodyne Research, Inc.), described by Peck et al. (Citation2016) and Xu et al. (Citation2016) with approximate 50% transmission in the range 100–3000 nm, was used for all characterization work reported here. In both cases, a critical orifice, consisting of a steel plate with a bore of 100 μm diameter (Structure Probe, Inc., West Chester, PA, USA), restricts the flow to the instrument to 0.1 standard liter per minute (slpm) and thereby reduces the pressure in front of the aerodynamic focusing lens. Pressure between the critical orifice and the lens is measured with a compact Pirani gauge (TPR 280, Pfeiffer Vacuum, Asslar, Germany).
2.2. Optical detection of particles
The original optical detection stages of LAAPToF have undergone significant changes as a part of this work. The original LAAPToF design used 405 nm laser diodes of unknown specifications mounted on a threaded copper tube that was directly attached to the top of the instrument and coupled to the vacuum through plain glass windows. The laser beams then passed through a fixed lens that focused them to a spot of ∼50 µm diameter at the particle beam location in the flight tube. The alignment of the diode lasers was achieved by manual tilt, i.e., without use of standard optical mounts, restricting the accuracy and repeatability of alignment with the particle beam. Below the particle beam, a ring of 12 optical fibers collected the scattered light at ∼15° with respect to direct forward scattering. The optical fibers exited the vacuum and were coupled to PMTs (H10722-110, Hamamatsu, Hamamatsu, Japan), where two PMTs were used to read the signals from six fibers each.
The modifications performed to LAAPToF were (1) adding a laser with better beam quality, (2) using optical mounts for directing the beam into the chamber for easier and more reproducible alignment, and (3) increasing the amount of scattered light collected using light guides. The modifications to the optical path are shown in . Not shown is the laser, a 100 mW, 405 nm diode with a heat sink, fan, and USB-interfaced controller (OBIS, Coherent, Santa Clara, CA, USA). The OBIS beam is collimated to ∼1 mm at the laser exit with <1 mrad full angle divergence. The OBIS laser couples to the vacuum chamber through a series of mirrors mounted on optical kinematic mounts as shown in : the beam exits the laser, couples onto mirror 1 (M1), which is mounted on a micrometer stage providing movement in the y-direction. The beam is then split by a 50:50 beam splitter (BS1) (Thorlabs, Newton, NJ, USA) into two beams that couple into the scattering ports via antireflective-coated glass windows to reduce reflection losses. The beams are focused at the particle beam with 120 mm plano-convex lenses (Thorlabs) to a diameter of ∼100 µm. BS1 and M2 are mounted on kinematic mounts, providing control over spot position inside the chamber and enhancing the rigidity of the optical path.
Throughout the measurements reported in this article, the total OBIS laser power used was 60 mW. This power level was found to reduce the stray light background, while maintaining acceptable optical counting efficiency. And additional benefit to not using the full laser power is preserving the lifetime of windows though the laser beams propagate, which can be become discolored over time. During operation, the DC background is filtered out by a simple high-pass filter. Particle signals are differentiated from any high frequency noise using trigger thresholds in the 1 - 3 mV range, adjusted daily.
Optical counting efficiency measurements are reported as percentage of particles detected at a PMT compared to the number of particles transmitted to the inlet, as measured by an optical particle sizer (OPS) (OPS 3330, TSI, Shoreview, MN, USA) or a condensation particle counter (CPC) (Brechtel, Hayward, CA, USA). Particles used for the optical counting efficiency tests were Polystyrene Latex Spheres (PSL) (Polysciences, Inc. Warrington, PA) of known size that were wet-generated with an atomizer (Aerosol Generator 3076, TSI) and dried with a custom built diffusion dryer. Monodisperse number concentrations on the order of 100 cm−3 were used to investigate the optical counting efficiency, which is comparable to ambient concentrations of 200 nm – 2.5 µm particles (Stanier, Khlystov, and Pandis Citation2004). For other optical counting efficiency tests the atomizer, followed by the diffusion dryer, was used to generate polydisperse ammonium sulfate aerosol. For both PSL and ammonium sulfate tests, the dry aerosol was size-selected using a differential mobility analyzer (DMA) (Brechtel).
2.3. Ionization and analysis
The LAAPToF instrument differs in geometry of particle ionization from the previously discussed SPMSs. As shown in , the ablation/ionization laser beam counter-propagates with respect to the particle beam. Such an orientation has been used previously where the laser was ‘free fired’ to strike particles that happened to be within the ionization region (Carson, Johnston, and Wexler Citation1997; Phares, Rhoads, and Wexler Citation2002; Reents et al. Citation2007).
LAAPToF uses an ArF 193 nm excimer laser (EX5, GAM Laser, Inc., Orlando, FL, USA), producing 6–8 ns pulses at a frequency of up to 250 Hz with maximum energy of 12 mJ. Because of its geometry, it does not use a trigger delay; the excimer laser is fired immediately after the detection PMT detects scattered light. The excimer laser couples into the flight tube through a lens (L5) and an uncoated fused silica window. Because the particle beam ultimately impacts the rear window, it must be cleaned or changed periodically. The window lifetime is dependent on typical concentrations and types of particles sampled with the instrument. The results reported in this article used excimer powers between 1 and 5 mJ, comparable to those used with PALMS, enabling a comparison of the reference spectra discussed in the next sections. The excimer laser is focused into the ionization region but no further beam shaping is performed to maintain a homogeneous profile. The laser irradiance inside the ionization region is therefore unknown and cannot be easily estimated because of the non-Gaussian character of the beam profile. The alignment of the excimer laser is achieved empirically by adjusting the L5 lens position to maximize the ionization rate of particles.
The mass spectrometer is a commercial bipolar time-of-flight mass analyzer, designed by ToFWerk (Thun, Switzerland), with two reflectrons in a “B-ToF” configuration (Gemayel et al. Citation2016). The ion source region is situated in the space between two metal plates, ∼6 mm across. This dimension restricts the size of the beam dump that can be used with the light guides. The metal plates closest to the ion source region (shown as gray shaded areas in for reference) are grounded, creating a ‘field-free’ ion source region for a delayed ion extraction (Vera et al. Citation2005).
3. Results and discussion
3.1. Optical counting efficiency
In the original LAAPToF design, the 12-member optical fiber ring collected only a minor fraction of the solid angle of light scattered from each aerosol particle. In order to be able to detect smaller particles, the amount of scattered light ultimately detected by the PMTs needed to be enhanced. This was achieved by implementing a light guide to maximize the scattered light collected. The usage of a glass light guide, as shown in , allows extraction of the maximum possible solid angle (35°, not accounting for the beam dump) of scattered light from the existing scattering port. The glass light guides used here have a central 3 mm diameter beam dump machined out of anodized aluminum to block the direct laser beam. The glass light guide is a custom built optic (Rocky Mountain Instrument Co, Lafayette, CO, USA), machined out of N-BK7 glass with a diameter of 17.8 mm and a length of about 76 mm. Its geometry is such that a scattered light ray undergoes exactly one internal reflection inside the light guide. A ray trace of the light guides implemented here is shown in . Two lenses, a biconvex lens with a focal length of f = 25.4 mm (Thorlabs, Newton, NJ; L3 in ) and a plano-convex lens with f = 40.0 mm (Thorlabs, L4) focus the light exiting the light guide onto the 8 mm diameter active surface area of the PMT. The light guides are housed inside a threaded tube to minimize light from external sources. A black-anodized aluminum positioning ring is epoxied (TS10, Thorlabs) to the light guide and, together with an o-ring, provides the vacuum seal to the chamber.
The difference in performance between the base optical detection system and the new laser and light guide combination is shown in . The optical counting efficiency for both the timing () and detection ports () are given for the two configurations using different test particles and sizes. In all cases, the OBIS laser, not the original diodes, was used. When the original instrument configuration with directly coupled diodes was tested, no particles were detected at the number concentrations used in the experiments. Furthermore, there were spontaneous overheating failures with the original diodes that could not be overcome. The base case data presented here are therefore expected to be superior to the original design using diode lasers. For both the timing and detection signals, an improvement in efficiency between two and three orders of magnitude resulted from switching from optical fibers to light guides. With the light guides, LAAPToF can detect particles larger than 500 nm with better than 1% efficiency at the detection laser and ∼10% at the upstream timing laser. The instrument reliably detects particles larger than 250 nm at near-ambient concentrations. There is an order of magnitude decrease in optical counting efficiency between the two optical stages. This is due to a large separation between them, which is larger than in most other SPMS designs (). We note that the optical counting efficiency at the first optical stage is not a useful quantity in demonstrating overall instrument performance, but it is shown here to demonstrate large particle losses in the instrument.
Figure 2. Optical counting efficiency versus particle size using the original fiber optics and the light guide modification described in this work. Size selected PSLs, ammonium sulfate (AS) and sodium chloride particles were used. (a) Optical counting efficiency at the detection beam. (b) Optical counting efficiency at the timing beam. Best fit lines are shown to guide the eye. (c) Multiple measurements were taken at different times and different laser alignments to illustrate the sensitivity of the system to laser focus alignment above the light guide beam dump. Each color represents a different laser alignment.
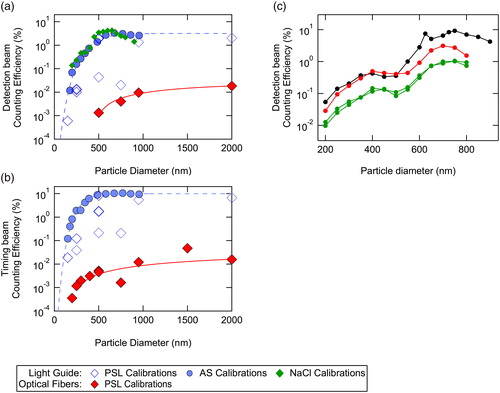
Table 1. Comparison of particle light scattering optical design choices and performance metrics of four existing SPMSs and LAAPToF.
The geometry of the LAAPToF instrument results in challenging alignment of the optical components. The laser foci have to be incident above the light guide beam dumps in such a way as to minimize the stray light. Small changes to this alignment can result in large changes to optical counting efficiency. This is illustrated in , which presents several calibrations with ammonium sulfate particles and PSLs at different optical alignments. Maximum optical detection efficiencies at the detection beam can vary as much as an order of magnitude for different alignments. This is shows by the scatter in the PSL measurements, in particular. also shows two measurements taken on consecutive days for the same alignment (the green trace), which are reproducible (<10% difference for all sizes). After a successful laser alignment, the system generally stays aligned for multiple (1–5) days, unless the instrument is moved. However, the instrument optical performance should be re-characterized every time a new alignment is made. We note that the need for precise alignment of optical components is not unique to LAAPToF, but the more established instruments deal with this difficulty more robustly. The PALMS instrument implements as automatic laser alignment procedure that can be carried out quickly in the field using a laser profiler integrated into the vacuum region and motorized mirror mounts (Cziczo et al. Citation2006; Thomson, Schein, and Murphy Citation2000). Decreasing the amount of stray light inside the instrument should decrease the alignment sensitivity, while improving the overall optical counting efficiency. It is feasible that a ring of optical fibers is less sensitive to background optical noise. The alignment difficulties are however also present in the original design, as can be seen from the scatter in PSL measurements in .
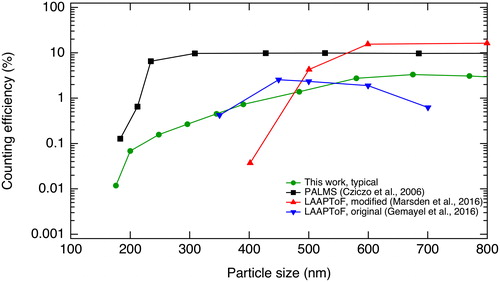
shows a direct comparison between a typical optical counting efficiency described in this article and other versions of LAAPToF described in Marsden et al. (Citation2016) and Gemayel et al. (Citation2016), as well as the PALMS instrument described in Cziczo et al. (Citation2006). The PALMS instrument, which uses elliptical reflectors, shows a 10% flat optical counting efficiency from 200 nm to 1 μm. Note that the 10% maximum is a consequence of the laser focus size relative to the dimeter of the particle beam. The modification of LAAPToF described in Marsden et al. (Citation2016) shows a similar performance at 600 nm to 800 nm, but the efficiency sharply falls at <500 nm. In contrast, the system described in this work shows higher optical counting efficiency at small sizes. At 400 nm, the efficiency of the Marsden et al. (Citation2016) system is <0.1%, but the light guide system described here is still close to 1%. Note that the unmodified LAAPToF described in Gemayel et al. (Citation2016) is at odds with the performance of unmodified LAAPToF reported in this work, but also with the unmodified performance described in Marsden et al. (Citation2016). We can only conclude that large discrepancies in performance exist between different versions of the unit and the performance described in this article is specific to the serial number 001 LAAPToF.
Figure 3. A comparison between a typical optical counting efficiency of the modified LAAPToF described in this article, modified LAAPToF described in Marsden et al. (Citation2016), unmodified LAAPToF described in Gemayel et al. (Citation2016), and the PALMS instrument described in Cziczo et al. (Citation2006).
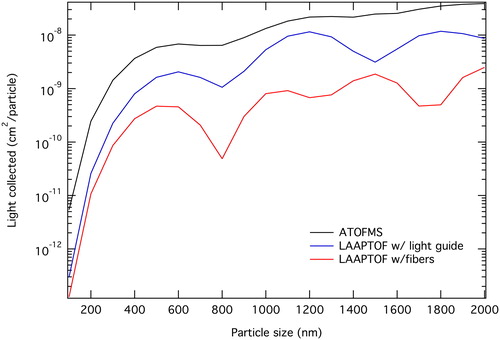
As illustrates, the LAAPToF optical system does not tend to perform as well as the standard elliptical reflector designs common to other SPMS instruments. Direct comparisons between different instruments are complicated by different laser powers and spot sizes. A comparison of the theoretical performance between the various optical detection devices is shown in . The amount of light collected per spherical particle is presented for different light collection geometries based on numerically integrating the Mie scattering curve for different effective apertures. The ATOFMS curve was constructed following the treatment in Moffet and Prather (Citation2005). The curve for LAAPToF with light guides was constructed following the treatment in Hodkinson and Greenfield (Citation1965) for forward scattering, parallel illumination, along the axis and based on the physical dimensions of the light guides implemented for this work. The curve for the original LAAPToF design was constructed in the same manner except the fibers were treated as a continuous ring, instead of discrete points, for simplicity (i.e., this overestimates the solid angle of light collection by a factor of ∼2–3). Accounting for the central beam stop, the light guide covers a ∼30° solid angle. The hypothetical continuous fiber “ring” covers an ∼8° solid angle, for comparison. Additionally, the available surface area for light collection in the light guide is 238 mm2, but for the 12-member fiber ring, it is approximately 10 mm2. The figure therefore represents a theoretical limit that can be achieved with the light guides and an upper limit for the fiber design due to the assumed simplified geometry.
Figure 4. Modeled scattered light collection for ATOFMS and two detector configurations of LAAPToF (Moffet and Prather Citation2005; Hodkinson and Greenfield Citation1965). Fibers denote the standard LAAPToF geometry and light guides are the improvement described in this work. The resonances are a consequence of Mie theory.
A trend of increasing optical counting efficiency with increasing spot size of the detection laser is apparent in . This is because a larger laser beam cuts through a larger fraction of the particle beam. Increasing the detection beam spot size for LAAPToF did not follow this trend, however, due to the resulting increase in the amount of stray light. The SPLAT II design uses both a large spot size and high laser power because stray light has been minimized by baffling and black anodization of the optical region (Zelenyuk and Imre Citation2005). This represents a possible modification that could yield further improved detection efficiency in LAAPToF. also illustrates another issue with the LAAPToF design that may also lend to future modification: the total length of the instrument (i.e., the beam spacing). While LAAPToF is similar to SPLAT II, the latter has a much larger detection beam spot size to compensate for particle beam divergence. Hence, another possible future modification to improve LAAPToF performance is to shorten the instrument to decrease particle beam divergence.
3.2. Mass spectrometer performance
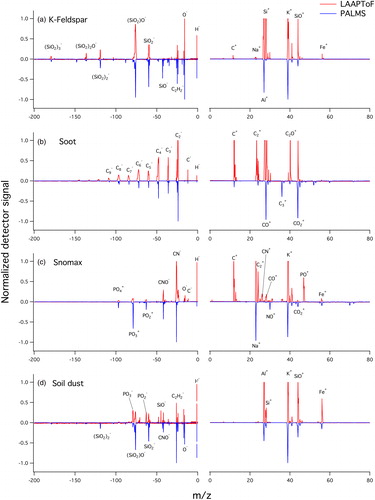
In order to test the mass spectral performance of LAAPToF, atmospherically relevant aerosol types were sampled and compared with spectra obtained by other SPMSs. shows single-particle spectra taken with LAAPToF and PALMS for (a) Potassium rich feldspar (K-Feldspar), (b) elemental carbon, (c) Snomax, a desiccated and ground bacterium and (d) an Argentinian soil dust. The aerosol particles were sampled at the Karlsruhe Institute of Technology Aerosol Interactions and Dynamics in the Atmosphere (AIDA) facility during the Fifth Ice Nucleation Workshop (FIN-01). K-Feldspar and soil dust samples were dry-dispersed, the elemental carbon was produced by a CAST burner and the Snomax was wet-generated with an atomizer and dried with a diffusion dryer.
Figure 5. LAAPToF to PALMS spectral comparison. The signal of the largest peak in each spectrum is normalized for comparison.
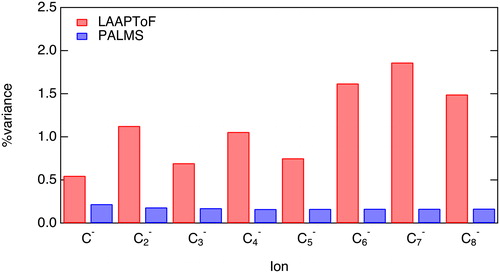
Mentioned previously, the LAAPToF excimer beam counter-propagates relative to the particle beam. This orientation runs the risk of ionizing multiple particles coincident in the ion source region when the laser is fired. Counter–propagation also results in an increase to the volume in which particles can be ionized, leading to lower certainty of the source of ions. Even when only a single particle is ablated and ionized, the latter effect reduces the reproducibility of the measured flight times of the ions due to different initial ion formation locations. The exact dimensions of the effective ionization region are complicated because excimer lasers are not Gaussian and their power distribution at the focus can be unpredictable. This effect was quantified with elemental carbon particles where the arrival time of the carbon cluster ions (12Cn−, where n = integer) peaks could be determined from the ToF in the mass spectrometer. A 0.5–2% variance in the ToF was observed for 135 particles (). This corresponds to up to 4% variance in the resulting m/z. In , PALMS ToF variances calculated using 147 of the same CAST soot particles are plotted for comparison. ToF variances in the LAAPToF instrument can be up to ten times higher. This will primarily affect the mass calibration, resulting in an instrument that needs to be calibrated more frequently and a greater need for mass calibration adjustments in data processing.
Figure 6. A comparison of percent variance in time of flight for main elemental carbon ions for PALMS and LAAPToF. ∼100 negative mass spectra of CAST soot collected at the AIDA facility were used for both instruments.
PALMS and LAAPToF both use a 193 nm excimer laser for ablation/ionization and the extracted ions are therefore expected to be similar. PALMS excimer power density at the focus is ∼9 × 10⁸ W/cm2. Because the LAAPToF excimer beam profile is non-Gaussian and because of the lack of a laser profiler in LAAPToF, the spot size after the lens cannot be reliably calculated or measured, resulting in an uncertain laser power density at the focus. In , the LAAPToF mass scales were offset to match the PALMS scales. The LAAPToF spectra show saturation of peaks for the most abundant ions (e.g., Al+, K+, Na+), an effect not observed for PALMS spectra due to use of a logarithmic amplifier which extends the dynamic range of the instrument (Thomson, Schein, and Murphy Citation2000). Similar saturation of peaks is also discussed in Marsden et al. (Citation2018) for a different version of LAAPToF. Spectra of soot and Snomax show a high abundance of the elemental carbon ion (12Cn+) for LAAPToF but not for PALMS. More fragmentation of organics, leading to a very high 12nCn+ ion signal, suggests a higher effective power density for LAAPToF than for PALMS. LAAPToF spectra also show a higher relative PO+ ion signal for Snomax. In general, LAAPToF peaks exhibit broadening with increasing mass. This can be observed most clearly in the negative soot spectrum in . The origin of this broadening is most likely the large ion source area due to the excimer laser counter-propagation.
4. Conclusions
The performance of LAAPToF, one of the few currently available commercial SPMS instruments, has been evaluated. The optical particle detection stages were redesigned to detect more scattered light, resulting in an improvement of 2–3 orders of magnitude in optical counting efficiency of incident particles. We suggest that particle detection could be further improved by reducing the stray light inside the instrument by using a better beam dump and/or by anodization of the instrument components to attenuate internal reflections. The modifications described here allow for sizing and acquisition of mass spectra for 1–10% of particles larger than ∼500 nm vacuum aerodynamic diameter.
LAAPToF has fundamental detection limitations due to its geometry. The collected scattered light is limited by the size of the ports that house the original fiber optics and, due to space limitations, cannot achieve the performance of the elliptical reflectors used on most SPMSs. When compared to an existing SPMS, LAAPToF spectra exhibit more variability in ion ToF and peak width. This is in part due to counter-propagation of the excimer beam, but a more well-defined beam (i.e., with the addition of beam shaping optics) should increase the particle ionization rate and make spectra more reproducible without affecting the mass scale uncertainty associated with the counter-propagating geometry.
With only the modifications described in this article, which are easy to implement and do not require a large-scale redesign, the LAAPToF instrument is ambient-capable for particles larger than 250 nm. This should enable it to successfully characterize PM1.0 and PM2.5 in locations where such particles are abundant, for example urban areas.
Acknowledgments
The authors would like to thank the KIT AIDA facility staff for hosting the FIN01 workshop and Leah Williams for helpful comments on this article
Additional information
Funding
References
- Boucher, O., D. Randall, P. Artaxo, C. Bretherton, G. Feingold, P. Forster, V.-M. Keminen, Y. Kondo, H. Liao, U. Lohmann, et al. 2013. Clouds and aerosols in: Climate change 2013: The physical science basis. In Contribution of Working Group I to the Fifth Assessment Report of the Intergovernmental Panel on Climate Change, eds. T. F. Stocker, D. Qin, G.-K. Plattner, M. Tignor, S. K. Allen, J. Boschung, A. Nauels, Y. Xia, V. Bex, P. M. Midgley Cambridge University Press, Cambridge, United Kingdom and New York, NY, USA.
- Brands, M., M. Kamphus, T. Böttger, J. Schneider, F. Drewnick, A. Roth, J. Curtius, C. Voigt, A. Borbon, M. Beekmann, et al. 2011. Characterization of a newly developed aircraft-based laser ablation aerosol mass spectrometer (ALABAMA) and first field deployment in urban pollution plumes over Paris during Megapoli 2009. Aerosol Sci. Technol. 45 (1):46–64. doi:10.1080/02786826.2010.517813.
- Carson, P. G., M. V. Johnston, and A. S. Wexler. 1997. Real-time monitoring of the surface and total composition of aerosol particles. Aerosol Sci. Technol. 26 (4):291–300. doi:10.1080/02786829708965431.
- Chen, Y., J. Cao, R. Huang, F. Yang, Q. Wang, and Y. Wang. 2016. Characterization, mixing state, and evolution of urban single particles in Xi’an (China) during wintertime haze days. Sci. Total Environ. 573:937–45. doi:10.1016/j.scitotenv.2016.08.151.
- Coe, H., and J. D. Allan. 2006. Mass spectrometric methods for aerosol composition measurements. In Analytical techniques for atmospheric measurement, ed. D. E. Heard. Hoboken, NJ: Blackwell Publishing.
- Cziczo, D. J., K. D. Froyd, C. Hoose, E. J. Jensen, M. Diao, M. A. Zondlo, J. B. Smith, C. H. Twohy, and D. M. Murphy. 2013. Clarifying the dominant sources and mechanisms of cirrus cloud formation. Science 340 (6138):1320–24. doi:10.1126/science.1234145.
- Cziczo, D. J., D. S. Thomson, T. L. Thompson, P. J. DeMott, and D. M. Murphy. 2006. Particle analysis by laser mass spectrometry (PALMS) studies of ice nuclei and other low number density particles. Int. J. Mass Spectrom. 258 (1-3):21–29. doi:10.1016/j.ijms.2006.05.013.
- Dall’Osto, M., and R. Harrison. 2006. Chemical characterisation of single airborne particles in Athens (Greece) by ATOFMS. Atmos. Environ. 40:7614–31. doi:10.1016/j.atmosenv.2006.06.053.
- DeCarlo, P. F., J. R. Kimmel, A. Trimborn, M. J. Northway, J. T. Jayne, A. C. Aiken, M. Gonin, K. Fuhrer, T. Horvath, K. S. Docherty, et al. 2006. Field-deployable, high-resolution, time-of-flight aerosol mass spectrometer. Anal. Chem. 78 (24):8281–89. doi:10.1021/ac061249n.
- Drewnick, F., M. Dall’Osto, and R. Harrison. 2008. Characterization of aerosol particles from grass mowing by joint deployment of ToF-AMS and ATOFMS instruments. Atmos. Environ. 42 (13):3006–17. doi:10.1016/j.atmosenv.2007.12.047.
- Gard, E., J. E. Mayer, B. D. Morrical, T. Dienes, D. P. Fergenson, and K. A. Prather. 1997. Real-time analysis of individual atmospheric aerosol particles: Design and performance of a portable ATOFMS. Anal. Chem. 69 (20):4083–91. doi:10.1021/ac970540n.
- Gemayel, R., S. Hellebust, B. Temime-Roussel, N. Hayeck, J. T. Van Elteren, H. Wortham, and S. Gligorovski. 2016. The performance and the characterization of laser ablation aerosol particle time-of-flight mass spectrometry (LAAP-ToF-MS). Atmos. Meas. Tech. 9 (4):1947–59. doi:10.5194/amt-9-1947-2016.
- George, I. J., and J. P. Abbatt. 2010. Heterogeneous oxidation of atmospheric aerosol particles by gas-phase radicals. Nat. Chem. 2 (9):713–22. doi:10.1038/nchem.806.
- Hodkinson, J. R., and J. R. Greenfield. 1965. Response calculations for light-scattering aerosol counters and photometers. Appl. Opt. 4 (11):1463. doi:10.1364/AO.4.001463.
- Jayne, J. T., D. C. Leard, X. Zhang, P. Davidovits, K. A. Smith, C. E. Kolb, and D. R. Worsnop. 2000. Development of an aerosol mass spectrometer for size and composition analysis of submicron particles. Aerosol Sci. Technol. 33 (1-2):49–70. doi:10.1080/027868200410840.
- Jimenez, J. L., M. R. Canagaratna, N. M. Donahue, A. S. H. Prevot, Q. Zhang, J. H. Kroll, P. F. DeCarlo, J. D. Allan, H. Coe, N. L. Ng, et al. 2009. Evolution of organic aerosols in the atmosphere. Science 326 (5959):1525–29. doi:10.1126/science.1180353.
- Johnston, M. V. 2000. Sampling and analysis of individual particles by aerosol mass spectrometry. J. Mass Spectrom. 35 (5):585–95. doi:10.1002/(sici)1096-9888(200005)35:5 < 585::Aid-jms992 > 3.0.Co;2-k.
- Marsden, N. A., M. J. Flynn, J. D. Allan, and H. Coe. 2018. Online differentiation of mineral phase in aerosol particles by ion formation mechanism using a LAAP-ToF single-particle mass spectrometer. Atmos. Meas. Tech. 11 (1):195–213. doi:10.5194/amt-11-195-2018.
- Marsden, N., M. J. Flynn, J. W. Taylor, J. D. Allan, and H. Coe. 2016. Evaluating the influence of laser wavelength and detection stage geometry on optical detection efficiency in a single-particle mass spectrometer. Atmos. Meas. Tech. 9 (12):6051–68. doi:10.5194/amt-9-6051-2016.
- Miller, K. A., D. S. Siscovick, L. Sheppard, K. Shepherd, J. H. Sullivan, G. L. Anderson, and J. D. Kaufman. 2007. Long-term exposure to air pollution and incidence of cardiovascular events in women. N Engl. J. Med. 356 (5):447–58. doi:10.1056/NEJMoa054409.
- Moffet, R. C., and K. A. Prather. 2005. Extending ATOFMS measurements to include refractive index and density. Anal. Chem. 77 (20):6535–41. doi:10.1021/ac0503097.
- Morrical, B. D., D. P. Fergenson, and K. A. Prather. 1998. Coupling two-step laser desorption/ionization with aerosol time-of-flight mass spectrometry for the analysis of individual organic particles. J. Am. Soc. Mass Spectrom. 9 (10):1068–73. doi:10.1016/S1044-0305(98)00074-9.
- Murphy, D. M. 2007. The design of single particle laser mass spectrometers. Mass Spectrom. Rev. 26 (2):150–65. doi:10.1002/mas.20113.
- Murphy, D. M., D. S. Thomson, and M. J. Mahoney. 1998. In situ measurements of organics, meteoritic material, mercury, and other elements in aerosols at 5 to 19 kilometers. Science 282:1664–69. doi:10.1126/science.282.5394.1664.
- Peck, J., L. A. Gonzalez, L. R. Williams, W. Xu, P. L. Croteau, M. T. Timko, J. T. Jayne, D. R. Worsnop, R. C. Miake-Lye, and K. A. Smith. 2016. Development of an aerosol mass spectrometer lens system for pm2.5. Aerosol Sci. Technol. 50 (8):781–89. doi:10.1080/02786826.2016.1190444.
- Phares, D. J., K. P. Rhoads, and A. S. Wexler. 2002. Performance of a single ultrafine particle mass spectrometer. Aerosol Sci. Technol. 36 (5):583–92. doi:10.1080/02786820252883829.
- Pratt, K. A., J. E. Mayer, J. C. Holecek, R. C. Moffet, R. O. Sanchez, T. P. Rebotier, H. Furutani, M. Gonin, K. Fuhrer, Y. Su, et al. 2009. Development and characterization of an aircraft aerosol time-of-flight mass spectrometer. Anal. Chem. 81 (5):1792–800. doi:10.1021/ac801942r.
- Reents, W. D., S. W. Downey, A. B. Emerson, A. M. Mujsce, A. J. Muller, D. J. Siconolfi, J. D. Sinclair, and A. G. Swanson. 2007. Single particle characterization by time-of-flight mass spectrometry. Aerosol Sci. Technol. 23 (3):263–70. doi:10.1080/02786829508965311.
- Stanier, C. O., A. Y. Khlystov, and S. N. Pandis. 2004. Ambient aerosol size distributions and number concentrations measured during the Pittsburgh air quality study (PAQS). Atmos. Environ. 38 (20):3275–84. doi:10.1016/j.atmosenv.2004.03.020.
- Su, Y., M. F. Sipin, H. Furutani, and K. A. Prather. 2004. Development and characterization of an aerosol time-of-flight mass spectrometer with increased detection efficiency. Anal. Chem. 76 (3):712–19. doi:10.1021/ac034797z.
- Sullivan, R. C., and K. A. Prather. 2005. Recent advances in our understanding of atmospheric chemistry and climate made possible by on-line aerosol analysis instrumentation. Anal. Chem. 77 (12):3861–85. doi:10.1021/ac050716i.
- Thomson, D. S., A. M. Middlebrook, and D. M. Murphy. 1997. Thresholds for laser-induced ion formation from aerosols in a vacuum using ultraviolet and vacuum-ultraviolet laser wavelengths. Aerosol Sci. Technol. 26 (6):544–59. doi:10.1080/02786829708965452.
- Thomson, D. S., M. E. Schein, and D. M. Murphy. 2000. Particle analysis by laser mass spectrometry wb-57f instrument overview. Aerosol Sci. Technol. 33 (1-2):153–69. doi:10.1080/027868200410903.
- Vera, C. C., A. Trimborn, K.-P. Hinz, and B. Spengler. 2005. Initial velocity distributions of ions generated by in-flight laser desorption/ionization of individual polystyrene latex microparticles as studied by the delayed ion extraction method. Rapid Commun. Mass Spectrom. 19 (2):133–46. doi:10.1002/rcm.1753.
- Xu, W., P. Croteau, L. Williams, M. Canagaratna, T. Onasch, E. Cross, X. Zhang, W. Robinson, D. Worsnop, and J. Jayne. 2016. Laboratory characterization of an aerosol chemical speciation monitor with pm2.5 measurement capability. Aerosol Sci. Technol. 51 (1):69–83. doi:10.1080/02786826.2016.1241859.
- Zelenyuk, A., J. Cabalo, T. Baer, and R. E. Miller. 1999. Mass spectrometry of liquid aniline aerosol particles by IR/UV laser irradiation. Anal. Chem. 71 (9):1802–08. doi:10.1021/ac980971l.
- Zelenyuk, A., and D. Imre. 2005. Single particle laser ablation time-of-flight mass spectrometer: An introduction to splat. Aerosol Sci. Technol. 39 (6):554–68. doi:10.1080/027868291009242.
- Zelenyuk, A., D. Imre, J. Wilson, Z. Zhang, J. Wang, and K. Mueller. 2015. Airborne single particle mass spectrometers (splat II & minisplat) and new software for data visualization and analysis in a geo-spatial context. J. Am. Soc. Mass Spectrom. 26:257–70. doi:10.1007/s13361-014-1043-4.
- Zelenyuk, A., J. Yang, E. Choi, and D. Imre. 2009. Splat II: An aircraft compatible, ultra-sensitive, high precision instrument for in-situ characterization of the size and composition of fine and ultrafine particles. Aerosol Sci. Technol. 43 (5):411–24. doi:10.1080/02786820802709243.
- Zhang, X., K. A. Smith, D. R. Worsnop, J. Jimenez, J. T. Jayne, and C. E. Kolb. 2002. A numerical characterization of particle beam collimation by an aerodynamic lens-nozzle system: Part I. An individual lens or nozzle. Aerosol Sci. Technol. 36 (5):617–31. doi:10.1080/02786820252883856.
- Zhang, X., K. A. Smith, D. R. Worsnop, J. L. Jimenez, J. T. Jayne, C. E. Kolb, J. Morris, and P. Davidovits. 2004. Numerical characterization of particle beam collimation: Part ii integrated aerodynamic-lens–nozzle system. Aerosol Sci. Technol. 38 (6):619–38. doi:10.1080/02786820490479833.