
 ?Mathematical formulae have been encoded as MathML and are displayed in this HTML version using MathJax in order to improve their display. Uncheck the box to turn MathJax off. This feature requires Javascript. Click on a formula to zoom.
Abstract
Cell exposure experiments at the air-liquid interface (ALI) are used increasingly as indicators for health effects and for the impact of aerosols on the lung. Thereby the aerosol particles are kept airborne and can deposit on a cell surface area similar to the human respiratory tract (RT). However, geometry and air flow rates of an ALI system deviate considerably from the RT. As the tissue-delivered particle dose to the lungs (TD) can hardly be measured, computer models of particle deposition are used here to mimic both the particle deposition at ALI and in the RT. An ALI exposure setup (VitroCell GmbH) for an airflow rate of 100 cm3 min−1 is selected, where the particle deposition model has been verified experimentally. For the RT we use the hygroscopic lung deposition model of Ferron et al. (Citation2013). Model runs are performed for the particle deposition and for the deposited particles per surface area in both the ALI and the RT. The results show that the ALI-deposited mass is 1-2 orders of magnitude higher than in the alveolar region, because the surface area of the lung region is substantially larger. A particle size range from 40 to 450 nm is identified, where the ratio of both the deposition in a lung region and the deposition at the ALI varies by a factor less than two. Mean values for this ratio are 31 and 101 for the tracheo-bronchial and the alveolar region, respectively. The same size range is found for the ratio of the deposited particles per surface area in a lung region and at the ALI. For this range the mean surface deposition at the ALI is 23- and 1575-times larger than in the tracheo-bronchial and the alveolar lung region, respectively. The effect is partly compensated by different flow rate and cell size.
Copyright © 2020 American Association for Aerosol Research
EDITOR:
Introduction
Particle exposure of cell culture tissue at the air-liquid interface (ALI) is frequently used to assess toxicological endpoints and can be considered as an indicator for adverse health effects (Upadhyay and Palmberg Citation2018). The benefits of cell exposures at the ALI include reproducibility, physiological relevance in respiratory research and short-term or acute to mid-term exposures. Additionally, cellular parameters like genomics, proteomics and metabolomics are available for more in-depth molecular-toxicological and mechanistic studies. Thereby, the comparability of an ALI experiment with human exposure is an important question. A parameter to compare both is the mass or number of particles deposited on a cell surface area. It can be modeled by computer for both ALI and human respiratory tract (RT). The outcome is of interest for pre-experimental considerations as well as for the evaluation of experimental data. The amount of particles available for particle-cell interaction is the driving parameter behind all biological results.
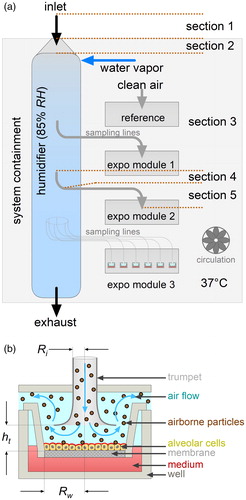
The ALI exposure technique ( and ) has been developed in the recent years (Tippe, Heinzmann, and Roth Citation2002; Aufderheide and Mohr Citation2004; Bitterle et al. Citation2006; Mülhopt, Krebs, and Paur Citation2008; Savi et al. Citation2008; Paur et al. Citation2011; Aufderheide et al. Citation2013). A confluent monolayer of epithelial cells on a semipermeable membrane is exposed at 37 °C and 85% relative humidity (Mülhopt et al. Citation2016). Thereby the cells are in contact with the aerosol from the apical side and with the culture medium from the basolateral side. In the stagnation point setup () the flowrate (100 cm3 min−1) is too low for particle impaction. Consequently, deposition is limited to diffusion and sedimentation. Other ALI concepts (Phillips et al. Citation2005; Savi et al. Citation2008; Bisig et al. Citation2018) choose different setups, for instance for minimum air velocity at the cell surface to mimic the situation in the alveolar space of the lungs more closely, thereby avoiding the cell stress from the radial shear flow in the stagnation point setup.
Figure 1. (a) Scheme of a VitroCell automated exposure station (air-liquid interface exposure system). The aerosol path from outside to the exposure site is kept at a temperature of 37 °C by the system containment heater and circulation. It is conditioned to a relative humidity of 85% in the humidifier. The particles are isokinetically sampled from the humidifier and transported to the exposure wells in horizontal sampling lines. Flow rate through the well is controlled for 100 cm3 min−1. Six wells are grouped into an exposure module. The system holds three modules with identical properties. One exposure module is used for clean air reference. The section numbers indicate the calculation steps for particle loss estimation (). (b) Scheme of the air-liquid interface (ALI) exposure setup. The aerosol is delivered to the ALI via a trumpet-shaped flow-guiding element. Particles deposit onto the cells by diffusion and sedimentation. The well keeps the insert in place. Cells grow on a membrane in the insert with the medium from the basolateral and the exposure aerosol from the apical side. Ri is the inlet radius, Rw the radius of the membrane of an insert in a well and ht the distance of the trumpet from the cell membrane (see ).
Several deposition models are available to estimate the particle deposition probability at the ALI (Comouth et al. Citation2013; Grabinski, Hussain, and Mohan Sankaran Citation2015; Lucci et al. Citation2018). The model of Comouth et al. (Citation2013) fits a mathematical function to data measured by electron micrograpy. It is used here, as it was verified with the ALI system similar to ours (Mülhopt et al. Citation2016; Krebs Citation2019). The model of Grabinski, Hussain, and Mohan Sankaran (Citation2015) is derived from finite element considerations together with deposition experiments and includes a mechanism for the electrically enhanced deposition of charged particles. The model of Lucci et al. (Citation2018) uses pure physical parameters and therefore does not rely on mathematical functions fitted to measured data points.
Deposition in the human respiratory tract can be calculated using the ICRP model (ICRP Citation1994), which itself approximates experimental data on the total and regional lung deposition and the clearance in humans. The lung is functionally subdivided into the extrathoracic (ET), tracheo-bronchial (TB) and alveolar (AL) region. Here, regional information is available for volume, but not for wall surface area. Physical models do not have this limitation as they use a lung structure and airway deposition equations to calculate local and total particle deposition (Findeisen Citation1935; Landahl Citation1950; Beeckmans Citation1965; Gerrity et al. Citation1979; Yeh and Schum Citation1980; Ferron, Haider, and Kreyling Citation1988; Ferron, Kreyling, and Haider Citation1988; Hofmann and Koblinger Citation1990; Stapleton, Finlay, and Zuberbuhler Citation1994; Anjilvel and Asgharian Citation1995). The lung structure model allows the calculation of the surface area in each airway generation and the mean surface deposition in an airway.
Aerosol particle loss occurs during the transport inside an ALI device. It is modeled as the transmission in a series of tubes and bends (Karg Citation1993; Brockmann Citation2011) for the ALI. Particle inhalability is reviewed by Brown et al. (Citation2013) and ICRP (Citation1994) for the RT. Since deposition depends on particle size, density and shape, a substantial change in transmitted exposure size distribution has to be considered for aspiration to the ALI and for respiration in the lung.
The aim of this study is to compare both the deposition of aerosol particles on cells at the air-liquid interface and the deposition in the human respiratory tract. A commercially available air-liquid interface exposure station (Krebs Citation2019) is selected where a mathematical deposition model exists which is confirmed by experiments (Comouth et al. Citation2013). Particle deposition in the human lung is calculated with a modified version of the Hygroscopic Particle Lung Deposition (HPLD) model (Ferron et al. Citation2013). Particle deposition probability, deposition per surface area, deposition per cell and transmission are calculated for both the ALI and the RT. The results are applied to a typical emission particle size distribution.
Methods
Deposition (DE) is the probability for a particle to deposit on the cell layer at the ALI or in a human lung generation. Surface deposition (DA) is the deposition DE normalized by the area of the cells where the particles deposit on. The particle mass or number delivered to this surface area (also “tissue-delivered dose,” TD) is the particle mass or number deposited on the surface area of the cells located either at the ALI or in the regions of the respiratory tract during an experiment.
ALI deposition model
The ALI exposure system for this study is a VitroCell® “automated exposure station” (Comouth et al. Citation2013; Krebs Citation2019) with a central humidifier (“reactor,” inlet flow rate 1 m3 h−1, air conditioning to 37 °C, 85% RH; see ) and three exposure modules (). An extra module is available for clean air reference. Each module contains six wells with inserts, each of them connected individually to the humidifier by an isokinetic sampling line (graphically sketched in , module 3). The cells in each insert are exposed via a stagnation point flow setup (). The particle deposition at this air-liquid interface is, according to Comouth et al. (Citation2013):
(1a)
(1a)
where dp is the particle diameter, ρp, the density, Ri the radius of the well inlet and d0, m0, α, β, γ and ε are constants (). We adjusted m0 in by ourselves to match both graphs and measured data presented in Comouth et al. (Citation2013) in their Figure 9. EquationEquation (1a
(1a)
(1a) ) is valid for a size range of 40 nm ≤ dp ≤ 2 µm, a density of 1 g cm−3 ≤ ρp ≤ 2 g cm−3, an airflow of 100 cm³ min−1, a temperature of 37 °C and a RH of 85% ().
Table 1. ALI characteristics. (a) Parameters for the ALI deposition EquationEquation (1a(1a)
(1a) ) are taken from Comouth et al. (Citation2013), his . The value for m0 is modified here to fit the experimental data in his Figure 9. Model results are valid for the operational parameters in . (b) Operational and geometric parameters of the ALI setup. (c) Parameters for the estimation of the particle transmission from the inlet of a VitroCell automated exposure station to the inlet of a well-trumpet (see ).
The surface area at the ALI is assumed to be equal to the surface area of the membrane in an insert and to the surface area of a confluent monolayer of cells in an insert ():
(1b)
(1b)
with Rw being the radius of the insert membrane.
Lung deposition model
We use a modified version of the HPLD model (Ferron, Kreyling, and Haider Citation1988; Ferron, Karg, and Peter Citation1993; Ferron et al. Citation2013). It is equipped with the structure model “Typical Path Lung Model: Human - Whole Lung” of Yeh and Schum (Citation1980). The structure model is a set of hierarchically arranged tubes, where each tube branches into two smaller daughter-tubes with identical length and diameter, and with a defined angle between each other and with gravity (). All tubes with identical properties belong to the same lung generation number i. The structure is extended with a mouth or nose and an oropharynx (Ferron et al. Citation2013) with generation number i = 1 and i = 2, respectively. The trachea is for i = 3, the bronchi are for i = 4 to 9, the bronchioli for i = 10 to 19 and the alveolar ducts for i = 20 to 26 (; ).
Figure 2. (a) Parameters of the lung structure model of Yeh and Schum (Citation1980) corrected for a mean lung volume of 3 675 cm³ with EquationEquation (2b(2b)
(2b) ). The model is extended with a nose or mouth and an oropharynx (Ferron, Haider, and Kreyling Citation1988; Ferron, Kreyling, and Haider Citation1988). Data are presented as a function of the lung generation i. Nose or mouth is i = 1, the oropharynx i = 2, the trachea i = 3, the main bronchi i = 4, the last bronchi i = 11, the bronchioles i = 12 to 19 and the alveolar ducts i = 20 to 26 (ICRP Citation1994). Background colors indicate the extra-thoracic (ET, green), tracheo-bronchial (TB, blue) and alveolar (AL, red) lung region. (b) Parameters calculated from the lung structure model of Yeh and Schum (Citation1980) (see part (a)). Surface area Alung(i) of a lung generation i is calculated with EquationEquation (4)
(4a)
(4a) . (c) Lung deposition calculated with the HPLD model as a function of lung generation and particle size. Blue color marks nearly zero deposition, red color maximum deposition. Calculation is performed for spherical particles with a density of 1 g cm−3 and for a sitting male adult breathing by mouth with a tidal volume of 750 cm³, a constant respiration airflow, an equal in- and exhalation time (). (d) Same as (c), but for nose breathing.
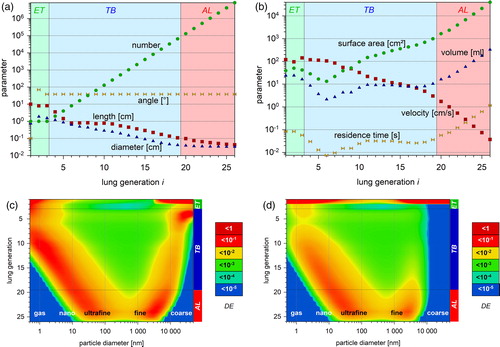
Table 2. Surface area of the cell layer at the ALI and of the lung structure of Yeh and Schum (Citation1980) corrected for a lung volume of 3675 cm³. The alveolar surface area is calculated with EquationEquation (4c(4c)
(4c) ). Total lung surface area is taken from Reference Man (ICRP Citation1975).
The lung structure model has been measured for a lung volume (LVM) of 5563.88 cm³ (Yeh and Schum Citation1980). We use a more realistic lung volume (LV) based on a functional respiratory capacity (FRC) of 3300 cm³ (ICRP Citation1994) with a correction for the tidal volume (VT):
(2a)
(2a)
EquationEquation (2b(2b)
(2b) ) is used to correct the length and diameter of the lung generations from i = 3 to 26 by a factor of f:
(2b)
(2b)
Deposition by sedimentation and diffusion in lung generation i is calculated for a stable laminar flow with equations from Thomas (Citation1958) and Gormley and Kennedy (Citation1949), deposition by impaction with an equation from Zhang, Asgharian, and Anjilvel (Citation1997), and deposition in nose and mouth with the equations from Cheng (Citation2003). We further use the assumption made by Gerrity et al. (Citation1979), that the deposition in an alveolar duct with alveoli is well described by the diameter of the alveoli.
The HPLD model is written in C-code and runs on Linux/Unix operating systems. It was updated for this study. A browser-based version is available online (Karg and Ferron Citation2020).
Deposition in the extrathoracic (DElung(ET)), tracheobronchial (DElung(TB)) and alveolar (DElung(AL)) lung region r as well as in the total lungs (DElung(TL)) is
(3a)
(3a)
(3b)
(3b)
(3c)
(3c)
(3d)
(3d)
We assume that aerosol particles are wall-adhesive after deposition, in contrast to gas molecules.
All calculations reflect a seated male adult (ICRP Citation1994) breathing calmly through the mouth or the nose with a tidal volume of 750 cm³, a respiratory frequency of 12 min−1, a constant airflow of 250 cm³ s−1, and an equal duration of 2.5 s for each in- and exhalation ().
Table 3. Parameters used for the HPLD model calculations (Ferron et al. Citation2013). The respiration conditions are for a quietly breathing male person (ICRP Citation1994).
The tubular wall surface area A(i) of a lung generation i is calculated by:
(4a)
(4a)
where L(i) is the length, D(i) the diameter and N(i) the number of tubes in lung generation i. Mouth and nose are modeled as a box in generation 1 characterized by length L(i = 1) and two diameters D1(i = 1) and D2(i = 1). Their wall surface is:
(4b)
(4b)
The extrathoracic and bronchial surface area Alung(ET) and Alung(TB), respectively, are the sum of the duct wall area of the lung structure (). Alung(TL) is taken from literature (ICRP Citation1975). The alveolar wall area Alung(AL) is calculated from total and regional lung surface area:
(4c)
(4c)
Deposition per surface area
The surface deposition (DA) is defined as the mean deposition per surface area at the ALI or in a lung generation i (; ):
(5a)
(5a)
(5b)
(5b)
Particle transmission efficiency
The deposition model for the ALI does not account for the transport loss from the ambient air outside to the cells at an insert inside (). A typical transmission function for the ALI is the product of a series of transport efficiencies for flow rates in vertical tubes, horizontal tubes and bends (Karg Citation1993; Brockmann Citation2011), ranging from the ALI inlet to one of the well trumpets in the middle of the system (sections in to module 2; ). All sampling lines are identical as depicted in module 3.
For human inhalation, the inhalability function follows the ICRP (Citation1994) convention for particle inhalation from calm air (Brown et al. Citation2013). The transport loss inside the lung depends on particle size, and it changes the transmitted size distribution during in- and exhalation. It is estimated from the HPLD model for mouth and nose breathing.
Particles deposited on the surface area
The particle number or mass deposited per surface area (TD) is the convolution of both size distribution and surface deposition. It is calculated for monodisperse particles by:
(6a)
(6a)
for polydisperse particles at the air-liquid interface by:
(6b)
(6b)
and for the respiratory tract by:
(6c)
(6c)
where Cp(dp,ρp) is the concentration in a particle sizer bin, te is the exposure duration and Q is either the flow rate through the ALI well () or the breathing minute volume (). Note that Cp does not distinguish between number, length, surface, volume or mass and allows calculating TD for all the respective moments. Note also, that the expression “dose rate” commonly refers to the ratio
e.g., to the deposited mass per hour.
Cell size and properties
Data for cell-count and -size are given in . Three of the most commonly used cell lines in ALI studies are A549, BEAS-2B and 16HBE, which are derived from from alveolar, bronchial and human-bronchial-epithelial cells, respectively (ATCC Citation2018a, Citation2018b; Merck Citation2019). All these cell lines retain many features of type-II pneumocyte cells, e.g., size or secretion of alveolar lining fluid. Type-I and type-II pneumocytes are cells of the alveolar epithelium, covering 94% and 6% of the alveolar space, respectively (Stone et al. Citation1992; ICRP Citation1994). We assume that the cells of the ET and TB region are similar in size to type-II pneumocytes, which themselves are close in size to A549 and in between both BEAS-2B and 16HBE (). In contrast, the surface area of type-I pneumocytes is 27-fold larger than the one of type-II pneumocytes.
Table 4. Properties of several human lung cells and ALI cell lines. The weighted average of type-I and type-II pneumocytes is used for the TL calculations, as type-I cells contribute 94% to the epithelial surface area and type-II cells 6%. For the ALI exposure, the A549 cell line is assumed. BEAS-2B and 16HBE cell lines are included for comparison.
Particle size distribution for an exposure scenario
To demonstrate TD calculation, a lognormal particle size distribution is used which mimics an emission aerosol measurement. We approximate a diesel emission aerosol with a count median diameter (CMD) of 100 nm and a mean geometric standard deviation (GSD) of 1.6, which is typical for an emission aerosol (). Particles are spheres of unit density and not aggregated soot particles. The mass median diameter is calculated from count median diameter by the Hatch-Choate equations (Hatch and Choate Citation1929; Hinds Citation1999).
Table 5. Parameters for the lognormal particle size distribution used as airborne particle exposure scenario. It mimics the size distribution of a diesel emission with 100 nm modal diameter. The corresponding mass median diameter is derived by Hatch-Choate conversion (Hinds Citation1999). Number and mass distribution are adjusted for a total concentration of 106 cm−3 and 1 mg m−3, respectively.
Results
Deposition in the lung
The and show data from the lung structure model of Yeh and Schum (Citation1980) for a mean lung volume of 3675 cm³ (EquationEquation (2a(2a)
(2a) ); ). presents the structural parameters number, length, diameter and angle for a lung generation i. presents the calculated parameters such as tube wall surface area, volume, average flow velocity and residence time.
In and , the deposition is calculated as a function of both particle size and lung generation, for particles with a density of 1 g cm−3, for the respiration conditions in , and for mouth and nose breathing, respectively. Compared to mouth breathing, both nano- and micron-sized particles deposit almost quantitatively in the nose.
Comparison of ALI and lung deposition
shows the deposition for the ALI and for the RT regions, i.e., the output from EquationEquation (1a(1a)
(1a) ) and from the HPLD model. The deposition on the cells in the ALI is significantly lower than the deposition in most lung regions. Also the slopes differ significantly. The minimum of deposition is at 240 nm for the ALI and between 320 nm and 600 nm for the RT regions.
Figure 3. (a) ALI and regional lung deposition. Deposition at the ALl is calculated with EquationEquation (1a(1a)
(1a) ) as a function of particle size. Total and regional lung deposition is calculated with the HPLD model for mouth respiration. Modeling conditions are listed in and for ALI and lung, respectively. (b) Ratio DElung(r)/DEALI of the regional lung deposition and the ALI deposition (a). The horizontal bars show the half-width for the ET (green), TB (blue), AL (red) and TL (yellow) region ().
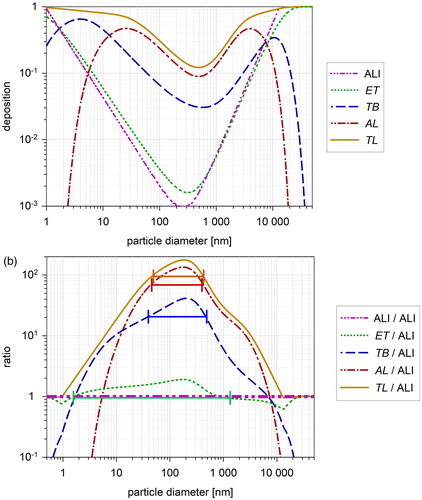
To compare ALI and lung deposition, shows the ratio DElung(r)/DEALI, i.e., the difference between regional lung deposition and ALI deposition. At the deposition minimum DElung(r) is up to 200 fold higher than DEALI. The differences can be explained mainly by the differences in geometry between ALI and lung airways: The distance for a particle to hit a wall is considerably shorter in most lung generations than at the ALI (, , ). For the ET region, the ratio is close to 1 as the airways are wide.
Around the deposition minimum the ratio DElung(r)/DEALI is relatively constant. We define the half-width (HW) as the diameter range with the ratio between 50% and 100% of the maximum. The HW for the lung regions and TL is listed in . A mean range is found between 40 nm and 450 nm.
Table 6. Half-width ranges for the ratio DElung(r)/DEALI and DAlung(r)/DAALI. All values between the maximum (100%) and half of the maximum (50%) of a size distribution are found within the HW range ( and ). The value “mean” is at ¾ of the maximum. Ratio−1 is the inverse DA-ratio meaning how many fold the dose at the ALI is higher than in the lung (“dose correction factor”).
Deposition per surface area
shows the surface deposition DA at the cell layer of the ALI and in the human respiratory tract. DA is considerably higher for the ALI than for any lung region because the cell area at the ALI is 4.7 cm2 and the smallest surface area in a lung region is 90 cm2 ().
Figure 4. (a) Deposition per surface area for the ALI and for the lung regions. Mean surface deposition in the ALl is calculated with EquationEquation (5a(5a)
(5a) ) as a function of particle size. Total and regional lung surface deposition is calculated with the HPLD model for mouth respiration using EquationEquation (5b
(5b)
(5b) ) (see ). The ordinates on the right show the corresponding particle number and mass delivered per surface area at the ALI and in the lung regions. They are calculated with EquationEquations (6b)
(6b)
(6b) and Equation(6c)
(6c)
(6c) , respectively. Ordinates represent simultaneously the TD for an exposure number concentration of 1 cm−3 and for an exposure mass concentration of 1 µg m−3. Thereby te is set to 1 h for both ALI and lung and Q to 100 cm3 min−1 () for the ALI and to 0.54 m3 h−1 for the lung, what results in a constant factor of 6 × 10³ and 540 × 103, respectively. (b) Ratio DAlung(r)/DAALI of the regional lung surface deposition and the ALI surface-deposition (). The horizontal bars show the half-width for the ET (green), TB (blue), AL (red) and TL (yellow) region ().
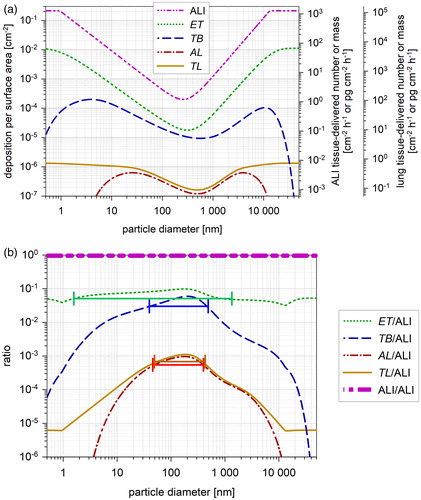
The ratio DAlung(r)/DAALI in shows the difference between ALI and lung. All ratios are ≪1 with DAlung(AL) being more than three orders of magnitude smaller than DAALI ().
The half-width size range of DAlung(r)/DAALI for the RT regions () is identical with the half-width size range of the deposition ratio DElung(r)/DEALI (compare with ) as the normalizing surface area is constant for each region.
Particle transmission efficiency
displays the transport efficiency for particles from calm ambient air to an ALI cell layer (aspiration) and to the human lungs for both mouth and nose (respiration). The ALI aspiration efficiency is higher than 0.5 for the particle size range between 1 nm and 7 µm (). The inhalability for the human respiratory tract is higher than 0.5 for the particle size range from 1 nm to 50 µm (ICRP Citation1994). Based on calculations with the HPLD model the transmission of aerosol particles is determined after passing the ET and TB region for both mouth and nose breathing. More than 50% of the particles in the size range from 1.6 nm to 12 µm pass the ET region during mouth breathing. More than 50% of the particles in the size range from 9 nm to 7 µm pass the TB region (). The corresponding values for nose breathing are 2 nm to 4 µm and 11 nm to 3 µm, respectively.
Figure 5. Particle transmission to the site of deposition as a function of particle size. ALI transmission is calculated (without any pre-impactor) from the ALI inlet to a well (see and ). Human inhalability follows the ICRP convention (Brown et al. Citation2013). Mouth and nose transmission is calculated with the HPLD model, showing the particle transfer to the beginning of the tracheo bronchial tract (TB, i > 2) and to the beginning of the alveolar space (AL, i > 19). The transmission efficiency for exhaled particles is added. The expression “mouth to TB” is used as a shortcut for “mouth breathing to enter the tracheo-bronchial region,” and “mouth to AL” as a shortcut for “mouth breathing to enter the alveolar region.”
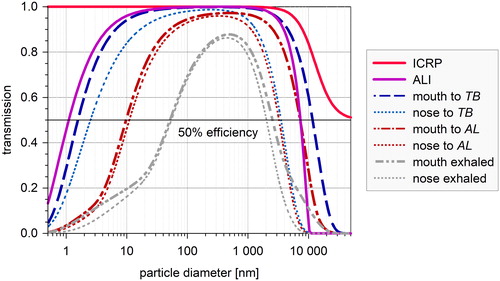
Table 7. Particle transmission to the ALI and different lung regions for inhalation (see ). For comparison the HW of the exhaled particles is indicated.
Particles delivered to the cells
In additional ordinates are added on the right side showing the results for the size-resolved TD calculation. They follow EquationEquation (6a(6a)
(6a) ) for monodisperse particles. The first ordinate represents TDALI calculated for an exposure number concentration of 1 cm−3 or a mass concentration of 1 µg m−3, an exposure time of 1 h, and the ALI flow rate of 100 cm3 min−1. The second ordinate represents TDlung calculated for the same number and mass concentration, an exposure time of 1 h, and the breathing conditions in .
displays the TD model results for the polydisperse diesel-like emission mass distribution (). Calculations are performed with the EquationEquations (6b)(6b)
(6b) and Equation(6c)
(6c)
(6c) . Results show the TD deposited per hour per surface area. DA is mainly responsible for the difference between the ALI and the lung regions. Deposition is comparable within one order of magnitude for ALI, ET and TB region, but is smaller by more than one order of magnitude for the AL region and the total lung.
Figure 6. Surface-delivered particle mass (a) and cell-delivered particle number (b) at the ALI and in the lung regions. The airborne exposure concentration is 1 mg m−3 in (a) and 106 cm−3 in (b). A lognormal emission distribution is applied (see ). Part (b) compares the load for cells in different lung regions. The corresponding cell counts (cells per cm2) are indicated in the columns. For the ALI, the size of A549 cells is assumed, for ET and TB region the cell size is assumed to be identical with type-II pneumocytes. For the AL region the size of type-I pneumocytes and for TL the weighted average of type-I and type-II cells is assumed ().
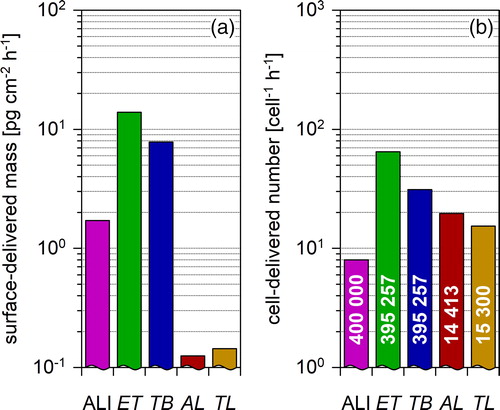
shows the particle number deposited on a single cell. ALI and AL region are better comparable here, as the human type-I pneumocytes are 27-fold larger than the other cells ().
Discussion
ALI deposition model
The right part of EquationEquation (1a(1a)
(1a) ) consists of two terms. The first term specifies diffusional deposition and depends on particle size but not on density. The second term describes sedimentation and depends on both particle size and density. EquationEquation (1a
(1a)
(1a) ) applies solely to the conditions in . For highly aggregated particles (ρp ≪ 1 g/cm³) virtually no sedimentation is expected and the second term should be constant or approach zero. According to EquationEquation (1a
(1a)
(1a) ), however, it yields a rising deposition for a rising dp, which is unrealistic. Additionally, one expects the sedimentation to depend on the square of the aerodynamic diameter.
EquationEquation (1a(1a)
(1a) ) does not include a variable for the flow rate. Therefore we point out some aspects how the deposition depends on the airflow. The flow in the ALI is highly laminar (Re < 25). So one can expect that the typical parameters for diffusion and sedimentation of aerosol of particles from a stable laminar flow are valid. These parameters include residence time or air flow. As the flow in the ALI is highly laminar the typical parameters in the deposition equations for diffusion (Gormley and Kennedy Citation1949) from a laminar flow in a horizontal tube and sedimentation (Thomas Citation1958; Pich Citation1972), Δ and μ, respectively, are expected:
(7a)
(7a)
(7b)
(7b)
where υp is the velocity of a particle by gravity, t is the residence time, dae is the aerodynamic particle diameter, R is the radius of the tube and Dp is the diffusion constant of the particle.
Additionally, we state a problem with the constants given in Comouth’s for the second term of EquationEquation (1a(1a)
(1a) ). We could not reproduce the deposition in Comouth et al. (Citation2013), their Figure 9, with the parameter m0 given in their . We replaced their value for our calculations with the one given in to get the correct approximation.
Lung deposition model
The HPLD model (see Ferron, Kreyling, and Haider (Citation1988), their Figure 7) is based on a model published by Lee et al. (Citation1979) and Gerrity et al. (Citation1979). It has been compared with experimental data (Heyder et al. Citation1986) for the tracheo-bronchial and alveolar lung deposition, three different respiratory conditions, tidal volumes of 500, 1000, and 1500 cm3 and equal in- and exhalation times of 2, 4, and 2 s, respectively. The differences were less than 7% of the inhaled particle concentration in the particle size range from 100 nm to 10 µm.
The ICRP (Citation1994) model (their Figures 12 to 15) studies the influence of age, gender and respiration conditions (their Annexe D), and reviews lung parameters of different ethnic groups (their Table 9). Differences less than 10% are found for adult female, adult male, girl and boy of an age of 15 years. Differences up to a factor of three are found between younger children and adults. It reviews the literature on spontaneous breathing showing changes in TL by 20% of the inhaled concentration. More recently Molgat-Seon, Peters, and Sheel (Citation2018) published a study on additional lung parameters of specialized population groups.
We studied the degree of consistency between the data calculated with the ICRP model and our deposition model. Data for the ICRP model Annex F (1994) are for a male adult and different respiration conditions as a function of the activity median thermodynamic diameter (AMTD). This diameter can be set equal to the particle diameter dp assuming a homogeneous distribution of the activity in the particle. Further the particles have a density of 3 g cm−3 and a shape factor of 1.5. Considering the aerodynamic diameter of such a particle, it can be approximated by a spherical particle with a density of 2 g cm−3 (Schmid et al. Citation2007). We restrict our consistency check to a particle size of 130 nm, which is in between the size range of 40 nm to 450 nm ( and ). The nearest value in Annexe F is a particle with an AMTD of 100 nm. A summary of deposition values for this diameter is listed in together with the corresponding HPLD data for a breathing rate of 0.54 m3 h−1 and a GSD of 1.5. Differences in the output of both models for the deposition in TB, AL and TL are less than 20%.
Table 8. Deposition in the lung regions of an adult man calculated with the HPLD model () compared to lung deposition data published by the ICRP, Annexe F (1994). Data are for a polydisperse aerosol with a mean particle diameter of 100 nm, a GSD of 1.5, a particle density of 3 g cm−3 and a shape factor of 1.5.
A summary of deposition values for this diameter is listed in together with the corresponding HPLD data for a breathing rate of 0.54 m3h−1 and a GSD of 1.5. Differences in the output of both models for the deposition in TB, AL and TL are less than 12%. The corresponding differences for the other respiration conditions are 0.040 to 0.082, 0.20 to 0.21 and 0.28 to 0.35 less than a factor of 2.1.
For our calculations we use the lung structure model of Yeh and Schum (Citation1980) as other models do (Anjilvel and Asgharian Citation1995; Winkler-Heil, Ferron, and Hofmann Citation2014). Yu and Diu (Citation1982) calculated the deposition for four different lung structure models including the structure used here and found a variation less than 10% of the inhaled particle concentration; an exception was the lung structure of Weibel (Citation1963), where the difference was up to 20%.
Comparison of ALI and lung deposition
shows large differences between the ALI and the lung regions for deposition values and slopes of the curves. The values for the ratio DElung(r)/DEALI differ for the AL region by a factor of 135 at the peaks (; ). Near the peaks the ratio is relatively constant and a half-width range (HW) is defined where the ratio is between 50% and 100% of the maximum. Outside this range the ratio drops rapidly to one and below (). HW marks the particle size range, where ALI and lung TD can be compared reliably.
The ratio DAlung(r)/DAALI in estimates the difference between the deposited dose TD in the lung region r and the ALI. The surface deposition for the ET, TB and AL region is more than a factor of 10, 17 and 1180 lower than at the ALI, respectively. The factors vary only 2-fold within the HW range from 40 nm to 450 nm (). They are valid for quiet respiration conditions compared with the VitroCell ALI system.
For the biological (toxicological) dose, clearance processes in the TB and AL region have to be considered additionally, and also the difference in sensitivity between the ALI cell lines and the cells in the human lung regions.
Particle transmission efficiency
The ALI transmission efficiency () is a first guess by standard equations for particle transmission in tubes and varies noteworthy with tube length, diameter, curvature, angle with gravity and particle charge. It is calculated for a well in exposure module 2 (). The 50% transmission efficiency ranges from 1 nm to 7 µm. This is much broader than the HW for the deposition ratio in and . Note, however, that—according to —the ALI system is not capable of transferring particles larger than 7 µm to the cells. This has to be kept in mind, if—for instance—particles from mechanical grinding are used as an exposure aerosol. For standard-use, it is advisable to add a ∼4 µm pre-impactor to the humidifier inlet to stabilize the aerosol distribution and to avoid excessive internal contamination.
According to and the 50% transmission efficiency for aerosol particles to the lung ranges from <1 nm to >50 μm for inhalation (ICRP Citation1994). For nose breathing it ranges from 2.5 nm to 3.5 μm and from 10 nm to 3.5 μm for entering the TB and AL regions, respectively. The exhaled range is 40 nm to 3 μm for both nose and mouth breathing. All particles in this size range are suitable for exposure experiments at the ALI.
Fate of particles after deposition
A major difference between ALI and the human lungs is the clearance, e.g., by ciliary activities in the lungs. A summary of the clearance of aerosol particles has been given in ICRP (Citation1994). Particles are commonly cleared within several minutes from the trachea and within a day from the bronchioli. However uneven clearance has been reported in the upper airways and some areas are not cleared at all, e. g. near to the junction of a bifurcation (“hot spot”). Particles in the alveolar region may stay for a much longer time until they are encapsulated or phagocytized by macrophages. Additionally, particle solubility has to be considered. Lung clearance is beyond the scope of this article. We restrict our considerations to pure particle deposition onto the geometric surface area.
Deposition of gas molecules
A particle size below 1 nm is commonly attributed to the transition zone between particles and gas- or vapor-molecules. Consequently, the deposition behavior of gas molecules has to be taken more and more into account for model calculations below 1 nm. Molecules do not adhere to the tissue any more when they touch down onto cell surface unless they are highly reactive like formaldehyde. Gases can also exert a back pressure from tissue side after some duration of exposure, with a lower deposition probability as a consequence.
and indicate that the first generations are primarily exposed to these sub-nanometer particles. Due to high diffusivity hardly any of them reaches a lung generation i > 10. Only particles of the ultrafine and fine size range can penetrate further on. As a consequence, reactive gas or vapor molecules can reach the deep lung only when adsorbed on a fine particle or when there is already a backpressure from tissue side.
The ALI exposure system does not trap nano particles or gases like the ET and TB regions do. According to the ALI overrates reactive gas or vapor deposition by orders of magnitude compared to the lung.
A more detailed discussion of the effects of gas molecule goes beyond our scope. The model outcomes for sub-nanometer particles, however, may be useful for the design of ALI systems in future, which might also mimic the gas-to-particle relationship of semi-volatile aerosols in the RT.
Airway bifurcation
At airway bifurcations, the deposition pattern differs considerably from the average. Impaction and interception at the walls lead to uneven clearance. There are numerous studies on flow pattern and deposition, and on the parameters governing them (Zhang et al. Citation2002; Zhang and Papadakis Citation2010; Zierenberg et al. Citation2013). Balásházy, Hofmann, and Heistracher (Citation1999) modeled particle deposition for various spots in the vicinity of a bifurcation and defined enhancement factors for excess deposition. Their analysis yielded strong inhomogeneities with particle size and bifurcation geometry. They found enhancement factors up to about 100 in the upper bronchial airways. Especially for small (100 µm2) scanning elements the enhancement factors increased with decreasing spot size.
According to , the deposited mass at the ALI is comparable or lower than in the TD in the TB region. Therefore, electrical or phoretical particle deposition enhancement during an ALI experiment can be used to mimic the enhanced deposition of aerosol particles in the ET and TB region and at an airway bifurcation.
Factors influencing TD
The surface deposition DA in EquationEquation (6)(6a)
(6a) explains the discrepancy between ALI and lung regions ( and ), as it combines both deposition and surface area effects. Tippe, Heinzmann, and Roth (Citation2002) state the particle deposition being nearly independent of particle size (p. 215); more recent papers (Desantes et al. Citation2006; Comouth et al. Citation2013; Grabinski, Hussain, and Mohan Sankaran Citation2015; Lucci et al. Citation2018) state a clear size dependency. The average deposition of more than 1% seems clearly too high; for accumulation mode particles (∼200 nm) Desantes et al. (Citation2006) estimate 0.65% for particles with ρ = 1.2 g cm−3 and Comouth et al. (Citation2013) calculate 0.1% for unit density particles. In , a deposition probability >1% is found for particles <30 nm and >1.3 µm.
The exposure term Q te represents the exposure air volume. It is about 90-fold larger for the lung than for the ALI system (; ; ). It partly compensates the differences in surface deposition between ALI and lung. As the exposure conditions are usually kept constant by the experimenters, Q te is mostly a constant factor ().
The size of cells influences the amount of particles being deposited on a single cell. A549 cells are frequently used as a model for the AL region and BEAS-2B for TB. Both are roughly comparable in size with each other and with the alveolar type-II pneumocytes, but are 27-fold smaller than type-I pneumocytes of the alveolar epithelium (). The different cell size of type-I pneumocytes in the lung and of A549 at the ALI makes the TD per single cell comparable () and would – from this point of view – legitimize the ALI as a reasonable model design to mimic the cell-delivered dose in the AL region.
Application to particle size distribution
If only PM (particulate matter) filter samples are available, EquationEquation (6a(6a)
(6a) ) can be used for a quick estimation of TDALI from averaged data. The deposition per surface area DA is determined with respect to the predominant exposure particle size and TDALI calculated from the mass concentration Cp and Q te. The weighted average of the GSD range (16% to 84%) of our example distribution in .e., from 62 nm to 160 nm) yields a DE of about 0.2%. TD from PM2.5 filter samples was readily calculated to estimate an upper limit for exposure dose elsewhere (Oeder et al. Citation2014; Oeder et al. Citation2015).
For aggregated emission particles the particle concentration term Cp has to consider the effects of the aerodynamic diameter (dp, ρp, shape factor and Cunningham slip correction). For diesel emissions (Kittelson, Watts, and Johnson Citation2002; Park et al. Citation2003; Pagels et al. Citation2009) or wood combustion emissions (Leskinen et al. Citation2014), the mass-mobility relationship is to be considered. It additionally results in a considerably lower DE, especially for highly aggregated particles (ρp ≪ 1 g cm−3). In this case EquationEquation (1a(1a)
(1a) ) is not applicable and another ALI deposition model must be applied.
For the lognormal exposure distribution (), the differences in TD between ALI and lung are less obvious () as exposure particle concentration and particle deposition act to compensate each other: while the concentration maximum is at the deposition minimum, the rising deposition probability for nano- and micron-sized particles enhances the contribution of the exposure distribution tails.
Conclusions
A particle size range of 40 nm to 450 nm is identified, where the ratio of both the deposition in a lung region and the deposition in the ALI varies by less than a factor of two (). Inside the range, the mean absolute ratio is up to 177 (). Outside the range the ratio drops down to 1 and lower. This ratio is important to compare ALI and lung deposition. The limitation of the size range is caused by the loss of particles inside the lungs before the particles reach the TB or AL region.
The same size range is found for the ratio of the deposition per surface area in a lung region and at the ALI (). This factor is important to compare the particle load onto the cells. Particle load for a lung cell is more than 10-, 17-, and 1180-fold lower compared to a cell at the ALI for the extrathoracic, tracheo-bronchial and alveolar lung region, respectively (). The ratio can be lower than of 10−5 outside the range.
The mass delivered per surface area for the diesel emission example differs less than 10-fold between ALI, extra-thoracic and bronchial lung region. It is more than 10-fold smaller for the alveolar region and the total lung (). This has to be considered when selecting cell lines for exposure experiments. For bronchial cell lines, the particle load for ALI should be slightly enhanced, e.g., electrically, as the bronchial lung dose is nearly comparable. For alveolar cell lines, a 10-fold deposition reduction should be applied to the ALI to match the particle load for both systems.
The particles delivered to a single cell at the ALI for the diesel emission example is about the same as in the alveolar region, since the type-I pneumocytes of the alveolar epithelium are about 27-fold larger than the cells used in the air-liquid interface (). The cell surface area of alveolar type-II pneumocytes and of the commonly used cell lines is roughly comparable ().
The transmission efficiency for aerosol particles to both the ALI and the lung is close to one for the particle size range from 40 to 450 nm ().
The transmission to the lung generations becomes more limited with lung depth (). This has to be considered in the design of ALI exposure experiments to avoid effects measured only in the ALI for particles that cannot reach the respective lung regions. This is especially the case for accompanying exposure gases.
| Nomenclature | ||
| A | = | surface area of the cell layer at the ALI or in the lung |
| A(i) | = | wall area of a bronchial tube in lung generation i |
| AL | = | indicator for the alveolar lung region |
| ALI | = | air-liquid interface |
| AMTD | = | activity-median thermodynamic diameter |
| C | = | mass or number concentration parameter for a size distribution |
| CMD | = | count median diameter of a particle number distribution |
| Cp | = | particle number or mass in a bin of a particle sizer |
| D | = | diameter of a tube |
| D(i), L(i), N(i) | = | diameter, length and number of tubes in lung generation i |
| DE | = | deposition fraction, also “deposition” |
| DA | = | deposition per cell surface area, also “surface deposition” |
| Dp | = | diffusion coefficient of a particle |
| d0 | = | constant in ALI deposition model equation |
| dp | = | particle diameter |
| dae | = | aerodynamic particle diameter |
| f | = | factor for lung volume adjustment in the HPLD model (EquationEquation (2b |
| ET, TB, AL, TL | = | indicate extra-thoracic, tracheo-bronchial, alveolar and total lung region, respectively () |
| FRC | = | functional respiratory capacity |
| GSD | = | geometric standard deviation of a lognormal distribution |
| HPLD | = | hygroscopic particle lung deposition model |
| ht | = | distance of the trumpet from the cells () |
| HW | = | half-width of a distribution (definition in ) |
| i | = | index of a lung generation ( and ) |
| L | = | length of a tube |
| LV | = | lung volume |
| LVM | = | measured lung volume |
| m0 | = | constant in the ALI deposition model (EquationEquation 1a |
| MMD | = | mass median diameter of a particle mass distribution |
| Q | = | flow rate |
| r | = | index for the lung regions: ET, TB, AL and TL |
| R | = | radius of a tube |
| RH | = | relative humidity |
| Ri | = | radius of the inlet of the “trumpet” () |
| RT | = | respiratory tract |
| Rw | = | radius of the surface area of the cell layer in a well-insert at the ALI |
| t | = | residence time |
| TB | = | indicator for the tracheo-bronchial lung region |
| TD | = | particle mass or number delivered per surface area (“tissue-delivered dose” or “dose rate,” if normalized with the experiment time) |
| TL | = | indicator for the total lung |
| te | = | exposure duration (time) |
| VT | = | tidal volume |
| υp | = | particle velocity |
| α, β, γ, ε | = | constants in ALI deposition model (EquationEquation (1) |
| Δ | = | parameter for the deposition by diffusion in a tube |
| κ | = | particle shape factor |
| μ | = | parameter for the deposition by sedimentation in a tube |
| ρp | = | particle density |
| σg | = | geometric standard deviation |
Acknowledgments
Data and ALI instrumentation was provided within the framework of the Helmholtz Virtual Institute of Complex Molecular Systems in Environmental Health (HICE). The authors wish to thank Dr. Hanns-Rudolph Paur and Sonja Mülhopt, KIT-Karlsruhe, Germany, and Christoph Schlager, VitroCell, Waldkirch, Germany, for discussion and support. No conflict of interest is declared by any of the authors.
References
- Anjilvel, S., and B. Asgharian. 1995. A multiple-path model of particle deposition in the rat lung. Fundam. Appl. Toxicol. 28 (1):41–50. doi:10.1006/faat.1995.1144.
- ATCC. 2018a. A549 Product specification and documentation. Accessed November 21, 2018. http://www.lgcstandards-atcc.org/Products/All/CCL-185.aspx#documentation
- ATCC. 2018b. BEAS-2B Product specification and documentation. Accessed November 21, 2018. http://www.lgcstandards-atcc.org/Products/All/CRL-9609.aspx#documentation.
- Aufderheide, M., and U. Mohr. 2004. A modified CULTEX system for the direct exposure of bacteria to inhalable substances. Exp. Toxicol. Pathol. 55 (6):451–4. doi:10.1078/0940-2993-00348.
- Aufderheide, M., B. Halter, N. Mohle, and D. Hochrainer. 2013. The CULTEX RFS: A comprehensive technical approach for the in vitro exposure of airway epithelial cells to the particulate matter at the air-liquid interface. BioMed Res. Int. 2013:734137. doi:10.1155/2013/734137.
- Balásházy, I., W. Hofmann, and T. Heistracher. 1999. Computation of local enhancement factors for the quantification of particle deposition patterns in airway bifurcations. J. Aerosol Sci. 30 (2):185–203. doi:10.1016/S0021-8502(98)00040-8.
- Beeckmans, J. M. 1965. The deposition of aerosols in the respiratory tract. I. Mathematical analysis and comparison with experimental data. Can. J. Physiol. Pharmacol. 43 (1):157–72. doi:10.1139/y65-015.
- Bisig, C., P. Comte, M. Güdel, J. Czerwinski, A. Mayer, L. Müller, A. Petri-Fink, and B. Rothen-Rutishauser. 2018. Assessment of lung cell toxicity of various gasoline engine exhausts using a versatile in vitro exposure system. Environ. Pollut. 235:263–71. doi:10.1016/j.envpol.2017.12.061.
- Bitterle, E., E. Karg, A. Schroeppel, W. G. Kreyling, A. Tippe, G. A. Ferron, O. Schmid, J. Heyder, K. L. Maier, and T. Hofer. 2006. Dose-controlled exposure of A549 epithelial cells at the air-liquid interface to airborne ultrafine carbonaceous particles. Chemosphere 65 (10):1784–90. doi:10.1016/j.chemosphere.2006.04.035.
- Brockmann, J. E. 2011. Aerosol transport in sampling lines and inlets. In Aerosol Measurement, ed. P. Kulkarni, P. A. Baron and K. Willeke, PART II TECHNIQUES, 68–105. Chichester, UK: Wiley & Sons.
- Brown, J. S., T. Gordon, O. Price, and B. Asgharian. 2013. Thoracic and respirable particle definitions for human health risk assessment. Part. Fibre Toxicol. 10 (1):12. doi:10.1186/1743-8977-10-12.
- Cheng, Y. S. 2003. Aerosol deposition in the extrathoracic region. Aerosol Sci. Technol. 37 (8):659–71. doi:10.1080/02786820300906.
- Comouth, A., H. Saathoff, K. H. Naumann, S. Muelhopt, H. R. Paur, and T. Leisner. 2013. Modelling and measurement of particle deposition for cell exposure at the air-liquid interface. J. Aerosol Sci. 63:103–14. doi:10.1016/j.jaerosci.2013.04.009.
- Desantes, J. M., X. Margot, A. Gil, and E. Fuentes. 2006. Computational study on the deposition of ultrafine particles from Diesel exhaust aerosol. J. Aerosol Sci. 37 (12):1750–69. doi:10.1016/j.jaerosci.2006.07.002.
- Ferron, G. A., B. Haider, and W. G. Kreyling. 1988. Inhalation of salt aerosol particles — I. Estimation of the temperature and relative humidity of the air in the human upper airways. J. Aerosol Sci. 19 (3):343–63. doi:10.1016/0021-8502(88)90274-1.
- Ferron, G. A., W. G. Kreyling, and B. Haider. 1988. Inhalation of salt aerosol particles. II. Growth and deposition in the human respiratory tract. J. Aerosol Sci. 19 (5):611–31. doi:10.1016/0021-8502(88)90213-3.
- Ferron, G. A., E. Karg, and J. E. Peter. 1993. Estimation of deposition of polydisperse hygroscopic aerosols in the human respiratory tract. J. Aerosol Sci. 24 (5):655–70. doi:10.1016/0021-8502(93)90022-2.
- Ferron, G. A., S. Upadhyay, R. Zimmermann, and E. Karg. 2013. Model of the deposition of aerosol particles in the respiratory tract of the rat. II. Hygroscopic particle deposition. J. Aerosol Med. Pulm. Drug Deliv. 26 (2):101–19. doi:10.1089/jamp.2011.0965.
- Findeisen, W. 1935. Über das Absetzen kleiner, in der Luft suspendierter Teilchen in der menschlichen Lunge bei der Atmung. Pflügers Arch. 236 (1):367–79. doi:10.1007/BF01752351.
- Gerrity, T. R., P. S. Lee, F. J. Hass, A. Marinelli, P. Werner, and R. V. Lourenco. 1979. Calculated deposition of inhaled particles in the airway generations of normal subjects. J. Appl. Physiol. 47 (4):867–73. doi:10.1152/jappl.1979.47.4.867.
- Gormley, P. G., and M. Kennedy. 1949. Diffusion from a stream flowing through a cylindrical tube. Proc. R. Irish Acad. 52:163–9.
- Grabinski, C. M., S. M. Hussain, and R. Mohan Sankaran. 2015. Simulations of submicron aerosol deposition at an air–liquid interface for in vitro toxicology. J. Aerosol Sci. 90:87–102. doi:10.1016/j.jaerosci.2015.08.005.
- Hatch, T., and S. P. Choate. 1929. Statistical description of the size properties of non uniform particulate substances. J. Franklin Inst. 207 (3):369–87. doi:10.1016/S0016-0032(29)91451-4.
- Heyder, J., J. Gebhart, G. Rudolf, C. F. Schiller, and W. Stahlhofen. 1986. Deposition of particles in the human respiratory tract in the size range 0.005–15 μm. J. Aerosol Sci. 17 (5):811–25. doi:10.1016/0021-8502(86)90035-2.
- Hinds, W. C. 1999. Aerosol technology: Properties, behavior, and measurement of airborne particles, 2nd ed. New York: John Wiley & Sons.
- Hofmann, W., and L. Koblinger. 1990. Monte Carlo modeling of aerosol deposition in human lungs. Part II: Deposition fractions and their sensitivity to parameter variations. J. Aerosol Sci. 21 (5):675–88. doi:10.1016/0021-8502(90)90122-E.
- ICRP. 1975. Anatomical, physiological and metabolic characteristics. Report of the Task Group on Reference Man. ICRP publication 23. Oxford, UK: Pergamon Press.
- ICRP. 1994. Human respiratory tract model for radiological protection. A report of a Task Group of the ICRP. Ann. Int. Conf. Radioact. Prot. 32 (3-4):1–482.
- Karg, E. 1993. Modeling of an aerosol transport system. J. Aerosol Sci. 24 (Supplement):S511–S12. doi:10.1016/0021-8502(93)90348-D.
- Karg, E. W., and G. A. Ferron. 2020. The hygroscopic lung particle deposition model web access. Accessed January 23, 2020. https://www.helmholtz-muenchen.de/cma/forschung/topic-iii-aerosol-physik/projekte/index.html.
- Kittelson, D. B., W. F. Watts, and J. P. Johnson. 2002. Diesel aerosol sampling methodology - CRC E-43, 1-181. Department of Mechanical Engineering, University of Minnesota, Minneapolis, MN.
- Krebs, T. 2019. Automated exposure systems. Accessed March 23, 2019. http://www.vitrocell.com/inhalation-toxicology/exposure-systems/automated-exposure-station.
- Landahl, H. D. 1950. On the removal of air-borne droplets by the human respiratory tract: II the nasal passages. Bulletin of Mathematical Biophysics 12 (2):161–9. doi:10.1007/BF02478251.
- Lee, P. S., T. R. Gerrity, F. J. Hass, and R. V. Lourenco. 1979. A model for tracheobronchial clearance of inhaled particles in man and a comparison with data. IEEE Trans. Biomed. Eng. 26 (11):624–30. doi:10.1109/TBME.1979.326544.
- Lenz, A. G., E. Karg, B. Lentner, V. Dittrich, C. Brandenberger, B. Rothen-Rutishauser, H. Schulz, G. A. Ferron, and O. Schmid. 2009. A dose-controlled system for air-liquid interface cell exposure and application to zinc oxide nanoparticles. Particle and Fibre Toxicology 6:32. doi:10.1186/1743-8977-6-32.
- Leskinen, J., M. Ihalainen, T. Torvela, M. Kortelainen, H. Lamberg, P. Tiitta, G. Jakobi, J. Grigonyte, J. Joutsensaari, O. Sippula, et al, 2014. Effective density and morphology of particles emitted from small-scale combustion of various wood fuels. Environ. Sci. Technol. 48 (22):13298–306. doi:10.1021/es502214a.
- Lucci, F., N. D. Castro, A. A. Rostami, M. J. Oldham, J. Hoeng, Y. B. Pithawalla, and A. K. Kuczaj. 2018. Characterization and modeling of aerosol deposition in Vitrocell® exposure systems - exposure well chamber deposition efficiency. J. Aerosol Sci. 123:141–60. doi:10.1016/j.jaerosci.2018.06.015.
- Merck. 2019. 16HBE14o-Human bronchial epithelial cell line. Accessed July 19, 2019. http://www.merckmillipore.com/DE/en/product/16HBE14o-Human-Bronchial-Epithelial-Cell-Line,MM_NF-SCC150.
- Molgat-Seon, Y., C. M. Peters, and A. W. Sheel. 2018. Sex-differences in the human respiratory system and their impact on resting pulmonary function and the integrative response to exercise. Curr. Opin. Physiol. 6:21–7. doi:10.1016/j.cophys.2018.03.007.
- Mülhopt, S., T. Krebs, and H. R. Paur. 2008. Online dose determination for in vitro experiments with nano particles in the Karlsruhe exposure system. Toxicol. Lett. 180:S224. doi:10.1016/j.toxlet.2008.06.103.
- Mülhopt, S., M. Dilger, S. Diabaté, C. Schlager, T. Krebs, R. Zimmermann, J. Buters, S. Oeder, T. Wäscher, C. Weiss, et al, 2016. Toxicity testing of combustion aerosols at the air–liquid interface with a self-contained and easy-to-use exposure system. J. Aerosol Sci. 96:38–55. doi:10.1016/j.jaerosci.2016.02.005.
- Oeder, S., O. Sippula, T. Streibel, H. Paur, S. Muelhopt, J. M. Arteaga-Salas, H. Harndorf, R. Zimmermann, C. B. Schmidt-Weber, and J. T. M. Buters. 2014. Immunological effects of ship diesel emissions in on-line exposed human bronchial epithelial cells. Allergy 69:454.
- Oeder, S., T. Kanashova, O. Sippula, S. C. Sapcariu, T. Streibel, J. M. Arteaga-Salas, J. Passig, M. Dilger, H.-R. Paur, C. Schlager, et al, 2015. Particulate matter from both heavy fuel oil and diesel fuel shipping emissions show strong biological effects on human lung cells at realistic and comparable in vitro exposure conditions. PLoS One 10 (6):e0126536. doi:10.1371/journal.pone.0126536.
- Pagels, J., A. F. Khalizov, P. H. McMurry, and R. Y. Zhang. 2009. Processing of soot by controlled sulphuric acid and water condensation: Mass and mobility relationship. Aerosol Sci. Technol. 43 (7):629–40. doi:10.1080/02786820902810685.
- Park, K., F. Cao, D. B. Kittelson, and P. H. McMurry. 2003. Relationship between particle mass and mobility for diesel exhaust particles. Environ. Sci. Technol. 37 (3):577–83. doi:10.1021/es025960v.
- Paur, H.-R., F. R. Cassee, J. Teeguarden, H. Fissan, S. Diabate, M. Aufderheide, W. G. Kreyling, O. Hänninen, G. Kasper, M. Riediker, et al, 2011. In-vitro cell exposure studies for the assessment of nanoparticle toxicity in the lung—A dialog between aerosol science and biology. J. Aerosol Sci. 42 (10):668–92. doi:10.1016/j.jaerosci.2011.06.005.
- Phillips, J., B. Kluss, A. Richter, and E. D. Massey. 2005. Exposure of bronchial epithelial cells to whole cigarette smoke: Assessment of cellular responses. Altern. Lab. Anim. 33 (3):239–48. doi:10.1177/026119290503300310.
- Pich, J. 1972. Theory of gravitational deposition of particles from laminar flows in channels. Aerosol Sci. 3 (5):351–61. doi:10.1016/0021-8502(72)90090-0.
- Savi, M., M. Kalberer, D. Lang, M. Ryser, M. Fierz, A. Gaschen, J. RičKa, and M. Geiser. 2008. A novel exposure system for the efficient and controlled deposition of aerosol particles onto cell cultures. Environ. Sci. Technol. 42 (15):5667–74. doi:10.1021/es703075q.
- Schmid, O., E. Karg, D. E. Hagen, P. D. Whitefield, and G. A. Ferron. 2007. On the effective density of non-spherical particles as derived from combined measurements of aerodynamic and mobility equivalent size. J. Aerosol Sci. 38 (4):431–43. doi:10.1016/j.jaerosci.2007.01.002.
- Stapleton, K. W., W. H. Finlay, and P. Zuberbuhler. 1994. An in vitro method for determining regional dosages delivered by jet nebulizers. J. Aerosol Med. 7 (4):325–44. doi:10.1089/jam.1994.7.325.
- Stone, K. C., R. R. Mercer, P. Gehr, B. Stockstill, and J. D. Crapo. 1992. Allometric relationships of cell numbers and size in the mammalian lung. Am. J. Respir. Cell Mol. Biol. 6 (2):235–43. doi:10.1165/ajrcmb/6.2.235.
- Thomas, J. W. 1958. Gravity settling of particles in a horizontal tube. J. Air Pollut. Control Assoc. 8 (1):32–4. doi:10.1080/00966665.1958.10467825.
- Tippe, A., U. Heinzmann, and C. Roth. 2002. Deposition of fine and ultrafine aerosol particles during exposure at the air/cell interface. J. Aerosol Sci. 33 (2):207–18. doi:10.1016/S0021-8502(01)00158-6.
- Upadhyay, S., and L. Palmberg. 2018. Air-liquid interface: Relevant in vitro models for investigating air pollutant-induced pulmonary toxicity. Toxicol Sci. 164 (1):21–30. doi:10.1093/toxsci/kfy053.
- Weibel, E. R. 1963. Morphometry of the human lung. Berlin: Springer Verlag.
- Winkler-Heil, R., G. Ferron, and W. Hofmann. 2014. Calculation of hygroscopic particle deposition in the human lung. Inhal. Toxicol. 26 (3):193–206. doi:10.3109/08958378.2013.876468.
- Yeh, H.-C., and G. M. Schum. 1980. Models of human lung airways and their application to inhaled particle deposition. Bull. Math. Biol. 42 (3):461–80. doi:10.1016/S0092-8240(80)80060-7.
- Yu, C. P., and C. K. Diu. 1982. A comparitive study of aerosol deposition in different lung models. Am. Ind. Hyg. Assoc. J. 43 (1):54–65. doi:10.1080/15298668291410891.
- Zhang, H., and G. Papadakis. 2010. Computational analysis of flow structure and particle deposition in a single asthmatic human airway bifurcation. J. Biomech. 43 (13):2453–9. doi:10.1016/j.jbiomech.2010.05.031.
- Zhang, L., B. Asgharian, and S. Anjilvel. 1997. Inertial deposition of particles in the human upper airway bifurcations. Aerosol Sci. Technol. 26 (2):97–110. doi:10.1080/02786829708965417.
- Zhang, Z., C. Kleinstreuer, C. S. Kim, and A. J. Hickey. 2002. Aerosol transport and deposition in a triple bifurcation bronchial airway model with local tumors. Inhal. Toxicol. 14 (11):1111–33. doi:10.1080/08958370290084809.
- Zierenberg, J. R., D. Halpern, M. Filoche, B. Sapoval, and J. B. Grotberg. 2013. An asymptotic model of particle deposition at an airway bifurcation. Math. Med. Biol. 30 (2):131–56. doi:10.1093/imammb/dqs002.