
 ?Mathematical formulae have been encoded as MathML and are displayed in this HTML version using MathJax in order to improve their display. Uncheck the box to turn MathJax off. This feature requires Javascript. Click on a formula to zoom.
Abstract
In this study we report polarization resolved intensity measurements for flyash and water aerosol, respectively, in an industrial stack like environment, for the purpose of developing a methodology for in-situ PM measurements in wet stacks. Flyash and water aerosols up to 4 mass concentration were seeded in a lab scale simulated industrial stack operated at velocities up to 15 m/s. Scattering of non-polarized (NP) and horizontally polarized light by these two aerosols were observed at
back-scatter and
forward-scatter angles for horizontal and vertical polarization states at the detector. Complete depolarization of horizontally polarized incident light was observed for ash at
while negligible effects were observed for water. Thus the cross-polarization measurement in this angle, where the scattering energy from the mixed flow could directly represent the flyash concentration, can be the best possible measurement configuration for minimizing the impact of interference from water carryover in industrial emission stacks. Further, the change in depolarization ratio of the mixture (δm) when compared to flyash (δa) alone is proportional to the scattering intensity ratios of ash and water, respectively, and could be used to estimate the individual mass concentrations. With this development, we could propose the design of an instrument that can in-situ correct for errors from counting water droplet, and also enable real time estimation of individual mass concentrations.
Copyright © 2020 American Association for Aerosol Research
EDITOR:
1. Introduction
Opacity monitors based on optical extinction and other scattering based instruments are commonly employed for stack dust monitoring where, extinction based measurement is preferred when the dust loading is high and scattering based instruments are preferred when the loading is low. Both extinction and scattering are particularly advantageous as measured intensities at the detector are insensitive to the surface morphology or the type of aerosol. All current dust-monitoring instruments deployed in-situ are insensitive to the type of aerosol measured, enabling it to be applied across industries. However, when optical monitoring systems are used for stacks downstream of wet-scrubbers, its outputs are influenced by the presence of moisture. Though wet scrubbers employ mist eliminators to limit the carryover of moisture, droplet carryover still ranges from 0.02 to 3.0 g/acf (0.7 to 106 ) (Marot Citation1982). Even for well designed systems with high removal efficiency, carry over is of the order of 50 to 100
As PM emission limitations worldwide are currently above this value, water carryover has not yet been considered as a problem in monitoring. However, there is a move toward lower limits due to well-known effects of PM emission on health and climate change. Emissions regulations, either in force or proposed, across the the world is listed in the following (Zhang Citation2016; EPA Citation2014; CPCB Citation2017).
Table 1. Emission norms across the countries.
Once the changes in emission limits comes into regulation, current continuous emission monitoring systems (CEMS) will be unable to indicate the true value of emission due to the interference from presence of droplets or water aerosol along with other PM emissions. For example, an optical measurement system such as those based on extinction or forward scattering will continue to register moisture carryover as reportable PM emission. Similarly, sensors using the triboelectric principle will report errors due to changes in dielectric constant of water aerosol as opposed to flyash. To overcome this problem, Durag (Model No. DR820F) has proposed an extractive solution, where a flue gas sample is extracted and heated before using optical extinction for measurement. Though this technique provides a work-around, it is prone to errors due to sampling and dilution. Currently, there are no in-situ real-time measurement techniques that can measure the flyash concentration insensitive of water carryover. In-situ measurements are preferred due to lower cost of ownership of the system and avoidance of isokinetic sampling requirements as the later introduces errors in measurement, especially at stack velocities >15 m/s.
Light scattering offers a viable option to develop an in-situ dust monitor for wet stacks, provided it has the ability to be insensitive to the presence of carryover moisture. The focus of this study is to establish the difference in light scattering behavior between water and flyash aerosol, respectively, with the objective to develop an in-situ CEMS for wet stacks. Light scattering by aerosols are defined by the Mueller matrices and Stokes vectors (Bickel and Bailey Citation1985), where the Mueller matrix is used to completely specify the optical components of the system. The state of source or detected light is specified by Stokes vector, where, I is the total intensity, Q is the difference between the horizontally and vertically polarized light intensity, U is the difference between
and
polarized intensities and V is for difference between left handed and right handed circularly polarized intensities. Light with wavelength λ, with characteristics as described by the incident Stokes vector, interacts with the unknown optical element being investigated known as the “scatterer.” Scatterers, which could be dust, smoke, or any other particulate matter suspended in air or water, mixes the incident polarization state producing an azimuthal angle (θ) dependent mixed final Stokes vector whose intensity is measured at the detector. Using Stokes parameter, the scattering process for monochromatic beam of light by a collection of arbitrary particles can be described by 4 x 4 scattering matrix (van de Hulst Citation1981). For uniformly randomly oriented particles having negligible opportunities for multiple scattering, the scattering matrix has the simple form as shown below:
If the particles are homogeneous and spherical in shape, the scattering matrix has only four independent elements as shown below:
The elements of the scattering matrix can be derived from the measured intensity, once the details of incident and detected Stokes vectors are known, including the characteristics of the optical components used. Analysis of the elements of the scattering matrix further reveals the nature of the scatterer in response to incident light. Typically a detector is setup to measure the total intensity of light scattered from the illuminated sample. These intensity measurements are used to estimate the matrix elements as there exists specific relationship between the two. However, in most cases, the intensity values are directly used to study the behavior of the scatterer. Iannone et al. (Citation2011), used the ratio of scattered intensities, called the polarization ratio, for studying the effect of polarized light on scattering by absorbing and non-absorbing particles. They had also defined the depolarization ratio as
In these representations, the first and second subscripts denote the polarization planes of incident light and detected signals, respectively.
By using the matrix elements, Sassen and Liou (Citation1979) studied the depolarization behavior of ice crystals and water droplets in a cloud chamber to identify the characteristics of scattering of spherical and irregular particles. Similarly, polarization ratio approach was used by Weinert et al. (Citation2003) to distinguish between smoke aerosols from flaming and non-flaming sources. Another parameter called the sphericity index (SPX) was used to differentiate between spherical and non-spherical aerosol qualitatively by measuring the variation in scattering intensities across azimuthal angles in a purpose built chamber (Dick, Mcmurry, and Bottiger Citation1994; Sachweh, Dick, and McMurry Citation1995).
Extensive previous studies show that light scattering properties of the scatterer, such as depolarization, refractive indices, sphericity, etc., can be used to differentiate different aerosols. However, a comparison between flyash and water is not extensively dealt with. Muñoz et al. (Citation2001) described the scattering matrix of ash aggregates in comparison with other compact particles such as clay. They found that the back scatter signals are strong, which may be attributed to the shape of the ash particles. Similarly, Kuik, Stammes, and Hovenier (Citation1991) experimentally determined the elements of the scattering matrix for water to compare it with irregularly shaped particles such as SiO2.
In order to apply these concepts to develop a product capable of measuring flyash in wet stacks, it is necessary to explore the behavior of these aerosols in a stack like environment. In addition, the scattering intensity ratios (polarization and depolarization) need to be studied for flyash and water aerosol to identify suitable measurement regimes. In this study, the light scattering intensity ratios of flyash and water aerosol fed into a stack is evaluated for different azimuthal angles. These intensity ratios are then used to identify the depolarization behavior of flyash and water, which are then used to define a methodology for inversion of data from mixed flow measurements.
2. Experimental methodology
Light scattering experiments were performed for determining the response of the flyash and water aerosol, respectively, at different azimuthal angles to polarized incident light, at flow and aerosol loading conditions similar to a typical industrial stack. Polarization states of incident light is measured with respect to the plane where scattering intensities of the aerosol is measured. In this study, a horizontal scattering plane is used and the subscripts “H” and “V,” denote co-planar and orthogonal polarization planes respectively. Further, the double subscripts used here are “HH, HV, VH and VV” in which the first subscript denote polarization state of the source optics and the second subscript is for the detection side.
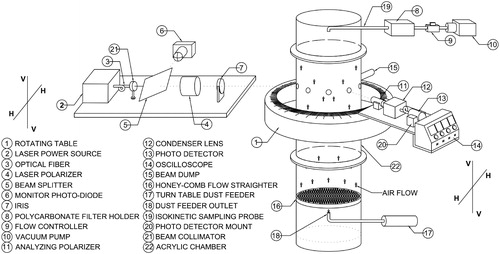
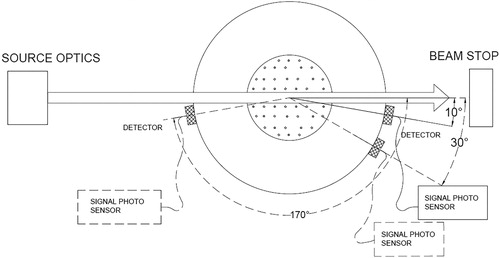
These experiments were performed in an experimental facility as shown in , where in the measurement zone, identified by the rotating table and other optical components, 16 sight ports are present for measurement of light scattering at various azimuthal angles and 2 sight ports for laser light to pass through. Further, the hot wire anemometer measurement port is present at about 8 diameters downstream of the honeycomb, particles injection point on the stack and 4 diameters upstream of the exhaust bend (USEPAMethod11, Citation1996). The isokinetic gravimetric sampling port is at the same vertical location as hot wire sampling, to ensure correct representation of aerosol concentration in the flow field. The sampling probe can traverse across the cross-section, up to the center-line of the stack through two slots which are at to each other. Variable airflow with a maximum of up to 28
is attained by suction using a VFD (variable frequency drive) driven centrifugal blower operating from 25 Hz to 50 Hz. At the bottom of the stack, 8 slots were cut in the peripheral wall and wrapped with aluminum meshes to prevent large objects from entering. It also has an access port, which can be opened to collect and weigh the excess dust settled without being transported in the stack.
Figure 1. The experimental facility consisted of a stack and systems for optical measurement, gravimetric sampling, aerosol feeding and data acquisition, respectively. The stack (6 m high and 20 cm circular cross-section) is operated in once through mode, where the stack velocity and aerosol feed rate is varied to change the concentration of the aerosol.
2.1. Systems for optical measurement: Light source and detector
Green laser was used as light source and the scattered light signal was detected using photo multiplier tube (PMT, ANDOR Technology, Belfast [ACC-SR-ASM-0047]). The laser is rated at 555.2 mW maximum rated power, with output power ranging from 60 mW to 555.2 mW. Measurements were made at approximately 350 mW. The collimated light beam is sent through a
beam splitter and further polarized with reference to the scattering plane. One half of the beam passes through the measurement section and the other onto a monitor photo diode to provide baseline reference for laser power output. To reduce intensity variations, the beam going toward the test section had an iris with an aperture of diameter 0.5 mm. The current optical system includes 16 apertures for detection and 2 apertures for laser to pass through the aerosol medium and then to light trap. The scattered signal, after passing through a polarizer is collected by a condensing lens (f = 12 mm) and coupled to the PMT using an optical fiber. The detection optics described above can be rotated around the scattering chamber at discrete scattering angles. Most results reported in this study, involved measurement at
forward scatter and
back scatter angles, which are also considered for polarization measurement.
2.2. Data acquisition system
Optical fiber, coupling the scattered signal to the PMT, was connected to Wave Runner 6100 A oscilloscope. The scattered signal from the particles was sampled at 1 MHz per channel and the amplitude was averaged over the duration of pulse (1 s) to reduce the effect of random noise. The experiments were conducted for 1 MHz, 10 MHz, and 25 MHz sampling rates and an acceptable signal to noise ratio (SNR) was obtained above 1 MHz sampling rate. Hence, 10 million data points were recorded for each experimental run and the PMT output was averaged over the entire signal pulse above the threshold (where the threshold was defined as of the reference signal recorded with the flow but without the aerosol).
The beam size at the source was maintained to 0.5 mm diameter using an aperture. Factoring in 20% of beam size to be containing scattering information amounts to 100 µm beam diameter. The velocity maintained in the stack was of the order of 10 m/sec which is equivalent to 10 thereby providing a 10 µsec residence time for particles in the laser beam. To resolve the velocity, sampling rate should be the inverse of residence time. For one particle in the beam, it is 100 kHz. Ten particles can be accommodated in the beam, as the particle size is of the order of 10 µm leading to a minimum required sampling rate of 1 MHz. However, there are more particles than geometrically considered here. Hence a minimum sampling rate of 1 MHz was considered, factoring in concentration and velocity effects. The measured signal was the average of total energy scattered by particles, which was then related to the concentration of particles in the scattering volume through isokinetic gravimetric sampling.
2.3. Aerosol generation
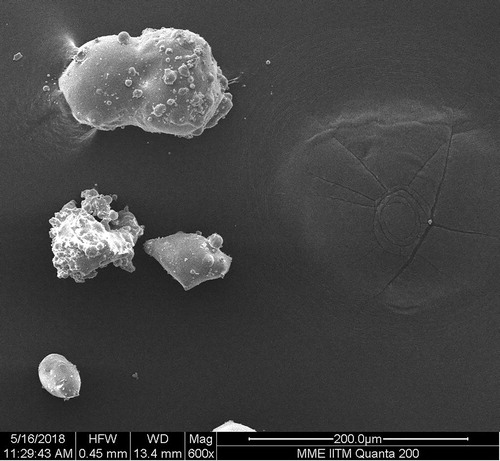
The water and flyash aerosols examined in this study were generated using a pressure jet nozzle driven using pressurized water tank and turn table dust feeder, respectively. The turntable of the dust feeder (see ) was driven using a variable frequency drive to deliver different feed rates. The target range of feed rate was 30 mg/min to 100 mg/min of flyash. Dust particles (see ) used in this study were collected from the last stage of an electrostatic precipitator (ESP) from a thermal power plant. Water aerosols were generated using a Delavan WDA type hollow cone spray nozzle ( spray angle), delivering 2.16 LPH, 4.32 LPH, and 6.15 LPH at 3, 5, and 10 barg, respectively.
Figure 2. Turntable dust feeder with venturi aspirator. The diameter of the turntable is 30 cm with the groove size 10 mm wide and 1 mm deep in which dust was fed through gravity from the rotating dust reservoir, which was then picked up by the venture nozzle. The venture nozzle operated at a pressure of 3 barg to deliver approximate feed rate of 70 mg/min at 10 rpm.

Figure 3. SEM micrograph for sampled flyash aerosol, where particles are seen to be agglomerated and irregular in shape as compared to water droplet which is expected to be spherical.
2.4. Characterization of the stack
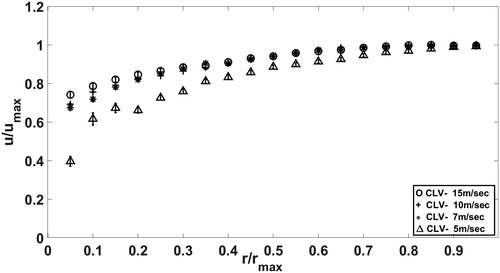
The performance of the stack can be characterized in terms of its velocity profile and dust loading rate. shows the normalized velocity profile, where the flow across the stack cross-section is fairly uniformly distributed with a nearly flat-head velocity profile, indicative of fully developed turbulent flow.
Figure 4. Velocity profile in the stack (turbulent regime ()). A constant temperature anemometer (DANTEC DYNAMICS-54T42, 55P11) was used to characterize the velocity profile in the stack where the center line velocity varied from 5-15 m/sec.
Gravimetric iskokinetic sampling (on a glass fiber filter [pore size= 1.2 µm]) method was used to measure flyash concentration. A sampling probe procured from Polltech Instruments pvt. Ltd. (Model PEM-SMS4) was inserted into this section to sample dust for concentration measurement and size distribution measurement to correlate with the light scattering data. Sample from the duct drawn using an iso-kinetic probe was coupled to a 47 mm filter holder, in which a glass fiber filter thimble was used to collect flyash from every experimental run. The filter outlet further connects to a flow meter and then to a vacuum pump to maintain iso-kinetic sampling conditions. Samples were collected for 5 min and the glass fiber filter was weighed before and after the sampling using OHAUS (EX225/AD) weighing machine with 0.01 mg resolution. The flyash concentration () in the duct was obtained by combining the loading rate (mg/min) and the air flow rate (
) in the duct. The time averaged output of the dust feeder was maintained consistently and different levels up to 100 mg/min was obtained by varying the turn table RPM. A typical example is shown in , where the stability of the dust feeder output is demonstrated for various stack velocities at 10 RPM, so that the variation in light scattering intensity measurement is not due to the changes in dust feeder output. The concentration in the tunnel could be either varied by changing the stack velocity or the RPM of the dust feeder ().
Figure 5. Sampling flyash at different conditions. Turntable speed: 10 RPM, stack velocities: L2 and L3 are the two sampling locations in port P1 as shown in the figure. The dotted line is the total amount of dust supplied to the wind tunnel from dust feeder (initial dust in reservoir - final dust in the reservoir - collection from bottom of tunnel).
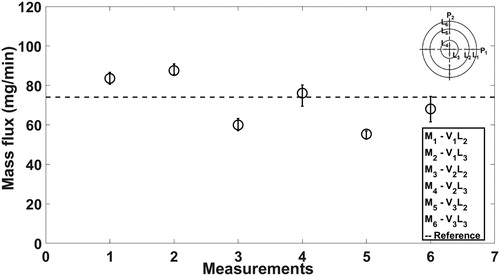
Figure 6. Gravimetric sampling measurement at different feed rates: concentration () vs. flow rate at different feed rate (changed by changing the RPM of the dust feeder). The slope of the curve is constant implying that as the flow rate is increased the concentration of the dust in the tunnel decreases.
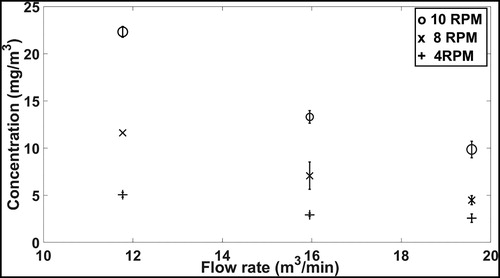
Figure 7. Schematic of the optical components configuration while at forward scatter angle, and
back scatter angle. It shows position of the light source or laser and the detector used for scattered light measurement at different angles.
3 Results and discussion
3.1. Polarization studies
The effect of polarization of incident light on the scattering medium can be evaluated from the detected intensities and from the elements of the scattering matrix. Various studies (Muñoz et al. Citation2001, Citation2010) have attempted to evaluate the elements of the scattering matrix for different particles such as clay, water, ice crystals, ash (from different sources), etc., to bring out the differences. A typical parameter used to differentiate is the ratio of diagonal elements which represents the ability of scattering medium to depolarize a linearly polarized incident light. Ideally this ratio is one for spherical particles. Evaluation of the ratio requires determination of the scattering matrix elements.
3.1.1. Evaluation of scattering matrix elements
The scattering signals received at the detector (detector intensities) could be used to evaluate the elements of the scattering matrix as per the procedure described in Bickel and Bailey (Citation1985). The matrix element F11 can be identified with measured detector intensity (INP) for non-polarized incident light and detected in the same state. However, the effect of optical properties of the polarizer is not reflected in the INP measurements. Hence it would be ideal to evaluate the ratios using identical optical trains. The following procedure is used in this study, which has also been employed by Holland and Gagne (Citation1970) in their study of scattering by polydisperse irregular aerosols.
(1)
(1)
These set of algebraic equations can reduced to obtain as shown below:
(2)
(2)
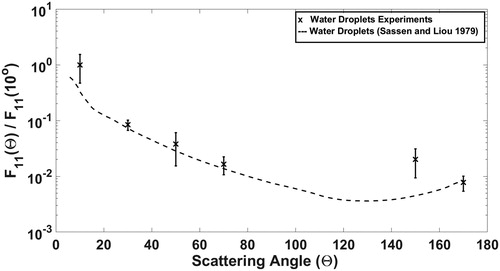
To ensure that the scaling up of experimental facility does not influence the physics, measurements from this study are compared with experimental studies such as those by Sassen and Liou (Citation1979), who studied the angle dependent scattering behavior of water droplets and ice crystals (see and ). The ratio is used to compare the angle dependant scattering behavior of spherical droplets. The ratio decreases as the measurement angle moves from forward to back scattering regime, which is expected based on Mie theory. Similarly,
could be used directly to compare and differentiate different aerosols.
Figure 8. Normalized Phase function F11 derived from experiment for water droplets in comparison with Sassen and Liou (Citation1979).
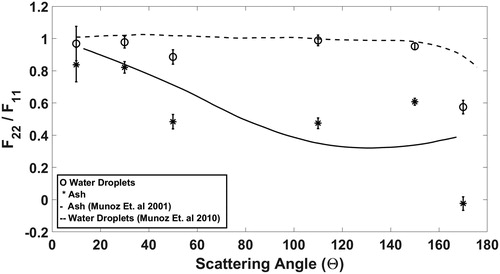
compares the ratio for flyash and water aerosol from this study with the results obtained for flyash and water aerosol from a test facility built specifically for evaluating the matrix elements by Muñoz et al. (Citation2001, Citation2010) and Muñoz and Hovenier (Citation2011). The results from this study agrees well with the water data from above cited literature, which indicates that the particles are following far field approximation, hence, single scattering. There are some deviations in ash, which could be attributed to changes in characteristic of ash (sphericity, refractive index) and the wavelength of the light sources. To reduce the probabilistic multiple scattering events, a controlled aperture at the source and detection optics was used during all the measurements in this study. Even, after accounting for these variations in experimental conditions, the trends in ash measurements are similar to those of Muñoz et al. (Citation2001) which indicates that the depolarization phenomenon that is seen in case of flyash involves rotation of polarization of incident light through the internal and surface micro-physical properties of the particles and is not generated by virtue of inter-particle scattering.
Figure 9. Variation of with scattering angle for water droplets and flyash aerosol. Comparison with experimental data from Muñoz et al. (Citation2001, Citation2010).
One of the main challenges with using the is the assumption of negligible multiple scattering, which could be invalid at higher aerosol concentrations. However, it can be seen from these studies that flyash, and in general irregular, poly disperse aerosols, deviate from spherical particle behavior, which is not unexpected as the ratio is unity only for perfectly spherical particles. Measuring at scattering angles where the non-ideal behavior is amplified (such as in back scattering) could enable selective measurement of fly ash against water aerosol. However, evaluating the scattering matrix would need measurement of many intensities simultaneously, which may not be practical in design of a field instrument. Bickel and Bailey (Citation1985) suggested the use of measured intensity ratio as an alternative to the ratios of matrix elements. Also, an observation of EquationEquation (2)
(2)
(2) reveals that the source of this variation is the
term.
ratio can be unity for water aerosol only when
term is negligible in comparison to the first term in EquationEquation (2)
(2)
(2) . Hence a depolarization parameter based on intensity ratios (δ) can defined as
which can be used to identify the aerosol type (Sakai et al. Citation2010; Iannone et al. Citation2011).
3.1.2. Depolarization ratio from intensity measurements
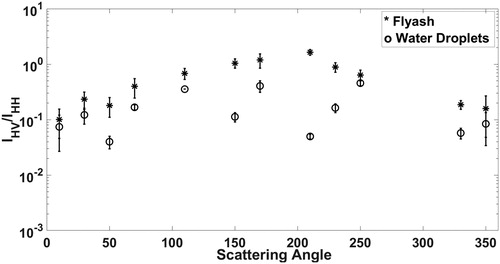
Once the stack is calibrated for flow and the detector responses for non-polarized (NP) incident light is correlated with the dust and water aerosol loading rate, the next set of measurements focused on the detector response for horizontally polarized incident light. Response is measured for both horizontal and vertical polarization states at the detector. The depolarization ratio (δp) is a suitable metric to distinguish between dust and water aerosol due to the fundamental difference in their scattering mechanisms. This ratio is only dependent on the scattering azimuthal angle and surface features of the aerosol. It is independent of particle size, as for particles much larger than the wavelength of incident light, only the surface features of aerosol affect the ratio (Nousiainen et al. Citation2012). Depolarization ratio is also useful to eliminate the convolution terms that are common to both measurement conditions, especially when comparing different angles, thereby eliminating the need for correction factors for every angle of measurement (Heller and Witeczek Citation1970). From , it can be seen that the depolarization ratio increases with increase in scattering angle θ, as contributions from diffraction diminishes and those from internal scattering and surface reflection begin to dominate in the back scattering regime. It can also be noted that the for water, the depolarization is less than 10% while for ash, it is nearly 100% for all back scattering angles. In forward scattering, the ratios are nearly identical for both water and ash due to diffraction dominated scattering behavior, which is only determined by size of the aerosol. In side scattering, though the ratio appears to be unity, the signal strength is however very low for water as compared to the forward scattering. At the back-scattering angles, represented from to
ash retains a fairly consistent scattering intensity irrespective of polarization states. For water aerosol, the total scattering intensities are about an order of magnitude lower than ash despite similar loading rates. Typically, the scattering intensity data is expected to be symmetric about
However, a finite viewing angle coupled with high dust loading and the difficulty in locating a perfect mirror image about
during experimental measurements contribute to slight asymmetry in the data.
Figure 10. Polarization ratio for water and flyash aerosol ().
In forward scattering angles, both water and flyash aerosols exhibited higher signal intensities for co-polarization (HH) and significantly lower intensities for cross polarization (HV) configurations. In addition, the scattering polar diagram is insensitive to shape and refractive index in forward scatter direction (Card and Jones Citation1991). However, back scattering intensities for ash particles were consistently higher as non spherical/irregular particles scatter more in back-scatter direction than do spheres and it is essentially a function of orientation of the non-spherical particle. David et al. (Citation2013) studied the polarization resolved exact light back-scattering in an ensemble of particles in air at for spherical water droplets and non spherical salt aerosol with UV light. They performed the measurements in a quiescent conditions to simulate atmospheric conditions and observed that the water aerosols maintains incident polarization and δ is nearly zero. In this study,
is the smallest back-scatter angle measured as azimuthal angle variation is available in
increments in the test rig. In forward-scatter angles (
and
), variation in δ for both flyash and water is significant. However, this difference persists only for water in back-scatter (
) angle. Back scattering at
and
could also be used for polarization resolved measurement as seen from . But exact back scattering angle has been preferred in most studies in literature for polarization resolved measurements. This selective depolarization of light in the back-scatter angle could be used to distinguish water and flyash aerosol. This is also evaluated by Mishchenko, Travis, and Lacis (Citation2002) and Nousiainen (Citation2009), who reported that among all scattering directions, the exact back scattering direction is one of the most sensitive to the particles micro-physical properties. They had also observed that the roughness effects on degree of depolarization is more pronounced in the backward scattering regime as compared to forward scattering regimes and the effect is pronounced for larger sized particles.
From the perspective of instrument building, angles close to exact back-scattering is preferred due to convenience of packaging in a single transceiver package. Hence, was selected for further analysis. Nevertheless, the discussions on methodology presented in following sections of the article would still apply to the other angles well. In this study we found that in back-scatter angles, the scattered intensity in the cross polarization (HV) configuration was about
th of the HH configuration for water aerosol, while for flyash particles δ is nearly 1, as would be expected given the nature of the particles.
3.1.3. Considerations in mixed flows
In industrial stacks with FGDs, large particles are removed using dust collection systems as they foul with the scrubbers used for desulphurization. Any ash particles that are likely to be encapsulated by the water droplets are eliminated by mist eliminators after the FGD unit. Hence, the carryover after the mist eliminator is likely to be droplets without any encapsulated particles and the flyash particles that are not eliminated at the dust collector or the scrubber. Thus, this external mixture can be considered to be a non-interacting mixture of spherical and non-spherical particles. Therefore, the total particle backscattering energy (of the mixture, Em) is represented by the sum of spherical (Es) and non spherical (Ens) backscattering energy:
(3)
(3)
When the polarization axis is parallel at the source and the detection optics, both Es and Ens contribute to the backscattering energy, while when they are orthogonal to each other only the non-spherical particles contribute to the backscattering (David et al. Citation2013).
(4)
(4)
From these considerations, it can be argued that data from measurement of each aerosols independently may be used for predicting the behavior of mixed flows. In a simulated industrial stack in the lab, one of the challenge is the scrubbing effect of water, which removes flyash, thereby making it difficult to compare with and without water injection. Cold flow conditions could also alter the behavior of mixture flow in the stack. Hence, in this study, the scattering energies are partitioned into contributions from spherical and non-spherical aerosols and each of them are studied independently.
3.2. Application in stack monitoring
Aerosol concentration in the stack was measured using iso-kinetic sampling and calibrated against scattering intensity measurements at various angles. The scattering intensity for flyash and water aerosol is shown to vary with concentration, scattering angle and also the polarization states of incident and detection optics. As per EquationEquation (4)(4)
(4) , in mixed flows, the total scattered intensity of the mixture can be partitioned as follows, where the subscripts m,a,w stands for mixture, ash and water, respectively.
(5)
(5)
where the ratio (
) can be represented as the mixture depolarization ratio (δm). Similarly
Thus the equation can be represented as
(6)
(6)
(7)
(7)
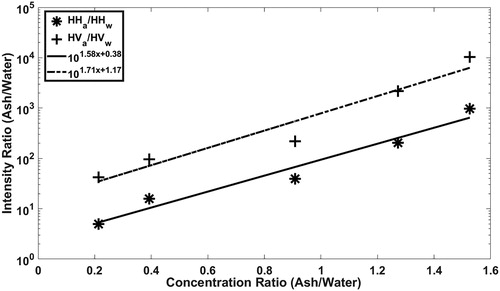
The ratios of scattering intensities for water and flyash aerosol is plotted in for the backscattering angle of against mass concentration ratio of the aerosols. For a given concentration of ash (ma), the intensity ratio decreases as the mass concentration of carryover water aerosol (mw) increases. It is also observed that the intensity ratios between ash and water varies from 2 to 4 orders of magnitude in the cross-polarization measurement, validating the assumption that contribution from spherical aerosol is negligible in this measurement. Hence, the calibration graphs between
vs. ma can be used for directly obtaining the mass concentration of the flyash in stacks. Once the mass concentration of the ash is obtained, it can be used in EquationEquation (7)
(7)
(7) for obtaining the mass concentration of water using the functional relationship between the concentration ratios and intensity ratios. In this study a logarithmic relationship was obtained and it can be substituted in to EquationEquation (7)
(7)
(7) as shown below.
(8)
(8)
Figure 11. Intensity ratio v/s. loading rate ratio (flyash: water droplets): this plot is from the laboratory stack measurements, demonstrating the use of intensity ratios to resolve mixture concentrations at 170° back scatter angle.
In EquationEquation (7)(7)
(7) , the intensity ratio is function the of mass concentration ratios,
As the concentration of water tends to become much larger than ash, δm tends to zero and similarly, it tends to δa as the ash fraction in the mixture dominates. In EquationEquation (8)
(8)
(8) , δm is obtained from stack measurements (
) of mixed flows and δa is a known quantity, which depends on the type of aerosol (spherical and non-spherical) and the angle of measurement. The δa for flyash used in this study is experimentally evaluated and presented in . The functional form relating the intensity ratios to the mass concentration ratios are obtained from scattering intensity measurements for water and flyash aerosol separately. Thus the procedure outlined here can be used for obtaining the mass concentrations of both flyash and water aerosol simultaneously in wet stacks.
4. Conclusion
In this study, we have described a polarization resolved measurement technique to monitor PM emissions in wet industrial stacks. Depolarization of horizontally polarized incident light was observed and quantified for flyash and water aerosol for various azimuthal scattering angles. Complete depolarization was observed for flyash at the back-scatter angle, while water droplets retained the incident state. The phase function (
) and depolarization parameter (
) was estimated from scattering matrix elements (evaluated from the measured intensities) was validated against previous studies performed in small scale and semi-quiescent test rigs to ensure that the light scattering behavior remained similar in the scaled up testing facility used in our studies.
Further, based on partitioning of scattering energies in the back scatter direction, a procedure for quantifying the mass concentrations of both water and fly ash aerosol has been evolved. While there are many depolarization studies with regards to atmospheric aerosol measurement, to our knowledge, this is the first study to present measurement of depolarization in an industrial stack, along with intensity calibration against concentration. The cross-polarization configuration identified here presents a method that is suitable for measuring flyash aerosol in the presence of moisture carryover, thereby providing an alternative to heated probe design, which is currently being used for wet stacks. It is possible to estimate the individual mass concentrations of flyash and water aerosol by measuring depolarization by the mixture and comparing it against depolarization by ash.
Additional information
Funding
References
- Bickel, W. S., and W. M. Bailey. 1985. Stokes vectors, mueller matrices, and polarized scattered light. Am. J. Phys. 53 (5):468–78. doi:10.1119/1.14202.
- Card, J., and A. Jones. 1991. A light scattering method to discriminate between coal and fly ash particles dispersed in air. Combust. Flame 86 (4):394–403. doi:10.1016/0010-2180(91)90132-U.
- CPCB. 2017. Emission standards for stationary sources. https://cpcb.nic.in/uploads/Thermal_Power_Plant_overview.pdf
- David, G., B. Thomas, E. Coillet, A. Miffre, and P. Rairoux. 2013. Polarization-resolved exact light backscattering by an ensemble of particles in air. Opt. Express 21 (16):18624–39. doi:10.1364/OE.21.018624.
- Dick, D., P. H. Mcmurry, and J. R. Bottiger. 1994. Size- and composition-dependent response of the DAWN-A multiangle single-particle optical detector. Aerosol Sci. Technol. 20 (4):345–62. doi:10.1080/02786829408959690.
- EPA. 2014. Emission standards for stationary sources. https://www.epa.gov/air-emissions-monitoring-knowledge-base
- Heller, W., and J. Witeczek. 1970. Experimental investigations on the light scattering of colloidal spheres. viii. brief survey of problems in angular light-scattering measurements and performance of a new type of reflection-free scattering cell. J. Phys. Chem. 74 (24):4241–51. doi:10.1021/j100718a011.
- Holland, A. C., and G. Gagne. 1970. The scattering of polarized light by polydisperse systems of irregular particles. Appl. Opt. 9 (5):1113–21. doi:10.1364/AO.9.001113.
- Iannone, R. Q., R. Morlacchi, R. Calabria, and P. Massoli. 2011. Investigation of unburned carbon particles in fly ash by means of laser light scattering. Appl. Phys. B 102 (2):357–65. URL. doi:10.1007/s00340-010-4315-0.
- Kuik, F., P. Stammes, and J. W. Hovenier. 1991. Experimental determination of scattering matrices of water droplets and quartz particles. Appl. Opt. 30 (33):4872–81. doi:10.1364/AO.30.004872.
- Marot, L. 1982. Entrainment in wet stacks. Final report. [wet vs reheated], Final report. U.S. Department of Energy. https://www.osti.gov/biblio/6950087-entrainment-wet-stacks-final-report-wet-vs-reheated
- Mishchenko, M. I., L. D. Travis, and A. A. Lacis. 2002. Scattering, absorption, and emission of light by small particles. Cambridge: Cambridge University Press.
- Muñoz, O., and J. Hovenier. 2011. Laboratory measurements of single light scattering by ensembles of randomly oriented small irregular particles in air. a review. J. Quant. Spectrosc. Radiat. Transf. 112 (11):1646–57. doi:10.1016/j.jqsrt.2011.02.005.
- Muñoz, O., F. Moreno, D. Guirado, J. Ramos, A. López, F. Girela, J. Jerónimo, L. Costillo, and I. Bustamante. 2010. Experimental determination of scattering matrices of dust particles at visible wavelengths: The iaa light scattering apparatus. J. Quant. Spectrosc. Radiat. Transf. 111 (1):187–96. doi:10.1016/j.jqsrt.2009.06.011.
- Muñoz, O., H. Volten, J. F. De Haan, W. Vassen, and J. W. Hovenier. 2001. Experimental determination of scattering matrices of randomly oriented fly ash and clay particles at 442 and 633 nm. J. Geophys. Res. 106 (D19):22833–44. doi:10.1029/2000JD000164.
- Nousiainen, T. 2009. Optical modeling of mineral dust particles: A review. J. Quant. Spectrosc. Radiat. Transf. 110 (14–16):1261–79. doi:10.1016/j.jqsrt.2009.03.002.
- Nousiainen, T., E. Zubko, H. Lindqvist, M. Kahnert, and J. Tyynelä. 2012. Comparison of scattering by different nonspherical, wavelength-scale particles. J. Quant. Spectrosc. Radiat. Transf. 113 (18):2391–405. doi:10.1016/j.jqsrt.2012.03.032.
- Sachweh, B. A., W. D. Dick, and P. H. McMurry. 1995. Distinguishing between spherical and nonspherical particles by measuring the variability in azimuthal light-scattering. Aerosol Sci. Technol. 23 (3):373–91. doi:10.1080/02786829508965321.
- Sakai, T., T. Nagai, Y. Zaizen, and Y. Mano. 2010. Backscattering linear depolarization ratio measurements of mineral, sea-salt, and ammonium sulfate particles simulated in a laboratory chamber. Appl. Opt. 49 (23):4441–9. doi:10.1364/AO.49.004441.
- Sassen, K., and K. N. Liou. 1979. Scattering of polarized laser light by water droplet, mixed-phase and ice crystal clouds. Part I: Angular scattering patterns. J. Atmos. Sci. 36 (5):838–51. doi:10.1175/1520-0469(1979)036<0838:SOPLLB>2.0.CO;2.
- USEPAMethod1. 1996. Sample points and transverse methods. https://www.epa.gov/sites/production/files/2017-08/documents/method_1_3.pdf
- van de Hulst, H. C. 1981. Light scattering by small particles. Courier Corporation. https://rmets.onlinelibrary.wiley.com/doi/abs/10.1002/qj.49708436025
- Weinert, D. W., T. G. Cleary, G. W. Mulholland, and P. F. Beever. 2003. Light scattering characteristics and size distribution of smoke and nuisance aerosols. Fire Saf. Sci. 7:209–20. doi:10.3801/IAFSS.FSS.7-209.
- Zhang, X. Emission standards and control of PM 2.5 from coal-fired power plant, IEA Clean Coal Centre 978-92-9029-590-7, July, 2016.