
 ?Mathematical formulae have been encoded as MathML and are displayed in this HTML version using MathJax in order to improve their display. Uncheck the box to turn MathJax off. This feature requires Javascript. Click on a formula to zoom.
Abstract
Ground-based observations of black carbon (BC) aerosols were conducted in spring 2017 in Yokosuka City, south of Tokyo, Japan. Equivalent BC (EBC) mass concentrations were measured using a miniaturized, palm-sized filter-photometer (MicroAeth AE51, EBCAE51) and evaluated against those obtained using a continuous soot monitoring system (COSMOS, EBCCOSMOS) and a single-particle soot photometer (SP2, refractory BC, rBCSP2). We propose methods to account for the following key factors affecting AE51 measurements: (1) the non-linearity of light attenuation (ATN) measurements associated with high-particle loading on the filter (i.e., the loading effect); and (2) the positive artifacts in ATN measurements created by non-refractory materials (nonBC) on the filter. To examine these effects, we employed a custom automated system that switches the two sampling lines for the AE51, one of which was heated to 300 °C to minimize the sampling of nonBC. Alternate operation of the heated and unheated modes (for 15 min) enabled the separation of the described effects. Consistent with previous studies, in the heated mode, sensitivity decreased linearly with increases in ATN (−0.44% per ATN) in comparison with the other aethalometers. When the loading effect was corrected for, the EBCAE51 in the unheated mode still showed some bias relative to EBCCOSMOS and rBCSP2. This bias correlated with—and was successfully corrected for using—the mass ratio of nonBC to BC derived from the SP2. This approach can also be applied to fine-mode aerosol (PM2.5) concentrations measured at environmental monitoring networks, thus eliminating the need for additional SP2 data in the data correction.
EDITOR:
Introduction
Soot or black carbon (BC) aerosol particles are formed during the incomplete combustion of fossil fuels and biomass burning and are known as important short-lived climate pollutants (SLCPs). They exert positive radiative forcing by absorbing visible light in the atmosphere (Bond and Bergstrom Citation2006; Bond et al. Citation2013; Kondo Citation2015; Ramanathan and Carmichael Citation2008; Ramanathan et al. Citation2007). Deposited BC reduces the Earth’s surface albedo and accelerates snow and ice melting processes (IPCC Citation2013; Flanner and Zender Citation2006). The adverse effects of BC aerosols on human health have also been investigated (Croft et al. Citation2017; Li et al. Citation2016; Louwies et al. Citation2015).
Atmospheric BC mass concentrations have been observed using filter-based light absorption measurements (i.e., filter photometer), which is one of the most widely used techniques for characterizing BC aerosols. BC derived from light absorption techniques are referred to as equivalent black carbon (EBC) (Petzold et al. Citation2013) as the mass absorption cross-section (MAC) is assumed. Additionally, there are uncertainties related to the particle loading sensitivity relationship, the linearity of light absorption measurements, loading effects (e.g., Virkkula et al. Citation2007), multiple scattering in the filter media (e.g., Arnott et al. Citation2005), and the positive artifacts of light-scattering aerosol particles present on the filter together with BC (e.g., Zanatta et al. Citation2016).
To evaluate these uncertainties, laboratory experiments using the light absorption measurement of BC aerosols have been conducted (e.g., Bond, Anderson, and Campbell Citation1999). The pretreatment of sample air, being heated to 300–400 °C, is considered one of the ways to efficiently minimize the impact of light-scattering aerosol particles on the light absorption measurements (Kondo et al. Citation2011). In recent years, the mass of BC per single BC-containing particle has been quantified using laser-induced incandescence (LII) techniques, which measures the thermal radiation from a particle induced by laser beam absorption (Moteki and Kondo Citation2007, Citation2010; Schwarz et al. Citation2006; Stephens, Turner, and Sandberg Citation2003). Due to its high detection sensitivity, the LII method is considered one of the most reliable analytical techniques available for quantifying BC aerosols. An increasing variety of instruments and techniques has also increased the requirement for suitable evaluation to obtain accurate and consistent concentration datasets to better understand the emission, transport, and removal of BC aerosols (Kanaya et al. Citation2013, Citation2016; Kondo et al. Citation2009, Citation2011; Miyakawa et al. Citation2017).
Some low-cost and/or light-weight instruments have been developed for measuring BC (Caubel, Cados, and Kirchstetter Citation2018; Cheng and Lin Citation2013). For example, a miniaturized, palm-sized aethalometer (MicroAeth AE51, Aethlabs, US), which is a type of filter-photometer, was recently developed and successfully deployed. This equipment has applications in surveying the fine-scale spatial distribution of BC through multi-point or mobile observations in the vicinity of emission sources, and in investigating BC vertical profiles using unmanned aerial vehicles (UAVs) and balloons (Ferrero et al. Citation2011, Citation2014, Citation2016). Viana et al. (Citation2015) evaluated the instrumental errors of the AE51 based on six-unit simultaneous operations with a stationary instrument. Cheng and Lin (Citation2013) evaluated the particle loading effect on the performance of the AE51 using a different aethalometer, possibly affected by light-scattering particles for a limited length of the time. These evaluations remain limited, however, especially with respect to light-scattering particles.
In this study, we compared BC mass concentrations measured using the AE51 with those measured using independent and more accurate instruments, namely a continuous soot monitoring system (COSMOS, Kanomax, Inc., JP) and a single particle soot photometer (SP2, Droplet Measurement Technologies, Inc., US). The uncertainties associated with the AE51 are discussed using datasets obtained from a systematic intercomparison experiment run for almost one month. Based on these data, we propose ways to correct for the particle loading effect and the positive biases resulting from light-scattering aerosol particles.
Materials and methods
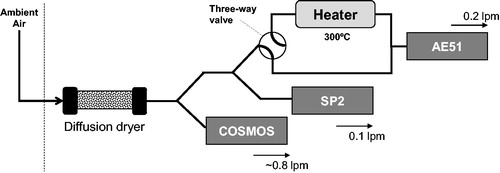
Atmospheric observations were conducted between 12 May 2017 and 2 June 2017 in an industrial area of Yokosuka, approximately 30 km south of Tokyo (35.32°N, 139.65°E, 10 m above sea level, Figure S1 in the online supplementary information [SI]). BC-containing aerosol particles in this area are mainly emitted from both stationary and mobile anthropogenic sources (Kanaya et al. Citation2014; Miyakawa et al. Citation2016). Ambient air was drawn into the instruments through a diffusion dryer (3062, TSI Inc., USA) to dry the sample air, and was then introduced into the three instruments as shown in . As all of the instruments were located behind the diffusion dryer, the possible loss of aerosol particles during the drying process (estimated at approximately 9% loss for the 0.02–0.4 µm particle diameter range, Miyakawa et al. Citation2016) affected each piece of equipment equally.
Figure 1. Flow diagram of the experimental setup.
Single particle soot photometer (SP2)
Masses of BC per single BC-containing particles were quantified using a single particle soot photometer (SP2, Droplet Measurement Technologies ltd., USA). The BC aerosols measured using the SP2 are referred to as refractory black carbon (rBCSP2) in this study (Petzold et al. Citation2013). The wavelength of the laser beam in the SP2 is 1064 nm. This device was used to measure BC with particle diameters ranging from 0.08 to 0.5 µm. The BC mass concentrations of the unmeasured fraction were estimated by fitting a log-normal function to the mass size distribution and via extrapolation (Miyakawa et al. Citation2016). In this study, the estimated unmeasured fraction was 11% on average. BC-free (i.e., light-scattering) particles for the size range 0.15–1 µm were also analyzed using the SP2. Note that we did not perform a correction of BC-free mass concentrations by the extrapolation method, because the shape of the mass size distribution of BC-free particles generally differs from that of BC particles. The device was calibrated using fullerene soot (FS, stock 40971, lot L20W054, Alfa Aesar, USA) particles that were size-selected using a differential mobility analyzer (DMA, model 3081, TSI, Inc., USA) (see Miyakawa et al. Citation2016 for details). The accuracy and precision of the calibration were evaluated to be 4% and 10%, respectively (Miyakawa et al. Citation2016; unpublished data). It was found that most of the BC-containing particles were bare or thinly coated with nonBC materials at the observation site (Miyakawa et al. Citation2017). The mixing state of BC-containing particles was also analyzed, and it was found that most of the BC-containing particles (for the size range 0.15–0.35 µm) were externally mixed with nonBC materials (see Section S2 in SI). Here, we assumed that BC-free (light-scattering) aerosols derived from the SP2 observation represented the main part of the nonBC component. The mass concentrations of nonBC materials are defined as nonBCSP2 and were estimated using the number size distributions of BC-free aerosols assuming a spherical shape and a density of 1800 kg m−3.
Continuous soot monitoring system (COSMOS)
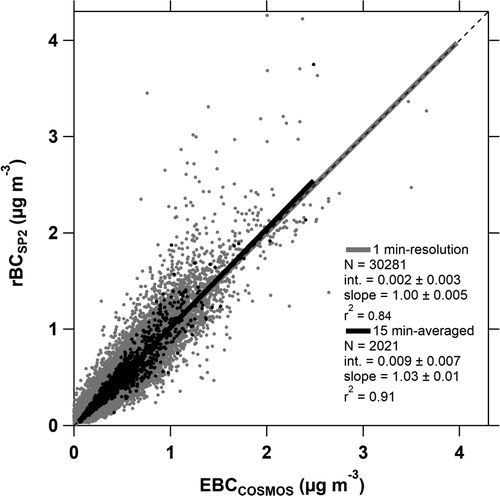
We employed a continuous soot monitoring system, COSMOS (3130, S/N 674245, Kanomax, co., JP) to measure BC mass concentrations. For this, a high-efficiency particulate air (HEPA) filter (L-371M) (Irwin, Kondo, and Moteki Citation2015) was used for the sample collection. Light attenuation at a wavelength of 565 nm was measured both for the samples and reference filters. The flow rate and time resolution of the COSMOS used in this study were approximately 0.8 l per min (lpm) and 1 min, respectively. The temperature of the heater inlet in front of the COSMOS was maintained at 300 ± 3 °C to volatilize nonBC components (Irwin et al. Citation2013; Kondo et al. Citation2011). The BC mass concentrations measured by the COSMOS are referred to as EBCCOSMOS. The uncertainty is 10% (Ohata et al. Citation2019). The COSMOS was calibrated by the manufacturer (Kanomax) before installation. depicts the correlation between EBCCOSMOS and rBCSP2 with a time resolution of 1 min and for the 15-min average. EBCCOSMOS strongly correlated with rBCSP2, being generally consistent with previous studies conducted in both urban and remote areas (Kondo et al. Citation2011; Miyakawa et al. Citation2017; Ohata et al. Citation2019). Therefore, we assumed that the EBCCOSMOS measurements were approximately equivalent to rBCSP2.
Figure 2. Correlation between EBCCOSMOS and rBCSP2 for 1-min (shaded circles) and 15-min average (black circles) datasets. The fitted lines are also shown as bold lines in the corresponding color.
MicroAeth AE51
The MicroAeth AE51 (Aethlabs, USA) is a miniaturized, palm-sized aethalometer (Cheng and Lin Citation2013; Hagler et al. Citation2011) that measures light attenuation (ATN) induced by the accumulation of BC on a filter at a near-infrared wavelength of 880 nm. In this study, we ignored the possible interference of light-absorbing organic carbon (brown carbon, BrC), because BrC has a weak light absorption at the wavelength of 880 nm (e.g., Kirchstetter, Novakov, and Hobbs Citation2004). A glass-fiber (T60 borosilicate) filter coated by Tetrafluoroethylene (TFE), which is also used by other aethalometer models (e.g., AE33; Drinovec et al. Citation2015), is used for sample collection in the AE51. The AE51 was calibrated by the manufacturer (Aethlabs) before installation. The BC mass concentration measured by the AE51 is hereafter referred to as which can be derived using the following equation (Hansen, Rosen, and Novakov Citation1984):
(1)
(1)
where A is the spot area for the sample collection; Q is the sampling flowrate; σ is the MAC (12.5 m2 g−1, Cheng and Lin Citation2013); Δt is the temporal resolution; and ΔATN is the change in ATN in Δt. Here, ATN was calculated as follows:
(2)
(2)
where I and I0 are the signal intensity for the sample spot and a reference blank spot, respectively (Cheng and Lin Citation2013). The AE51 was operated with a Q of 0.2 lpm, a Δt of 1 min, and A was 7.1 mm2. Note that, while it should be considered, particle loading correction (Virkkula et al. Citation2007; Weingartner et al. Citation2003) is not typically included during data processing (Cheng and Lin Citation2013). Therefore, we evaluated this effect using ATN (hereafter referred to as ATNAE51) based on intercomparison experiments. It should also be noted that the typical values of I at the start of sampling (t0) are 15–20% higher than those of I0 at t0, which results in ATNAE51 at t0 being reported as negative values (see Figs. 3 and 5 in Cheng and Lin [Citation2013] and Fig. 1 in Hagler et al. [Citation2011]). When BC aerosols are collected on the filter, I will decrease and then ATNAE51 will increase. In this study, the AE51 was continuously operated to evaluate the practical limit of ATNAE51 levels by exchanging the filters only once or twice per week. The limit of detection (LOD) of the AE51 was evaluated by placing a HEPA filter in front of the instrument to sample particle-free air. The LOD was calculated as the sum of the mean (∼0) and three standard deviations (3σ) of
The LOD and the proportion of negative values of
for different time resolutions are presented in . For a more precise evaluation of the AE51, we analyzed 15-min averaged EBCAE51 for the intercomparison of AE51 with COSMOS and SP2.
Figure 3. (a) Temporal variation of 15-min averaged for heated (
red line in lower panel) and unheated modes (
blue line in lower panel), rBCSP2 (black line and black filled area in lower and upper panels, respectively), and nonBCSP2 (shaded filled area in upper panel, cumulated to rBCSP2) for the entire observation period; (b) as for 3(a) for
and rBCSP2 using the same coloring for the period from00:00 14 May to 10:00 15 May, 2017.
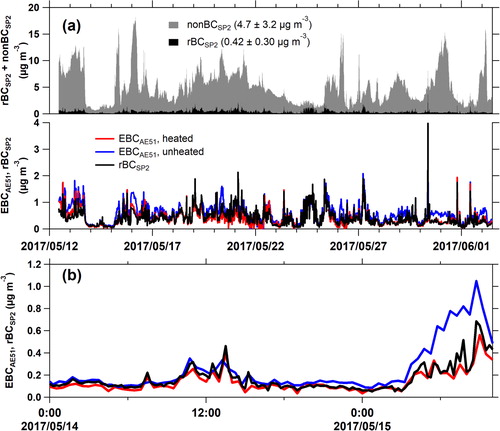
Table 1. Proportion of negative values and LOD of the datasets with a 1-min (raw) resolution and averaging for 2-, 5-, and 15-min durations.
The sampling flowline to the AE51 is comprised of two parts—a heated line with a temperature of 300 ± 2 °C and an unheated line at approximately room temperature (Miyakawa et al. Citation2016). A three-way electric valve (MS-141DCX, Swagelok, Inc., USA) automatically switched the flowlines every 15 min. The heated line was composed of a stainless-steel tube (length = 300 mm; outer diameter = 9.5 mm; inner diameter = 7 mm) and an electric jacket heater (P23, Tokyo Technological Laboratory Co. Ltd., JP) regulated by a temperature controller (TC-3000, AS ONE Corporation, JP). Note that the aerosol particles including nonBC sampled during the unheated mode can affect the ATNAE51 measurements during the proceeding heated mode. To evaluate the impact of such survived nonBC on the filter during the heated mode, we conducted an additional experiment in which the AE51 was continuously operated (under the heated mode) and compared with the COSMOS (see Section S3 in SI). Data points for the first and last minutes of the heated and unheated modes were removed to eliminate invalid data associated with the change in modes. EBCCOSMOS and rBCSP2 data were also divided into heated and unheated mode categories. In all cases, BC mass concentrations are reported at standard temperature and pressure conditions (STP; 0 °C and 1 atm).
Results and discussion
Comparison of BC mass concentrations measured using AE51, SP2, and COSMOS
depicts the temporal variation of rBCSP2, nonBCSP2, and Based on the SP2 measurements, the average mass ratios of BC to nonBC were as low as 0.07 at the observation site during the study period. The temporal variation of
was similar to that of rBCSP2 for both modes ().
in the heated mode (hereafter
) broadly agreed with rBCSP2. However,
in the unheated mode (hereafter
) had higher values than rBCSP2 in some cases (e.g., ). shows the correlations between
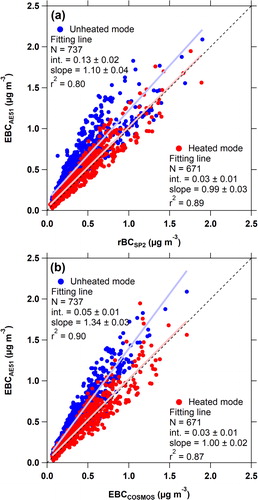
and rBCSP2 and EBCCOSMOS. The linear regression slopes between
and rBCSP2 () were 0.99 ± 0.03 (r2 = 0.89) in the heated mode and 1.10 ± 0.04 (r2 = 0.80) in the unheated mode. Correlations between
and EBCCOSMOS () were 0.99 ± 0.03 (r2 = 0.87) in the heated mode and 1.34 ± 0.03 (r2 = 0.90) in the unheated mode. Heating the sample air for the AE51 generally yielded a stronger agreement between
and rBCSP2 and EBCCOSMOS, as well as improved precision in the SP2 measurements (i.e., higher r2 values).
Figure 4. (a) Relationship between (Y-axis) and rBCSP2 (X-axis) for the heated (red circles) and unheated (blue circles) modes; (b) as in (a) but for the X-axis (EBCCOSMOS). The fitted lines are also shown in light red for the heated mode and light blue for the unheated mode.
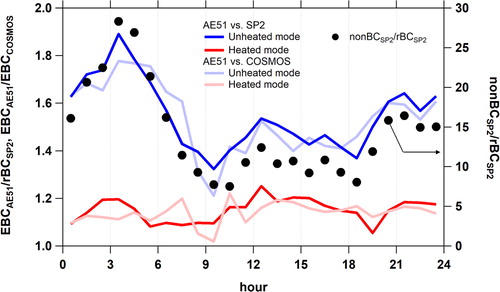
The diurnal averages for /EBCCOSMOS and
/rBCSP2 are shown in for both operation modes. Values in the heated mode showed stable ratios from 1.06 to 1.25 and from 1.01 to 1.22, respectively, throughout the day. However, these varied from ∼1.2 to ∼1.9 in the unheated mode. Averaged
/rBCSP2 and
/EBCCOSMOS ratios were 1.15 and 1.14, and 1.55 and 1.54, in the heated and unheated modes, respectively. The diurnal variation of nonBCSP2/rBCSP2, which can be regarded as an indicator of the impact of the light-scattering materials, is also shown in . We found that nonBCSP2/rBCSP2 showed a similar diurnal variation to
/EBCCOSMOS and
/rBCSP2. A large bias of the AE51 with respect to EBC mass concentrations in the unheated mode relative to the other instruments was detected in the early morning and at night, producing enhanced values of nonBC materials relative to BC. This was likely caused by the diurnal variations in the mass concentrations of nonBC and BC (Figure S4). This indicates that nonBC that had become loaded onto the filter affected the measurement of BC mass concentrations using AE51.
Figure 5. Diurnal variations in /EBCCOSMOS (light-colored lines) and
/rBCSP2 (primary-colored lines) for the heated (red lines) and unheated (blue lines) modes, and nonBCSP2/rBCSP2 (black circles, right axis).
Factors controlling the biases of  to EBCCOSMOS and rBCSP2
We further analyzed the datasets by performing linear regression analysis of the correlations at different levels of ATNAE51 and for the different operation modes. For this, the datasets were divided into 15 ATNAE51 levels ranging from −20 to 130. Here, the values of r2 are used as an indicator of the criterion of ATNAE51 values to exchange the filter for the AE51 measurement (). Corresponding linear regression slopes were considered to reflect the sensitivity of the AE51 (relative to SP2 and COSMOS) and were analyzed along with ATNAE51 to assess the effect of particle loading (). It is evident from that the values of r2 significantly decreased when ATNAE51 exceeded 70. Thus, we used AE51 data with an ATNAE51 of less than 60 to ensure better precision of the measurements.
Figure 6. (a) Coefficients of determination (r2) and (b) linear regression slopes for the correlations between and EBCCOSMOS (light-colored lines) and between
and rBCSP2 (primary-colored lines) for the heated (red lines) and unheated (blue lines) modes as a function of ATNAE51; (c) as for (b) but with correction using EquationEquations (5)
(5)
(5) and Equation(6)
(6)
(6) . The averaged nonBCSP2/rBC SP2 ratios binned by ATNAE51 are also shown in (c) as solid lines and closed circles (right axis).
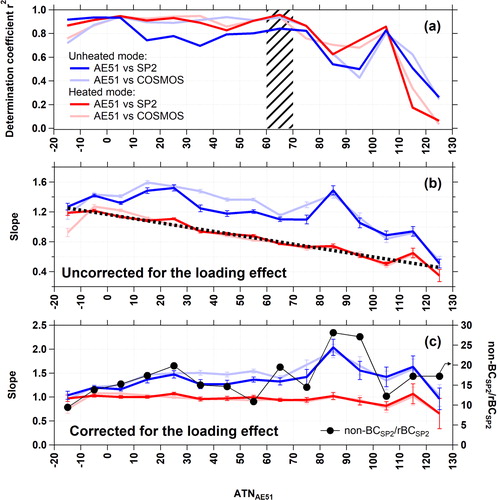
Linear regression slopes in the heated mode linearly decreased with an increase in ATNAE51 (). In other words, the sensitivity of the AE51 decreased with increasing particle loading. This feature has also been implied in previous studies (Drinovec et al. Citation2015; Virkkula et al. Citation2007; Weingartner et al. Citation2003). The linear regression slopes in the unheated mode had larger variability than those of the heated mode. This is because the biases related to the impacts of nonBC are dependent on atmospheric meteorological conditions (e.g., relative humidity). The slope of the correlation between and rBCSP2, as a function of ATNAE51 (fload), was found to be:
(3)
(3)
When we assumed that most of the BC-free particles completely evaporated inside the heater, EquationEquation (3)(3)
(3) represents the effect of particle loading by pure BC particles.
can be corrected for as follows:
(4)
(4)
Possible effects of multiple scattering in the filter media and uncertainties regarding the MAC (12.5 m2 g−1 at 880 nm for the AE51) as used to derive mass concentrations cannot be completely separated from the loading effect as evaluated here.
can be corrected for in the same way under the assumption that the correction factor
can be applied for
thus:
(5)
(5)
shows the recalculated slopes of the fitted linear functions for the correlations between corrected (
and
) and the other measurements (EBCCOSMOS and rBCSP2) as a function of ATNAE51.
was similar to EBCCOSMOS and rBCSP2 (i.e., their ratios are close to unity), whereas
still contained biases. The nonBCSP2/rBCSP2 mass ratio is also shown as a function of ATNAE51 in .
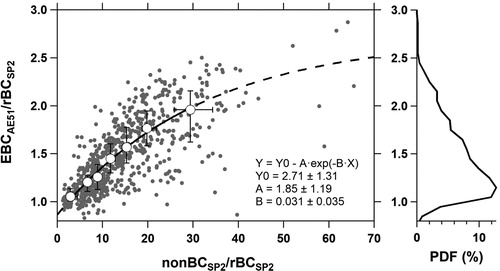
The relationship between /rBCSP2 and nonBCSP2/rBCSP2 is shown in . Note that to reduce uncertainties in the ratio calculations, this figure does not include data points where
and rBCSP2 are less than 0.1 µg m−3. It is evident that these biases were significantly larger than the uncertainties of rBCSP2 (see section “Single particle soot photometer (SP2)”) and were likely caused by the ratios of nonBC materials to BC. A similar increasing trend to the enhanced absorption due to nonBC materials has been found in previous studies using different filter-photometers (e.g., Zanatta et al. Citation2016). To the best of our knowledge, this is the first study to show a clear relationship between positive bias and the effect of nonBC materials for the AE51.
/rBCSP2 values were typically smaller than 1.5 (), and increased from ∼1 to ∼2.5 with increases in nonBCSP2/rBCSP2. EquationEquation (6)
(6)
(6) can be fitted to the observed dataset to estimate the effect of non-BC particles on EBC measurements made using AE51:
(6)
(6)
where Y0, A, and B are fitting coefficients determined by least-squares fitting to be 2.71, 1.85, and 0.031, respectively.
Figure 7. (Left panel) Relationship between /rBCSP2 and nonBCSP2/rBCSP2 (shaded circles). The 7-bin medians (with interquartile ranges) are sorted by nonBCSP2/rBCSP2 (open markers). The regression line of the binned datasets is also shown (black line, with the dashed line showing the extrapolation). The fitted coefficients with 95% confidence intervals are also shown; (Right panel) the probability distribution of
/rBCSP2.
Relative humidity (RH) variations can affect measurements of filter-photometers, when an aerosol dryer was not used for sampling aerosols (e.g., Miyazaki et al. Citation2008). While the TFE coating on the filter media used for the AE51 results in negligible adsorption of water vapor onto the filter media, the RH of the sample air regulates the hygroscopic growth of water-soluble aerosols on the filter media. Because the internal temperature of the AE51 is 35–45 °C, the variations of RH of the sample air can be minimized by gentle heating of aerosols collected on the filter media except for the summertime when the ambient temperature rises as high as that in the AE51.
Formulating correction factors for the general use of AE51 without heating treatment
Our results showed the significance of appropriate post-data processing of When we assume that the effect of particle loading on the collection filter is independent of aerosol particle types (i.e., pure-BC versus BC mixed with nonBC materials),
can be corrected using fload (EquationEquation (5)
(5)
(5) ) and an additional factor, C, as follows:
(7)
(7)
where C is the constant to correct the bias derived from the effects of nonBC materials. Based on linear regression analysis, the value of C was determined to be 1.25. The factor to correct the particle loading effect (including the multiple light scattering effect),
has the same form as that for different types of aethalometer (i.e., the AE33), which is the “linear model (f = 1 – k×ATN)” proposed by Drinovec et al. (Citation2015). This is likely caused by the fact that the same filter material (TFE-coated glass fiber) is used in both the AE51 and the AE33. The average value of k, at the wavelength 880 nm, was determined to be 0.0067 for the AE33 by Drinovec et al. (Citation2015), which is similar to our findings (k = 0.0044). A value of k of 0.0039 was also derived for the AE51 by Cheng and Lin (Citation2013), which is also similar to our result. It should be noted that these previous studies did not systematically discuss the effect of nonBC materials on the filter-photometric measurements. Nakayama et al. (Citation2010) have discussed the effects of the size distributions of BC aerosols on multiple scattering in the filter media for filter-photometric measurements. However, in this study, this effect has been included in the correction factor for the particle loading effect. The mass median diameters of rBCSP2 were found to be 173 ± 23 nm on average. Such small variations in the mass size distributions and mixing states (see Section S2) of rBCSP2 indicate that the microphysical properties of BC aerosol particles had no substantial impact on the sensitivity of the AE51 in our case. As described in Section “MicroAeth AE51”, the nonBC materials collected with the BC during the unheated mode can affect the measurements of ATNAE51 during the subsequent heated mode. Our additional experiment described in Section S3 suggests that this effect could not significantly affect the decreasing sensitivity trend of the AE51 against ATNAE51. The possible cause of this is that
is proportional to the time derivatives of ATNAE51 but not to ATNAE51.
To further correct it is recommended that the correction factor for the effects of nonBC materials (fnonBC, EquationEquation (6)
(6)
(6) ) is also applied, thus:
(8)
(8)
values corrected using the above factors (EquationEquations (7)
(7)
(7) and Equation(8)
(8)
(8) ) were compared with EBCCOSMOS and rBCSP2 (d and ). Both factors reduced the biases for the SP2 and the COSMOS by approximately 10% and 4%, respectively (). The use of Equation (9) notably increased the r2 values for the correlation between the AE51 and the SP2. As the correction factors (EquationEquations (7)
(7)
(7) and Equation(8)
(8)
(8) ) were developed based on the comparison between the AE51 and the SP2, the results from the comparison between the AE51 and the COSMOS were comparatively weaker. The cumulative distributions of the measured ratios of corrected
to EBCCOSMOS and rBCSP2 are shown in and f, respectively. The median values of both
/EBCCOSMOS and
/rBCSP2 were higher than unity (1.1–1.2), indicating that the use of EquationEquation (8)
(8)
(8) , including corrections for the two terms, is essential to bring
into agreement with EBCCOSMOS despite no significant differences in the strength of their correlation.
Figure 8. Correlations between corrected using EquationEquation (4)
(4)
(4) with rBCSP2 (a) and EBCCOSMOS (b), and between
corrected using EquationEquation (7)
(7)
(7) (shaded circles) and EquationEquation (8)
(8)
(8) (black circles) with rBCSP2 (c) and EBCCOSMOS (d). Dashed lines in (a) and (d) are depicted using a ratio of 1:1; (e) and (f) show the cumulative distributions of the ratio of
corrected using EquationEquation (7)
(7)
(7) (shaded) and EquationEquation (8)
(8)
(8) (black) with rBCSP2 and EBCCOSMOS, respectively.
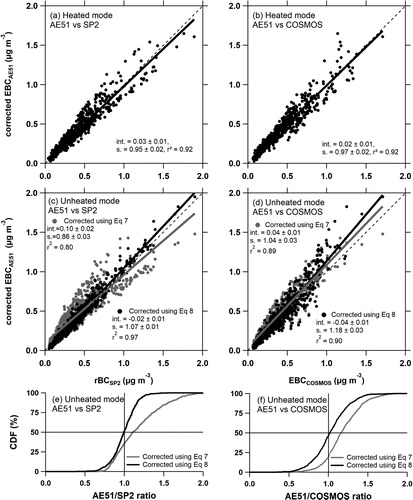
Table 2. Summary of intercomparison between the AE51 and the other instruments.
The use of environmental monitoring data for correction
As the SP2 is not always available to researchers using the AE51, and the AE51 would be used outdoors where the SP2 is difficult to operate, a proxy for nonBCSP2/rBCSP2 is required in typical urban and rural atmospheric environments. Deploying a light-weight optical particle counter (e.g., Sousan et al. Citation2016) together with the AE51 is an alternative means of considering the impact of nonBC materials on the BC concentrations obtained using the AE51. Here, we propose the use of environmental monitoring data (mass concentrations of PM2.5 aerosols) as an alternative to nonBCSP2. To demonstrate this, we used daily PM2.5 aerosol mass concentration datasets from the Atmospheric Environmental Regional Observation System (AEROS), which is managed by the Ministry of the Environment Government of Japan (http://soramame.taiki.go.jp/). shows a comparison of daily mass concentrations (00:00–24:00, LT [UTC + 9 h]) of SP2-derived total aerosol (nonBCSP2 + rBCSP2) and PM2.5 aerosols measured at four stations near the observation site (see Figure S1).
Figure 9. Correlations between (a) SP2-derived total aerosols (nonBCSP2 + rBCSP2) and PM2.5 aerosols at four environmental monitoring stations (Black circles = Oppama station; shaded circles = Nagasaka station; shaded squares = Kurihama station; shaded triangles = Honmoku station) and (b) between nonBCSP2/rBCSP2 ratios and nonBCPM2.5 (≡ PM2.5 - rBCSP2)/rBCSP2 ratios at Oppama station. The dashed line in (a) is shown using a ratio of 1:1.
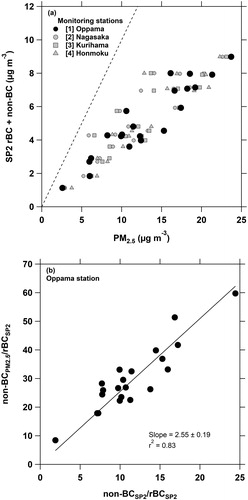
SP2-derived total aerosols correlated well with PM2.5 aerosol values from the monitoring stations (especially at the Oppama site [r2 = 0.87]), even though the definition of the size cut between the measurements (PM2.5 for AEROS versus submicron for SP2) and locations of the observation sites were different. This indicates that the observation site is representative of the surrounding area, and that nonBCSP2/rBCSP2 ratios can be translated into a different parameter using PM2.5 concentrations. We calculated PM2.5 nonBC material () concentrations by subtracting rBCSP2 from PM2.5 concentrations, and using the ratio of
to rBCSP2 as a proxy for nonBCSP2/rBCSP2. The
/rBCSP2 ratio was well correlated with nonBCSP2/rBCSP2 (). Thus, it is possible to estimate values of fnonBC using PM2.5 datasets obtained from environmental monitoring stations. When we operated the AE51 without the heater and near the environmental monitoring sites, the compatibility shown in indicates promise for a wide range of applications. Here,
and rBCSP2 were assumed to be the true concentrations of BC (BCtrue). Thus, EquationEquations (6)
(6)
(6) and Equation(8)
(8)
(8) can be rewritten as:
(6')
(6')
and
(8')
(8')
respectively. Although
is included in both sides of these equations, they can be numerically solved. It should be noted that the derived coefficient C and the functions fnonBC and gnonBC can be spatially (e.g., near versus remote sources) and/or temporally (e.g., seasonally) variable. However, at the very least, these parameters can be applied to observations made near anthropogenic emission sources, as described in Sections “Materials and methods” and S1 (Kanaya et al. Citation2014; Miyakawa et al. Citation2016).
Remaining issues
Further characterizations of the AE51 are needed for understanding its performance in remote atmosphere with lower BC concentrations than in our study. The use of the heated inlet will minimize the uncertainties regarding nonBC materials, for example major inorganic and organic aerosols in the submicron size range, in a wide variety of atmospheric environment (e.g., remote island, Miyakawa et al. Citation2017; Ohata et al. Citation2019). One exception is marine boundary layers (MBLs) where “thermally inert” sea-salt particles dominate. This is indicated by a previous study using the COSMOS in which includes the heated inlet (Ohata et al. Citation2019). Note that the use of the heated inlet can induce charring of refractory organic materials such as humic-like substances (HULIS), slightly affecting the light-absorption measurements as indicated by Kondo et al. (Citation2011). Dust aerosol particles exported from desert regions can also affect the AE51 performance, because of their light-absorption property and thermal inertness.
Conclusions
We have presented a methodology for correcting BC mass concentrations measured using a miniaturized aethalometer, the MicroAeth AE51, based on an intercomparison with independent instruments (the COSMOS and the SP2). Two well-known uncertainties in filter photometric techniques, i.e., the particle loading effect (including the multiple-scattering effect in this study) and the positive artifact of light-scattering materials on the filter, were systematically evaluated for the AE51 for the first time. We operated the AE51 both with sample air passing and bypassing a pre-heater maintained at 300 °C to minimize the sampling of light-scattering (i.e., nonBC) materials. Alternate operation in heated and unheated modes (for 15 min) enabled the separation of the two uncertainty effects. Under the heated mode, a decreasing linear trend was observed in the correlation between EBCCOSMOS (or rBCSP2) and EBCAE51 with an increase in ATNAE51 (−0.44% per ATNAE51). These results are similar to those described by Drinovec et al. (Citation2015) (−0.67% per ATN) and Cheng and Lin (Citation2013) (−0.39% per ATN). The ATNAE51 criterion for the exchange of the sampling filter was evaluated to be 60–70. The EBCAE51 corrected for the particle loading effect under the unheated mode still showed biases relative to those measured using the COSMOS and the SP2, which were well correlated with nonBCSP2/rBCSP2. Using this relationship, EBCAE51 can be corrected for (and even under the unheated mode) to be consistent with data obtained using the COSMOS and the SP2. We also suggest that the correction factor can be derived based on PM2.5 concentrations obtained from environmental monitoring stations. This approach will be beneficial to potential users of the AE51 for whom SP2 data are not available. It should be noted that all of the derived coefficients and functions may be spatially and/or temporally variable. However, at the very least, these parameters can be applied to observations made near anthropogenic emission sources. Further characterizations of the AE51 are needed for understanding its performance in remote atmosphere, especially MBL and desert areas.
Declaration of interests
The authors declare that they have no known competing financial interests or personal relationships that could have appeared to influence the work reported in this article.
Supplemental Material
Download PDF (635.7 KB)Acknowledgments
We would like to thank Y. Kondo at the National Institute for Polar Research for useful discussion on the experimental results of the COSMOS and the SP2. We would also like to thank Editage for English language editing.
Additional information
Funding
References
- Arnott, W. P., K. Hamasha, H. Moosmüller, P. J. Sheridan, and J. A. Ogren. 2005. Towards aerosol light-absorption measurements with a 7-wavelength aethalometer: Evaluation with a photoacoustic instrument and 3-wavelength nephelometer. Aerosol Sci. Technol. 39 (1):17–29. doi:10.1080/027868290901972.
- Bond, T. C., and R. W. Bergstrom. 2006. Light absorption by carbonaceous particles: An investigative review. Aerosol Sci. Technol. 40 (1):27–67. doi:10.1080/02786820500421521.
- Bond, T. C., T. L. Anderson, and D. Campbell. 1999. Calibration and intercomparison of filter-based measurements of visible light absorption by aerosols. Aerosol Sci. Technol. 30 (6):582–600. doi:10.1080/027868299304435.
- Bond, T., S. J. Doherty, D. W. Fahey, P. M. Forster, T. Berntsen, B. J. DeAngelo, M. G. Flanner, S. Ghan, B. Kärcher, et al., 2013. Bounding the role of black carbon in the climate system: A scientific assessment. J. Geophys. Res. Atmos. 118:5380–552. doi:10.1002/jgrd.50171.
- Caubel, J. J., T. E. Cados, and T. W. Kirchstetter. 2018. A new black carbon sensor for dense air quality monitoring networks. Sensors 18 (3):738. doi:10.3390/s18030738.
- Cheng, Y. H., and M. H. Lin. 2013. Real-time performance of the microAeth® AE51 and the effects of aerosol loading on its measurement results at a traffic site. Aerosol Air Qual. Res. 13 (6):1853–63. doi:10.4209/aaqr.2012.12.0371.
- Croft, D. P., S. J. Cameron, C. N. Morrell, C. J. Lowenstein, F. Ling, W. Zareba, P. K. Hopke, M. J. Utell, S. W. Thurston, K. Thevenet-Morrison, et al., 2017. Associations between ambient wood smoke and other particulate pollutants and biomarkers of systemic inflammation, coagulation and thrombosis in cardiac patients. Environ. Res. 154:352–61. doi:10.1016/j.envres.2017.01.027.
- Drinovec, L., G. Močnik, P. Zotter, A. S. H. Prévôt, C. Ruckstuhl, E. Coz, M. Rupakheti, J. Sciare, T. Müller, A. Wiedensohler, and A. D. A. Hansen. 2015. The “dual-spot” aethalometer: an improved measurement of aerosol black carbon with real-time loading compensation. Atmos. Meas. Tech. 8:1965–79. doi:10.5194/amt-8-1965-2015.
- Ferrero, L., M. Castelli, B. S. Ferrini, M. Moscatelli, M. G. Perrone, G. Sangiorgi, L. D’Angelo, G. Rovelli, B. Moroni, F. Scardazza, et al., 2014. Impact of black carbon aerosol over Italian basin valleys: High-resolution measurements along vertical profiles, radiative forcing and heating rate. Atmos. Chem. Phys. 14 (18):9641–64. doi:10.5194/acp-14-9641-2014.
- Ferrero, L., D. Cappelletti, M. Busetto, M. Mazzola, A. Lupi, C. Lanconelli, S. Becagli, R. Traversi, L. Caiazzo, F. Giardi, et al., 2016. Vertical profiles of aerosol and black carbon in the Arctic: A seasonal phenomenology along 2 years (2011-2012) of field campaigns. Atmos. Chem. Phys. 16 (19):12601–29. doi:10.5194/acp-16-12601-2016.
- Ferrero, L., G. Mocnik, B. Ferrini, M. Perrone, G. Sangiorgi, and E. Bolzacchini. 2011. Vertical profiles of aerosol absorption coefficient from micro-Aethalometer data and Mie calculation over Milan. Sci. Total Environ. 409 (14):2824–37. doi:10.1016/j.scitotenv.2011.04.022.
- Flanner, M. G., and C. S. Zender. 2006. Linking snowpack microphysics and albedo evolution. J. Geophys. Res. 111 (D12):D12208. doi:10.1029/2005JD006834.
- Hagler, G. S. W., T. L. B. Yelverton, R. Vedantham, A. D. A. Hansen, and J. R. Turner. 2011. Post-processing method to reduce noise while preserving high time resolution in aethalometer real-time black carbon data. Aerosol Air Qual. Res. 11 (5):539–46. doi:10.4209/aaqr.2011.05.0055.
- Hansen, A. D. A., H. Rosen, and T. Novakov. 1984. The aethalometer - An instrument for the real-time measurement of optical absorption by aerosol particles. Sci. Total Environ. 36:191–6. doi:10.1016/0048-9697(84)90265-1.
- Irwin, M., Y. Kondo, and N. Moteki. 2015. An empirical correction factor for filter-based photo-absorption black carbon measurements. J. Aerosol Sci. 80:86–97. doi:10.1016/j.jaerosci.2014.11.001.
- Irwin, M., Y. Kondo, N. Moteki, and T. Miyakawa. 2013. Evaluation of a heated-inlet for calibration of the SP2. Aerosol Sci. Technol. 47 (8):895–905. doi:10.1080/02786826.2013.800187.
- IPCC. 2013. Climate change 2013: The physical science basis. Contribution of Working Group I to the Fifth Assessment Report of the Intergovernmental Panel on Climate Change, ed. T. F. Stocker, D. Qin, G.-K. Plattner, M. Tignor, S. K. Allen, J. Boschung, A. Nauels, Y. Xia, V. Bex, and P. M. Midgley, Cambridge, UK: Cambridge University Press.
- Kanaya, Y., F. Taketani, Y. Komazaki, X. Liu, Y. Kondo, L. K. Sahu, H. Irie, and H. Takashima. 2013. Comparison of black carbon mass concentrations observed by multi-angle absorption photometer (MAAP) and continuous soot-monitoring system (COSMOS) on Fukue Island and in Tokyo, Japan. Aerosol Sci. Technol. 47 (1):1–10. doi:10.1080/02786826.2012.716551.
- Kanaya, Y., H. Irie, H. Takashima, H. Iwabuchi, H. Akimoto, K. Sudo, M. Gu, J. Chong, Y. J. Kim, H. Lee, et al., 2014. Long-term MAX-DOAS network observations of NO2 in Russia and Asia (MADRAS) during the period 2007-2012: Instrumentation, elucidation of climatology, and comparisons with OMI satellite observation and global model simulations. Atmos. Chem. Phys. 14 (15):7909–27. doi:10.5194/acp-14-7909-2014.
- Kanaya, Y., X. Pan, T. Miyakawa, Y. Komazaki, F. Taketani, I. Uno, and Y. Kondo. 2016. Long-term observations of black carbon mass concentrations at Fukue Island, western Japan, during 2009-2015: Constraining wet removal rates and emission strengths from East Asia. Atmos. Chem. Phys. 16 (16):10689–705. doi:10.5194/acp-16-10689-2016.
- Kirchstetter, T. W., T. Novakov, and P. V. Hobbs. 2004. Evidence that the spectral dependence of light absorption by aerosols is affected by organic carbon. J. Geophys. Res. 109:D21208. doi:10.1029/2004JD0004999.
- Kondo, Y. 2015. Effects of black carbon on climate: Advances in measurement and modeling. Monogr. Environ. Earth Planets 3 (1):1–85. doi:10.5047/meep.2015.00301.0001.
- Kondo, Y., L. Sahu, M. Kuwata, Y. Miyazaki, N. Takegawa, N. Moteki, J. Imaru, S. Han, T. Nakayama, N. T. K. Oanh, et al., 2009. Stabilization of the mass absorption cross section of black carbon for filter-based absorption photometry by the use of a heated inlet. Aerosol Sci. Technol. 43 (8):741–56. doi:10.1080/02786820902889879.
- Kondo, Y., L. Sahu, N. Moteki, F. Khan, N. Takegawa, X. Liu, M. Koike, and T. Miyakawa. 2011. Consistency and traceability of black carbon measurements made by laser-induced incandescence, thermal-optical transmittance, and filter-based photo-absorption techniques. Aerosol Sci. Technol. 45 (2):295–312. doi:10.1080/02786826.2010.533215.
- Li, Y., D. K. Henze, D. Jack, B. H. Henderson, and P. L. Kinney. 2016. Assessing public health burden associated with exposure to ambient black carbon in the United States. Sci. Total Environ. 39:515–25. doi:10.1016/j.scitotenv.2015.08.129.
- Louwies, T., T. Nawrot, B. Cox, E. Dons, J. Penders, E. Provost, L. I. Panis, and P. De Boever. 2015. Blood pressure changes in association with black carbon exposure in a panel of healthy adults are independent of retinal microcirculation. Environ. Int. 75:81–6. doi:10.1016/j.envint.2014.11.006.
- Miyakawa, T., Y. Kanaya, Y. Komazaki, F. Taketani, X. Pan, M. Irwin, and J. Symonds. 2016. Intercomparison between a single particle soot photometer and evolved gas analysis in an industrial area in Japan: Implications for the consistency of soot aerosol mass concentration measurements. Atmos. Environ. 127:14–21. doi:10.1016/j.atmosenv.2015.12.018.
- Miyakawa, T., N. Oshima, F. Taketani, Y. Komazaki, A. Yoshino, A. Takami, Y. Kondo, and Y. Kanaya. 2017. Alteration of the size distributions and mixing states of black carbon through transport in the boundary layer in East Asia. Atmos. Chem. Phys. 17 (9):5851–64. doi:10.5194/acp-17-5851-2017.
- Miyazaki, Y., Y. Kondo, L. K. Sahu, J. Imaru, N. Fukushima, and M. Kano. 2008. Performance of a newly designed continuous soot monitoring system (COSMOS). J. Environ. Monit. 10 (10):1195–201. doi:10.1039/b806957.
- Moteki, N., and Y. Kondo. 2007. Effects of mixing state on black carbon measurements by laser-induced incandescence. Aerosol Sci. Technol. 41 (4):398–417. doi:10.1080/02786820701199728.
- Moteki, N., and Y. Kondo. 2010. Dependence of laser-induced incandescence on physical properties of black carbon aerosols: Measurements and theoretical interpretation. Aerosol Sci. Technol. 44 (8):663–75. doi:10.1080/02786826.2010.484450.
- Nakayama, T., Y. Kondo, N. Moteki, L. K. Sahu, T. Kinase, K. Kita, and Y. Matsumi. 2010. Size-dependent correction factors for absorption measurements using filter-based photometers: PSAP and COSMOS. J. Aerosol Sci. 41 (4):333–43. doi:10.1016/j.jaerosci.2010.01.004.
- Ohata, S., Y. Kondo, N. Moteki, T. Mori, A. Yoshida, P. R. Sinha, and M. Koike. 2019. Accuracy of black carbon measurements by a filter-based absorption photometer with a heated inlet. Aerosol Sci. Technol. 53 (9):1079–91. doi:10.1080/02786826.2019.1627283.
- Petzold, A., J. A. Ogren, M. Fiebig, P. Laj, S.-M. Li, U. Baltensperger, T. Holzer-Popp, S. Kinne, G. Pappalardo, N. Sugimoto, et al., 2013. Recommendations for reporting “black carbon” measurements. Atmos. Chem. Phys. 13 (16):8365–79. doi:10.5194/acp-13-8365-2013.
- Ramanathan, V., M. V. Ramana, G. Roberts, D. Kim, C. Corrigan, C. Chung, and D. Winker. 2007. Warming trends in asia amplified by brown cloud solar absorption. Nature 448 (7153):575–9. doi:10.1038/nature06019.
- Ramanathan, V., and G. Carmichael. 2008. Global and regional climate changes due to black carbon. Nature Geosci. 1 (4):221–7. doi:10.1038/ngeo156.
- Stephens, M., N. Turner, and J. Sandberg. 2003. Particle identification by laser-induced incandescence in a solid-state laser cavity. Appl. Opt. 42 (19):3726–36. doi:10.1364/AO.42.003726.
- Schwarz, J. P., R. S. Gao, D. W. Fahey, D. S. Thomson, L. A. Watts, J. C. Wilson, J. M. Reeves, M. Darbeheshti, D. G. Baumgardner, G. L. Kok, et al., 2006. Single-particle measurements of midlatitude black carbon and light-scattering aerosols from the boundary layer to the lower stratosphere. J. Geophys. Res. 111 (D16):D16207. doi:10.1029/2006JD007076.
- Sousan, S., K. Koehler, L. Hallett, and T. M. Peters. 2016. Evaluation of the Alphasense optical particle counter (OPC-N2) and the Grimm portable aerosol spectrometer (PAS-1.108). Aerosol Sci. Technol. 50 (12):1352–65. doi:10.1080/02786826.2016.1232859.
- Viana, M., I. Rivas, C. Reche, A. S. Fonseca, N. Pérez, X. Querol, A. Alastuey, M. Álvarez-Pedrerol, and J. Sunyer. 2015. Field comparison of portable and stationary instruments for outdoor urban air exposure assessments. Atmos. Environ. 123:220–8. doi:10.1016/j.atmosenv.2015.10.076.
- Virkkula, A., T. Mäkelä, R. Hillamo, T. Yli-Tuomi, A. Hirsikko, K. Hämeri, and I. K. Koponen. 2007. A simple procedure for correcting loading effects of aethalometer data. J. Air Waste Manage. 57 (10):1214–22. doi:10.3155/1047-3289.57.10.1214.
- Weingartner, E., H. Saathoff, M. Schnaiter, N. Streit, B. Bitnar, and U. Baltensperger. 2003. Absorption of light by soot particles: Determination of the absorption coefficient by means of aethalometers. J. Aerosol Sci. 34 (10):1445–63. doi:10.1016/S0021-8502(03)00359-8.
- Zanatta, M., M. Gysel, N. Bukowiecki, T. Müller, E. Weingartner, H. Areskoug, M. Fiebig, K. E. Yttri, N. Mihalopoulos, G. Kouvarakis, et al., 2016. A European aerosol phenomenology-5: Climatology of black carbon optical properties at 9 regional background sites across Europe. Atmos. Environ. 145:346–64. doi:10.1016/j.atmosenv.2016.09.035.