
 ?Mathematical formulae have been encoded as MathML and are displayed in this HTML version using MathJax in order to improve their display. Uncheck the box to turn MathJax off. This feature requires Javascript. Click on a formula to zoom.
Abstract
One of the most frequently used methods to purify air contaminated by particles, in many industrial processes, is filter media. Although the performance of filter media is relatively well documented under standard conditions (humidity and ambient temperature), few studies are interested in the interaction between moisture and the deposition of particles collected. The proposed study aims to establish the performance of a fibrous media with aerosols composed of nanostructured solid particles (soot) and the influence of relative humidity (RH) on its pressure drop. In a first part, the impact of relative humidity on the mass loading capacity of flat HEPA filter with soot particles during clogging is investigated. In a second part, exposure of filters loaded (at 35% RH) with soot particles by a clean air at relative humidity rate between 50 and 90% is tested. The results show a significant decrease of pressure drop for high relative humidity rate. Knowing soot particles are non-hygroscopic and non-hydrophilic, shows an interesting phenomenon, which could be not link to the nature of the particles. A model has be done with the results obtained.
Copyright © 2020 American Association for Aerosol Research
Editor:
1. Introduction
Air quality is a public health issue. Many processes (car, aircraft, wood combustion, steel mills…) generate particles that can be harmful to humans and the environment. Filtration is one of the separation processes used to purify the air. In this study, interest will be focused on fiber filters, as they are part of the most common separation processes. Solid aerosols filtration is already well documented in the literature (Thomas et al. Citation2001; Penicot et al. Citation1999; Bourrous et al. Citation2016; Walsh Citation1996; Sun et al. Citation2019). Filters performances are characterized by their efficiency and pressure drop. The filter lifetime can be impact by environmental conditions such as relative humidity. Indeed, Gupta et al. (Citation1993) and Joubert et al. (Citation2010) have shown a change in pressure drop evolution of filters clogged with salt particles under humidity.
Some studies have been realized on the impact on the filters performance of the relative humidity of the air (Joubert Citation2009, Gupta et al. Citation1993, Montgomery et al. Citation2015, Pei et al. Citation2019.1; He et al. Citation2016; Pei et al. Citation2019.2, Ribeyre et al. Citation2017) but most of them don’t use soot particles. The main studies (Joubert Citation2009; Gupta et al. Citation1993; Montgomery et al. Citation2015) deal with hygroscopic particles (sodium chloride) and non-hygroscopic particles (alumina) (). With respect to Ribeyre (Citation2015), his study deals with nanostructured cake built with powder such as Zinc-Alumina, black carbon, hydrophilic silica. Then this study will focus on the performance evolution of High Efficiency Particulate Air (HEPA) filter in the presence of soot particles and a moist air. It is necessary to be able to predict the performance of the filter during its clogging by soot particles with a high relative humidity (HR) air stream and to understand how the lifetime filter could be impacted.
Table 1. Principal results already published.
Gupta et al. (Citation1993) investigate the effect of moisture on hygroscopic particles on HEPA filter when loading. The authors also study the influence of the particle size. Non-hygroscopic particles of alumina are used with two median diameters: 0.45 μm and 1.19 μm. For submicron-sized particles, the results show that there is no effect of moisture when relative humidity (RH) is inferior to 90%, beyond, the resistance decreases. For micron-sized particles, the results show that the specific resistance decreases for each increase in humidity. Joubert (Citation2009 chap. 3, p. 87) worked with the same aerosols as Gupta et al. (Citation1993) on HEPA flat filters with same protocol (filter loading under humidity). However, Joubert (Citation2009) uses a micron alumina aerosol with a median diameter of 4.2 μm. The results confirm those of Gupta et al. (Citation1993) about alumina. Plotting the evolution of the cake resistance in function of the relative humidity for different alumina size gives consistent results between the authors as represented in .
Figure 1. Changes in experimental specific cake resistance of alumina oxide particles versus relative humidity and for various aerosol diameters (from Joubert et al. Citation2011).
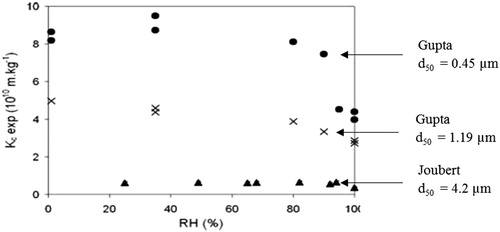
Joubert (Citation2009) and Gupta et al. (Citation1993) perform the same experiments for hygroscopic aerosols of submicron-sized and micron-sized sodium chloride (NaCl). For relative humidity below the point of deliquescence (<75%) a linear relationship between the pressure drop and the surface density is obtained, as in the case of non-hygroscopic aerosols. Specific resistance decreases with increasing humidity, this decrease is more important for non-hygroscopic particles than non-hygroscopic alumina, especially for submicron NaCl particles. Pei et al. (Citation2019) have lately done a study which implies that the service life of filter designed for ambient particles will be longer when the RH during service was higher especially when high hygroscopic content existed.
Recently, Montgomery et al. (Citation2015) investigated the impact of relative humidity on HVAC (Heating, Ventilating, and Air Conditioning) filters clogged with hygroscopic and non-hygroscopic particles. The filters were clogged at a relative humidity A and once the cake is formed, the relative humidity is adjusted to reach a value B. For a hygroscopic aerosol, the authors find that if B is lower than or equal to A, the pressure drop does not change. When B is higher than A, the results indicate a decrease in the specific cake resistance for sodium chloride which is in agreement with the results of Joubert et al. (Citation2011). The results of Montgomery et al. (Citation2015) also point out that the evolution of the pressure drop depend on the relative humidity during clogging and exposure moisture after clogging. No change in the properties of the alumina oxide cake is noticed. Finally, they show that the impact of exposure to humidity is a function of filter media, loading level and relative humidity level. Ribeyre et al. (Citation2017) studied the influence of humidity on the pressure drop of a nanostructured deposit. The study deals with non-hygroscopic nanometer-sized powders. The results show an increase in the pressure drop when exposed to humid air. As mentioned by the authors, these results are in contradiction with those of the previous authors. However, the methodology, the experimental conditions (aerosol particle size, cake thickness) differ.
The studies above show a trend in terms of pressure drop for hygroscopic and non-hygroscopic particles for loading under humidity. The difference of observation between Montgomery et al. (Citation2015) and Ribeyre (Citation2015) indicates that no define conclusions can be drawn about the evolution of pressure drop of a cake when exposed to humidity.
As shown in the literature, most studies investigates influence of humidity on the pressure drop across filters during and after cake filtration with salt and alumina particles. To our knowledge, no study has been made about impact on the pressure drop across flat filters during cake filtration in the presence of humidity or about the impact of humidity on HEPA filters loaded with dry soot particles.
The first purpose of this study is to explore the influence of humidity on changes of pressure drop of flat HEPA filters during clogging by soot particles. Then, the impact of relative humidity on the pressure drop of flat HEPA filters already loaded with dry soot particles is going to be studied. The experiments will be done with two soot particles already characterized in the literature (Bescond et al. Citation2014; Yon et al. Citation2015). Subsequently, a pressure drop model has been done to fit with the experimental pressure drop evolution when a humid airflow crosses the soot particles cake.
2. Experimental setup
2.1. Description of the experimental bench
A test bench has been setting up to investigate the pressure drop across HEPA filters during cake filtration in the presence of humidity. The test bench allows controlling velocity filtration, soot particles size and concentration, and relative humidity. It is divided into three parts: the aerosol soot generation, the humid air generation and the measuring area. is a schematic diagram of the experimental test bench.
Figure 2. Experimental test bench design.
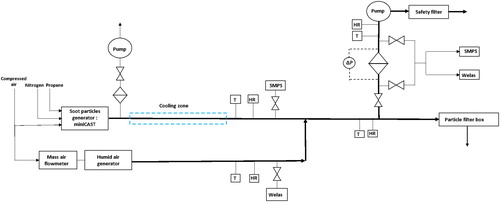
The soot particles are produced with a miniature combustion aerosol standard miniCAST (model 5203 type C, Jing) generator. An exhaust and a cooling zone follow the generator, which enable the flow to arrive at the same temperature than the humid air. The size distribution of the soot particles is measured with a TSI Scanning Mobility Particle Sizer (SMPS) composed of a long column Differential Mobility Analyzer (DMA, TSI 3080) and a butanol-based Condensation Particle Counter (CPC, TSI 3676). A dilution system (PALAS VKL 10, dilution ratio of 10) is used to avoid saturation of the SMPS and also, to avoid the SMPS to be damaged with high relative humidity or water droplets. A home-made humid air generator is used to generate droplets by spraying water. By placing a filter at the output of the generator, a production of moist air free of water droplets is possible.
The measurement zone is composed of two 120 mm diameter test filter holders in series, a mass flowmeter with a regulation valve, and two sampling lines upstream and downstream of the test filter. The temperature, relative humidity (+/− 2%) (Almemo 2690, Ahlborn) and pressure drop (+/− 0.5%) (Almemo 2690, Ahlborn) through the filter are measured continuously during the experiments. For the results in this study, the filters face a constant rate of 3 cm.s−1. A vacuum pump (ILMVAC, model PK2DC) is used to maintain the filter face velocity constant.
The filter tested in this study is a flat HEPA filter (glass fiber) characterized by a mean fiber diameter, df = 121 µm, a packing density, α = 0.078 and a thickness, Z = 409 µm.
2.2. Protocol
A specific experimental procedure has been proposed to understand the impact of the relative humidity on flat filters loaded with soot particles. The experiments take place in several steps as shown in .
Figure 3. Description of the experimental protocol.
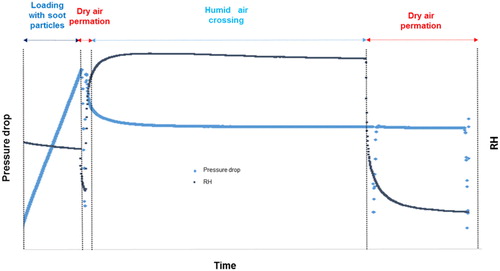
At first, the clean filter is weighed. The pump is adjusted at a filtration rate of 22.5 L.min−1 kept constant during testing. The measurements and acquisition flow rate, gas temperature, relative humidity and pressure drop between the upstream and the downstream of the filter are started. The filter is clogged with soot particles generated with the miniCast in dry air up to a defined pressure drop (1500 Pa, 2500 Pa, 3500 Pa). The soot particle generation is stopped and a permeation test is carried out in order to determine the clogged filter resistance. This late one is determined from the pressure drop evolution according to the permeation velocity which follows the Darcy law in laminar flow.
A flow rate of moist air at RH constant (RH varying between 50% and 90%) is injected through the soot cake until a stabilization of the pressure drop is observed. Then, a second permeation with dry air is realized in order to determine the new flow resistance.
To end, a dry (10% HR) clean air flows through the filter at the filtration rate for at least 30 min and if the pressure drop is constant the operation is stopped and a third permeation test is carried out. The filter is weighed before and after drying at 120° C.
2.3. Particles selected for the study
In this study, the miniCast has been used to generate soot. Changing the flowrates of fuel (propane), oxidant (oxygen) and nitrogen gases, the soot concentration, size and physical and chemical properties can be modulated (Moore et al. Citation2014). Soot produced from two operating points have been characterized by Yon et al. () in terms of density, primary particle, organic carbon on total carbon.
Table 2. Experimental characterization of two soots from the results of (Bescond et al. Citation2014; Yon et al. Citation2015) Df fractal dimension, kf fractal prefactor, ρpp density, Dp primary diameter, OC/TC organic carbon on total carbon.
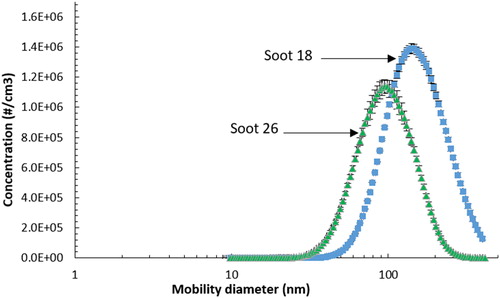
In the following paragraphs, the different soot produced will be named according to their primary diameter: Point [60/0/1.5/20]: soot 18 and Point [50/200/1.2/20]: soot 26.
The particle size distribution of soot 18 and 26 is given in .
Figure 4. Particle size distribution of the two generated soot.
2.4. Impact of relative humidity on clean filter properties
To know the impact of RH on the filter’s pressure drop this one has been monitored continuously for several levels of relative humidity. The obtained results are represented in .
Figure 5. Evolution of the pressure drop of a clean filter subjected to increasing levels of relative humidity.
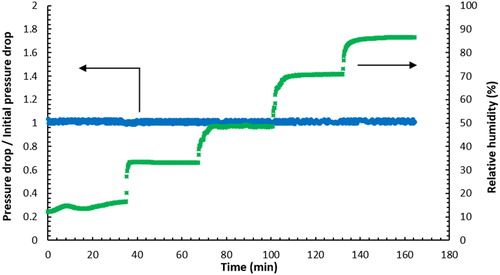
The results show that the ratio of the pressure drop on its initial value remains constant in the RH range applied and for each humidity range. There is therefore no influence of the relative humidity on the pressure drop of the filter media used for this study. These results on the glass fibers filter are in agreement with those of the literature (Joubert Citation2009).
2.5. Impact of relative humidity on the mass loading capacity of flat filter with soot particles
Filter clogging experiments with soot 18 and soot 26 at 15% RH and 90% RH were carried out (). The pressure drop is measured continuously during the soot particles filtration. In addition, during clogging experiments, a second filter was placed in series of the tested filter in order to detect or not a decrease in the efficiency of the media.
Figure 6. Evolution of the pressure drop of flat HEPA filters versus collected surface mass of soot particles at two different relative humidity.
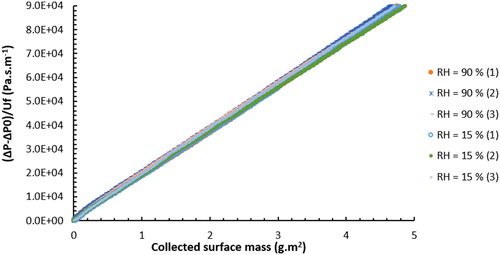
The evolution of the curves are linear for both soot, which is consistent with the published result of solid particles filtration in dry air on a flat HEPA filter under dry air (Walsh, Stenhouse, Scurrah, and Graef Citation1996, Thomas et al. Citation2001). The curves of the clogging at RH = 15% and at RH = 90% perfectly overlap, which indicates there is no influence of humidity in this case. Those results were already observed with non-hygroscopic alumina particles for 95% HR on flat filters (Joubert et al. Citation2010) and for soot particles generated with miniCAST on flat filters (Nerisson et al. Citation2015)
The results show that for the two applied RH, the pressure drop evolution can be considered as confounded. These results suggest that particle cake formation is not affected by the relative humidity of the air under these conditions, as a consequence, it means that the RH during the filtration of soot particles has no impact on the structure of the cake (porosity, thickness) in this range of humidity.
The pressure drop of the filter placed downstream remained constant (155 Pa +/− 2 Pa) for each test. The efficiency of the test filter has therefore not decreased whatever the relative humidity applied during the clogging. If the humidity had damaged the filter (leakage for example), an increase in the pressure drop of the downstream filter would have been observed.
2.6. Impact of relative humidity on the performance of flat filters loaded with soot particles
In this part, the objective is to study the influence of the relative humidity on a cake of soot particles. The interest will be focused on changes in the pressure drop of different deposits of soot particles subjected to several relative humidity levels. The changes in pressure drop will be represented as a function of time, which will make it possible to study the kinetics of these evolutions according to the operating conditions. A characterization of the resistance of the dry particle cake and the wet particle cake will be made for several particle deposits and several relative humidity.
2.6.1. Temporal evolution of the pressure drop
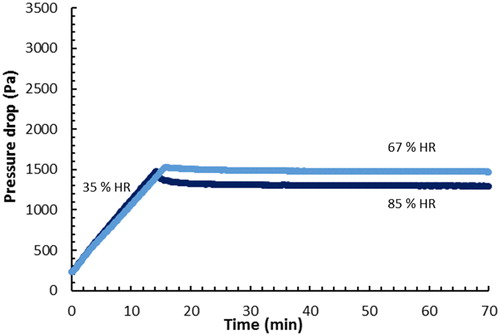
to and Figure S1 to S3 (see the online supplementary information) show all the changes in pressure drop of flat filters clogged with soot particles 18 and 26 respectively at a flow rate of 22.5 L .min−1. The tests were made for the three pressure drops selected: 1500, 2500 and 3500 Pa. In each case, regardless of the clogging pressure drop achieved, the average relative humidity during the clogging was 35% at temperature room. For a selected pressure drop, three wet permeation tests were carried out: a permeation at 50% RH, a permeation at 70% RH and a permeation at 90% RH.
Figure 7. Time variation in pressure drop across flat filters D-309 during clogging until 3500 Pa with soot particles for three different rates of relative humidity (soot 18).
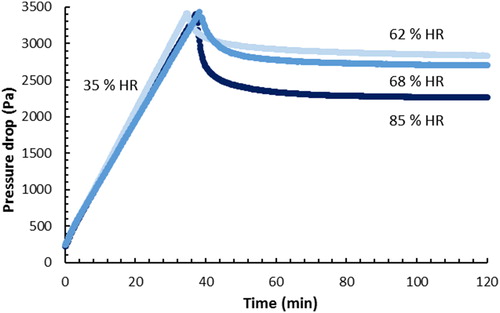
For all soot, the pressure drop evolutions evolve in three parts: a linear evolution during the clogging in dry air, then a significant and rapid decrease when humid air flows through the clogged filter, finally a smaller and much slower decrease.
The first part of the clogging curves is linear which is characteristic of the filtration of solid particles on HEPA flat filters and represents the cake building. The good reproducibility of the tests shows a similar deposit structure for each test. For example, for soot 18, the slope corresponding to deposits 3500, 2500 and 1500 are respectively 87, 84 and 88 Pa.min−1 meaning that the three types of cakes have the same structure and thus that their porosities are identical. It was not possible during the test to determine the mass of water retained by the filter (no significant difference in the mass of the clogged filter measured before and after drying at 120 °C).
For the three types of tests, when an air with relative humidity higher than the relative humidity of the clogging is applied to the deposit, a sudden decrease in the pressure drop is observed. As shown in and , the higher the cake pressure drop is, the greater the pressure drop fall is important. It would appear that for 1500 deposits, the influence of humidity is not significant.
Figure 8. Time variation in pressure drop across flat filters D-309 during clogging until 2500 Pa with soot particles for three different rates of relative humidity (soot 18).
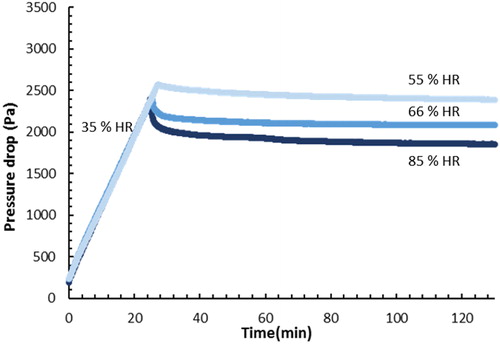
Figure 9. Time variation in pressure drop across flat filters D-309 during clogging until 1500 Pa with soot particles for three different rates of relative humidity (soot 18).
When the 3500 deposits are subjected to relative humidity of 70 and 90%, the pressure drop drops sharply at first and then decreases much more slowly. This second decrease is much smaller than for the first fall. This evolution is observed also for 2500 deposits with relative humidity of 70 and 90%, and for 1500 deposits only with a relative humidity of 90%. In general, the drop dynamics of pressure drop depend on the relative humidity and on the clogging pressure drop.
In all the tests carried out, the pressure drop stages achieved are different for the three relative humidity applied to the deposit: the higher the relative humidity, the lower this level. However, concerning the second part of the reduction of pressure drop, the tests has not been carried out until complete stabilization of the value of the pressure drop. The final values of stabilization of pressure drop are not known.
Moreover, these results show that the greater the pressure drop of the cake, the greater the influence of the relative humidity is strong. In general, the responses of both types of soot cakes follow the same trends.
2.6.2. Specific cake resistance
As explained in the experimental procedure, the different dry air permeation allows knowing the cake specific resistance with Darcy law, which is expressed as:
Where is the pressure drop (Pa), U is the filtration velocity (m.s−1),
is the air viscosity (Pa.s) and R is the flow resistance (m−1).
Plotting the pressure drop as a function of the product of velocity with the viscosity give a gradient that correspond to the flow resistance.
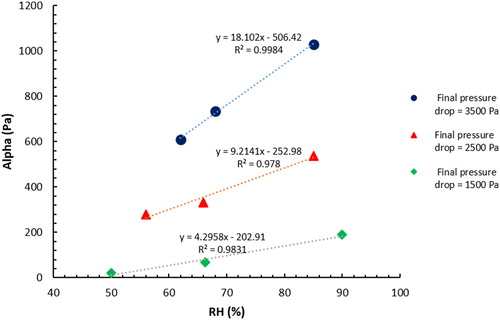
In order to compare all the results, the evolution of the ratio of the resistance of the “wet” cake for a given humidity to the resistance of the “dry” cake as a function of the relative humidity respectively for soot 18 and 26 are represented in and . These figures show that the cake flow resistances decrease with relative humidity. In addition, for both soot, the results reveal that the higher the resistance of the initial cake formed is, the greater the decrease in resistance is. For the deposits made up to a pressure drop of 1500 Pa, the resistance values are almost constant. For the deposits made up to a pressure drop of 2500 Pa, a slight decrease in strength is observed with increasing relative humidity. Finally, for the deposit formed up to a pressure drop of 3500 Pa, the decrease of the flow resistance as a function of the relative humidity is greater than for the other deposits
Figure 10. Evolution of the flow resistance in function of the relative humidity (soot 18).
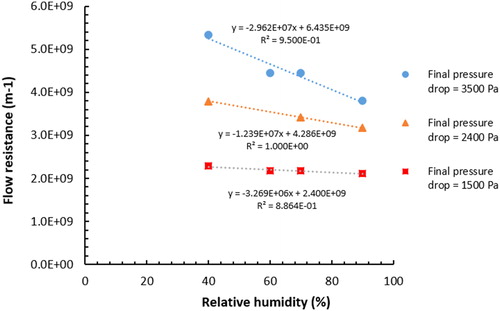
Figure 11. Evolution of the flow resistance in function of the relative humidity (soot 26).
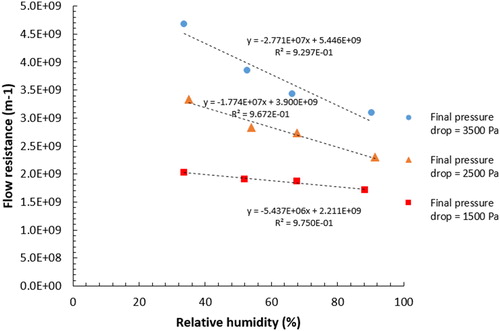
The representation of the resistances as a function of the relative humidity seems to indicate that the decrease of the resistances is very slightly more marked for the soot 26 than the soot 18. Considering the uncertainties of measurements, this slight difference is not sufficient to conclude as to a real difference in behavior between the two soot.
3. Discussion
This study have implemented operating protocols similar to those of Montgomery et al. (Citation2015) and Joubert et al. (Citation2011) to understand the influence of relative humidity on a particle deposit. However, these two studies were made with sodium chloride particles, which are hygroscopic particles and having a high affinity with water vapor. Montgomery et al. (Citation2015) results show that for relative humidity of permeation less than or equal to the relative humidity of clogging, the pressure drop is not disturbed, and remains constant. For relative humidity greater than the relative humidity during clogging (but less than the relative humidity of the deliquescence of the salt), a sudden drop in pressure is observed. These results are similar to the results obtained in this study with soot particles. Thus, the results of the study highlight that this disturbance of the pressure drop is not necessarily related to the hygroscopic or hydrophilic nature of the particles.
First, it has been verify placing two filters in series that there were no particles re-entrainment when humid air cross the cake. Indeed, the pressure drop of the downstream filter did remain constant and the mass filter as well. An experiment has been done to know more about the possible mechanism involved: after the passage of moist air, the deposit is subjected to dry air (RH = 15%). During flow of dry air (RH = 15%), the pressure drop remains constant. The permeation tests also show that the resistance of the deposit before and after the passage of dry air is not modified. This result shows that the change in the pressure drop and the flow resistance of the deposit following the passage of moist air is irreversible. Then, the most likely assumption to explain the pressure drop decrease is a restructuring or reorganization of the particle cake or a portion of the cake.
Two hypotheses can be made about the restructuring of the cake:
The reorganization can be uniform with a change in the thickness and porosity of the cake. The cake could tend to compact: thickness and porosity decrease. On the other hand, the cake could tend to be more aerated: the thickness and porosity increases. Knowing that thickness raises the pressure drop, porosity decrease the pressure drop, the effects of thickness, and porosity are opposite, one may be predominant over the other.
Humidity would cause local reorganization leading to micro-factures or modifying the local permeability of the deposit. This hypothesis seems very likely, because a fracturing would be fast and irreversible.
Nevertheless, mechanisms behind the cake reorganization with humidity are not known.
When air at a higher relative humidity than the clogging is injected, a condensation of the water vapor within the cake is possible (Ribeyre et al. Citation2017). Ribeyre et al. (Citation2014) shows that mass of the condensed water vapor is all the more important as the particle size is small. The condensation phenomenon can create capillary bridges between the particles. Thus, due to capillary force, some particles will get closer and others will move away. Disturbed by the condensation of water vapor, the cake is unbalanced, and the particles reorganize to find a new stability under the pressure drop effect. The area of cake where water vapor condensation can happen increases with RH, leading to a decrease of local flow resistance. The latter is linked to pressure drop, which has an impact on the particles reorganization.
In addition, the results from the literature provide other information and avenues for research. Indeed, Montgomery et al. (Citation2015) and Joubert (Citation2009) have noted the same type of response for sodium chloride particle deposition, whereas it does not seem to have any influence on alumina deposition. The results of this study show that this irreversible phenomenon of loss of pressure occurs for non-hygroscopic and non-hydrophilic particles. The particles of sodium chloride and soot have in common their submicron size, whereas the particles of alumina are micron-sized.
For a micron particles deposit, the water vapor condensation can be neglect. Furthermore, cake structure formed by finer particles has more nano-sized gaps with larger curvature for capillary condensation to happen, compared to cake of larger alumina powders. Besides, according to Hinds (Citation1999) the capillary force is proportional to particle diameter. Then, smaller is particle, smaller is the capillary force, thereby a cake composed of submicron particle would be easier to disrupt than micron-sized particle. In addition, results have shown that clogging rate has to be taken into account. Higher the clogging is, higher the pressure drop is. With a higher pressure drop, the forces apply on the cake are stronger which could destabilize more easily a cake whose interparticle forces have been weakened.
4. Behavioral equation
4.1. Numerical model fitting the loss of pressure drop
This part presents a numerical expression model reflecting the loss of pressure drop during the passage of moist air on the particles deposit observed experimentally. Characteristic parameters (time constant, difference in pressure drop) will be highlighted. A study of the characteristic parameters according to the relative humidity will be proposed and will allow proposing a predictive model of the fall of pressure drop according to the operating conditions.
Experimental observations have shown that the pressure drop falls rapidly during the passage of moist air, with an exponential evolution. In a first step, an identification of a first order evolution model of the pressure drop is being searched.
In these conditions, the pressure drop variation when humid air crosses the cake leads to the expression below:
(1)
(1)
where (Pa) is the pressure drop attained at the end of the loading in dry air,
(Pa) being the difference
-
(
is the pressure drop reached after humid air), t (min) is the time,
(min) is the humid air injection time, and
(min) is a constant.
However, the observed behavior and the analyses of the first identification results show:
That such a representation makes it possible to reproduce the evolution of the measured pressure drop and to have a good estimate of the relaxation time.
The existence of secondary dynamics that this representation does not allow to highlight.
The tests carried out thus seem to show the existence of dynamics of orders different from one. However, additional studies carried out using higher order models (2nd and 3rd order) did not lead to the improvement of the representation dynamic compared to that of a first order.
Thus, a representation of the type is proposed:
(2)
(2)
where the parameter n is 0 < n < 1.
Finally, a parametric analysis shows that the value of n is equal to 0.5, the expression becomes:
(3)
(3)
The comparison between the experimental values and the numerical values for all the tests for soot 18 at a flow rate of 22.5 L.min−1 is presented .
Figure 12. Evolution of the pressure drop in function of the time (Deposit 3500, soot 26): comparison between the numerical expression (line) and experimental results (point).
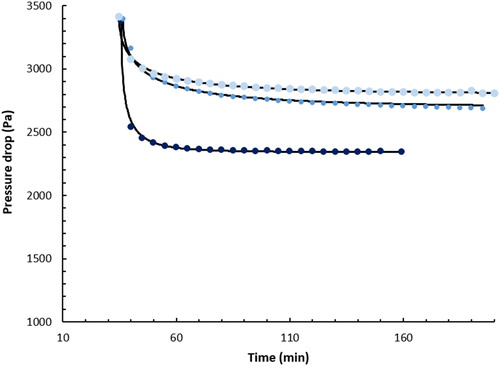
shows that the identified numerical expression faithfully represents the fall of pressure drop and has made it possible to determine characteristic parameters such as the time constant and the coefficient of proportionality ( and ).
Table 3. Characteristic parameters (soot 18).
Table 4. Characteristic parameters (soot 26).
Table 5. Values a1, b1, a2, b2 found for the two soot.
The results in and show, on the one hand, that the coefficient of proportionality decreases with the relative humidity applied, on the other hand that the time constants are of the order of a few seconds. Apart from one point (soot 18, deposit 2500, HR = 55%), the time constants are between 5 and 30 s. Overall, a decrease in the time constant is observed for the 90% relative humidity tests, which is consistent with the experimental observations showing a more sudden drop in pressure drop at a 90% relative humidity level rather than for relative humidity levels between 50 and 70%. The evolution of relaxation time and coefficient of proportionality as a function of the relative humidity are represented for soot 18 and 26 in and .
Figure 13. Evolution of the coefficient of proportionality as a function of the relative humidity (soot 18).
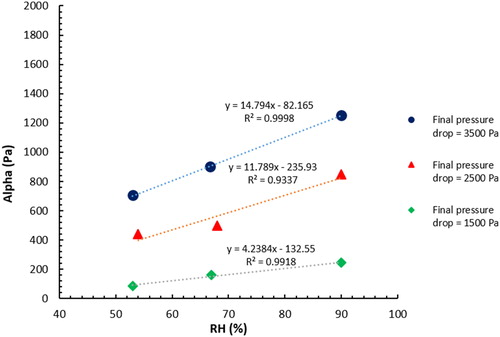
Figure 14. Evolution of the coefficient of proportionality as a function of the relative humidity (soot 26).
Plotting the coefficient of proportionality as a function of the relative humidity shows the evolution seems linear. The constant time is between 5 and 30 s for all tests.
4.2. Elaboration of a more general expression depending on pressure drop and relative humidity for the two soot considered
From the numerical expression obtained above, a more general expression of the pressure drop as a function of the relative humidity and the clogging pressure drop is investigated. Thus, the coefficient of proportionality as a function of the relative humidity and the pressure loss of clogging is investigated.
4.2.1. Expression of the coefficient of proportionality
The evolution of the coefficient of proportionality as a function of the relative humidity being linear for the two soot at this filtration rate, it can be written as:
(4)
(4)
where is the clogging pressure drop (Pa).
An expression of the coefficients b and c is:
(5)
(5)
(6)
(6)
Finally, the expression of the pressure drop can be expressed as:
(7)
(7)
Using the variations of b and c for the two soot, the coefficients found are in .
When time tends to infinity, the EquationEquation (7)(7)
(7) becomes,
(8)
(8)
The values obtained with the expression are compared with the experimental values in and .
Table 6. Experimental pressure drop of clogging relative humidity (HR), final pressure drop after humid air
and model pressure drop
for soot 18.
Table 7. Experimental pressure drop of clogging relative humidity (HR), final pressure drop after humid air
and model pressure drop
for soot 26.
4.2.2. Comparison of experimental values with the model established
The evolution of the models values of the pressure drop when humid air cross the cake in function of the experimental pressure drop are represented for the two soot in .
Figure 15. Model pressure drop as a function of the final experimental pressure drop.
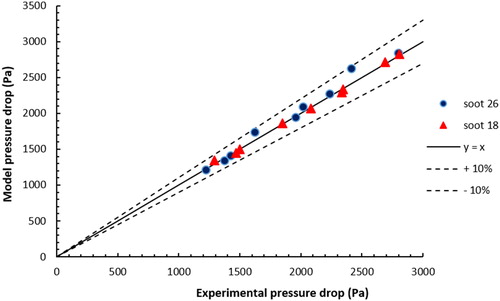
shows that model results are close to the experimental results with a difference of less than 10%.
5. Conclusion
The purpose of the study was to investigated influence of humidity on HEPA filters when loading by soot particles (non-hygroscopic) and influence on humidity on cake formed in dry air. The results, in agreement with the literature, showed that the relative humidity did not modify the performance of the clean filter (glass fiber). Then, the influence of the relative humidity during the filtration of soot particles was studied. The first part of the study shows that pressure drop is not impact for HEPA filtration with soot particles under humidity, so the structure of the cake formed at high relative humidity is the same as the structure of a cake formed in dry air. Finally, the influence of relative humidity on several particle cakes was investigated. This study has shown that there is an influence of relative humidity on deposits of soot particles made in dry air. Several sensitive parameters could be put forward: permeability and thickness of the deposit, pressure drop, relative humidity rate. It has been seen that the response dynamics of the particle cake depends on the pressure drop achieved during the clogging and the relative humidity rate applied to the cake.
It remains difficult to make a complete exploitation and to determine with rigor the mechanisms at the origin of the cake restructuration. It has been shown that the fall in pressure drop occurs in two stages: a large and rapid fall, then a smaller and much slower fall. Regarding the kinetic of the first decrease, the preferred hypothesis would be the formation of fractures or at least locals modifications of the flow resistance in the deposit due to a physical condensation during the passage of moist air. It has been shown that this reorganization of the deposition of particles is irreversible and does not reduce the efficiency of the filter media.
In addition, the results from the literature provide other information and perspectives. Indeed, Montgomery et al. (Citation2015) and Joubert (Citation2009) have noted the same type of response for sodium chloride particle deposition, whereas it does not seem to have any influence on alumina deposition. The results of these studies show that this irreversible phenomenon of loss of pressure drop occurs for non-hygroscopic and non-hydrophilic particles. The particles of sodium chloride and soot are smaller than the alumina used in the literature. Then, the forces between particles would be weaker and more sensible to pressure on the cake so it would be easier to break the interparticle force and reorganize the cake.
Finally, a behavioral model for the evolution of the pressure drop has been made and allow obtaining characteristic parameters such as a time constant and a coefficient of proportionality for each test. The evolutions of these parameters as a function of the operating parameters (relative humidity and pressure drop clogging) have made it possible to develop a model of the fall of pressure drop during the passage of moist air over a deposition of soot particles. It has been shown that this model gives results, which are faithful to the observed in pressure drops falling, that is to say a sudden decrease and then a much slower decrease. The final pressure drop values are acceptable compared to experimental final pressure drop. However, the model needs to be improve. More experimental points need to be done with more relative humidity applied to the deposit and more clogging pressure drop. This would make it possible to refine the evolution of the time constant as a function of the relative humidity and of the proportionality coefficient as a function of the clogging pressure drop. In addition, to confirm that the proposed set of equations remains valid over a wide operating range with reasonable accuracy, one of the future prospects is to compare them with other sets of data from experiments. Moreover, by carrying out other tests with soot of different sizes and depending on the results obtained, it would then be possible to have an expression of the decrease in pressure drop depending on the size of the particles or other properties specific to the particles used. This would allow obtaining a more general expression applicable to any particle size.
Supplemental Material
Download MS Word (82.1 KB)Acknowledgments
This work is a part of the LIMA joint research program between the French Institute for Radioprotection and Nuclear Safety (IRSN) and the Reactions and Chemical Engineering Laboratory (LRGP) of the National Center for Scientific Research (CNRS) and the Lorraine University. This study was also supported by CPER SusChemProc.
References
- Bescond, A., J. Yon, F. X. Ouf, D. Ferry, D. Delhaye, D. Gaffié, A. Coppalle, and C. Rozé. 2014. Automated determination of aggregate primary particle size distribution by TEM image analysis: Application to soot. Aerosol Sci. Technol. 48 (8):831–41. doi: 10.1080/02786826.2014.932896.
- Bourrous, S., L. Bouilloux, F.-X. Ouf, P. Lemaitre, P. Nerisson, D. Thomas, and J. C. Appert-Collin. 2016. Measurement and modeling of pressure drop of HEPA filters clogged with ultrafine particles. Powder Technol. 289 (février):109–17. doi: 10.1016/j.powtec.2015.11.020.
- Gupta, A., J. V. Novick, P. Biswas, and P. R. Monson. 1993. Effect of humidity and particle hygroscopicity on the mass loading capacity of High Efficiency Particulate Air (HEPA) filters. Aerosol Sci. Technol. 19 (1):94–107. doi: 10.1080/02786829308959624.
- He, X., B. T. Brem, Y. K. Bahk, Y. Kuo, and J. Wang. 2016. Effects of relative humidity and particle type on the performance and service life of automobile cabin air filters. Aerosol Sci. Technol. 50 (6):542–54. doi: 10.1080/02786826.2016.1167832.
- Hinds, W. C. 1999. Aerosol technology: Properties, behavior, and measurement of airborne particles. New York: John Wiley & Sons.
- Joubert, A., J. C. Laborde, L. Bouilloux, S. Callé-Chazelet, and D. Thomas. 2010. Influence of humidity on clogging of flat and pleated HEPA filters. Aerosol Sci. Technol. 44 (12):1065–76. doi: 10.1080/02786826.2010.510154.
- Joubert, A., J. C. Laborde, L. Bouilloux, S. Chazelet, and D. Thomas. 2011. Modelling the pressure drop across HEPA filters during cake filtration in the presence of humidity. Chem. Eng. J. 166 (2):616–23. doi: 10.1016/j.cej.2010.11.033.
- Joubert, A. 2009. Performances des filtres plissés à Très Haute Efficacité en fonction de l’humidité relative de l’air. PhD diss., Inpl.
- Montgomery, J. F., S. I. Green, and S. N. Rogak. 2015. Impact of relative humidity on HVAC filters loaded with hygroscopic and non-hygroscopic particles. Aerosol Sci. Technol. 49 (5):322–31. doi: 10.1080/02786826.2015.1026433.
- Moore, R. H., L. D. Ziemba, D. Dutcher, A. J. Beyersdorf, K. Chan, S. Crumeyrolle, T. M. Raymond, K. L. Thornhill, E. L. Winstead, and B. E. Anderson. 2014. Mapping the operation of the Miniature Combustion Aerosol Standard (Mini-CAST) soot generator. Aerosol Sci. Technol. 48 (5):467–79. doi: 10.1080/02786826.2014.890694.
- Nerisson, P., O. Nouri, F.-X. Ouf, M. Barrault, and D. Thomas. 2015. Clogging of flat and pleated HEPA filters with soot particles: Effect of relative humidity. Milano: European Aerosol Conference.
- Pei, C., Q. Ou, and D. Y. H. Pui. 2019. Effect of relative humidity on loading characteristics of cellulose filter media by submicrometer potassium chloride, ammonium sulfate, and ammonium nitrate particles. Sep. Purif. Technol. 212 (avril):75–83. doi: 10.1016/j.seppur.2018.11.009.
- Pei, C., Q. Ou, T. Yu, and D. Y. H. Pui. 2019. Loading characteristics of nanofiber coated air intake filter media by potassium chloride, ammonium sulfate, and ammonium nitrate fine particles and the comparison with conventional cellulose filter media. Sep. Purif. Technol. 228 (décembre):115734. doi: 10.1016/j.seppur.2019.115734.
- Penicot, P., D. Thomas, P. Contal, D. Leclerc, and J. Vendel. 1999. Clogging of HEPA fibrous filters by solid and liquid aerosol particles: An experimental study. Filtr. Sep. 36 (2):59–64. (99)80036-6. doi: 10.1016/S0015-1882(99)80036-6.
- Ribeyre, Q., A. Charvet, C. Vallières, and D. Thomas. 2017. Impact of relative humidity on a nanostructured filter cake – Experimental and modelling approaches. Chem. Eng. Sci. 161 (avril):109–16. doi: 10.1016/j.ces.2016.12.013.
- Ribeyre, Q., G. Grévillot, A. Charvet, C. Vallières, and D. Thomas. 2014. Modelling of water adsorption–condensation isotherms on beds of nanoparticles. Chem. Eng. Sci. 113 (juillet):1–10. doi: 10.1016/j.ces.2014.03.027.
- Ribeyre, Q. Influence de l’humidité de l’air sur la perte de charge d’un dépôt nanostructuré. PhD diss., INPL 2015.
- Sun, Z., Y. Liang, W. He, F. Jiang, Q. Song, M. Tang, and J. Wang. 2019. Filtration performance and loading capacity of nano-structured composite filter media for applications with high soot concentrations. Sep. Purif. Technol. 221 (août):175–82. doi: 10.1016/j.seppur.2019.03.087.
- Thomas, D., P. Penicot, P. Contal, D. Leclerc, and J. Vendel. 2001. Clogging of fibrous filters by solid aerosol particles experimental and modelling study. Chem. Eng. Sci. 56 (11):3549–61.(01)00041-0. doi: 10.1016/S0009-2509(01)00041-0.
- Walsh, D. C. 1996. Recent advances in the understanding of fibrous filter behaviour under solid particle load. Filtr. Sep. 33 (6):501–6. doi: 10.1016/S0015-1882(97)84316-9.
- Walsh, D. C., J. I. T. Stenhouse, K. L. Scurrah, and A. Graef. 1996. The effect of solid and liquid aerosol particle loading on fibrous filter material performance. J. Aerosol Sci. 21:S617–S18. (96)00381-3. doi: 10.1016/0021-8502(96)00381-3.
- Yon, J., A. Bescond, and F.-X. Ouf. 2015. A simple semi-empirical model for effective density measurements of fractal aggregates. J. Aerosol Sci. 87 (septembre):28–37. doi: 10.1016/j.jaerosci.2015.05.003.