
 ?Mathematical formulae have been encoded as MathML and are displayed in this HTML version using MathJax in order to improve their display. Uncheck the box to turn MathJax off. This feature requires Javascript. Click on a formula to zoom.
Abstract
Little is known about aerosol deposition in macaques, variability in deposition between animals, or how deposition in macaques and humans compare. This is despite the use of macaques in assessments of toxic aerosols that are often translated to estimates of human exposure. We used three dimensional (3D) physical models of the upper airways and trachea (UAT) of Rhesus macaques to begin to fill in this information gap. Models of the UAT of five, living rhesus macaques were produced from CT scans, using 3D printing technology. Models were exposed to a polydisperse aerosol containing 0.54 to 9.65 micron particles, during constant flowrates of 2, 4, and 6 liters per min. Percent deposition in UAT models was quantified using an Aerodynamic Particle Sizer and was compared to in vivo upper airway deposition in ten, adult human subjects. Deposition in the UAT models increased as Stokes number increased. Deposition also varied significantly between models, but intermodel variability was reduced when plotted as a function of Stokes number. Using Stokes number, deposition in four of the five UAT models overlapped with each other and also overlapped with human upper airway deposition. These models could be used to explore the relationship between factors that affect toxic aerosol deposition in the UAT in vitro and pathology following toxic aerosol exposure in Rhesus macaques in vivo. Results from those experiments could also be applicable to humans because of deposition similarities.
Copyright © 2020 American Association for Aerosol Research
EDITOR:
Introduction
The respiratory system is a major site of interest for toxicological exposure assessments because of its important role in gas exchange. Although, in vivo quantification of deposition of inhaled toxicological agents in the human respiratory system is not possible, studies can be performed in animals. Information to be gained from animal studies include estimates of lethal dose as well as identification of sites of pathology within the respiratory system, resulting from the exposure (Dabisch et al. Citation2017).
The upper airways serve to conduct ambient air to the lower airways and are, therefore, often the first site of injury from inhaled toxicological agents. The upper airways also filter large particles from the ambient air, thereby affecting the dose of inhaled toxicants that reach the lower airways. In humans, inhaled particles >5 µm have a high probability of depositing in the upper airways during nasal breathing (Heyder Citation2004). Unlike rodents, the anatomy of the nasal passages of macaques indicates these animals might be a good model for estimating deposition of aerosolized agents in humans. In both humans and macaques, the upper airways exhibit a 90º turn in the pharynx, the maxillary sinuses are large and the turbinate bones are comma-shaped. (Desesso Citation1993). Although, the absolute volume and surface area of human nasal airways are larger than those of macaques, the relative nasal surface area of the two species have been shown to be nearly the same (Desesso Citation1993). In contrast, the relative surface area of the nasal airways of the rat is much larger than that of humans, or macaques (Desesso Citation1993). In addition, unlike rats, mice, hamsters, and guinea pigs, the anatomy of the epiglottis and soft palate of humans and macaques allows for breathing through the nose and mouth (Desesso Citation1993). Thus, monkeys, like humans, are oro-nasal breathers and particles may be filtered from the ambient air and deposit in the upper airways during nasal breathing (i.e., at rest, or during mild activity) before delivery to the lungs.
Bioaerosol particles can vary in size between 1 micron (µm) and 100 µm (Bovallius et al. Citation1978; Lighthart and Shaffer Citation1995; Montero, Dueker, and O’Mullan Citation2016; Polymenakou et al. Citation2008). Several investigators have shown that the lethal dose for infectious bioaerosols in Rhesus macaques increases (i.e., the exposure becomes less toxic) as particle size increases (Day and Berendt Citation1972; Druett et al. Citation1953). In addition, Druett et al. (Citation1953) and Day and Berendt (Citation1972) showed that the site of pathology following inhalation of Bacillus anthracis spores and particles containing Francisella tularensis, respectively, shifted from the lungs to the upper airways in Rhesus macaques, when animals were exposed to infectious particles ≥10 µm, compared to smaller particles (i.e., 1 µm and 2 µm).
Despite similarities to human upper airway anatomy, particle deposition studies are rarely conducted in live macaques, because the animal testing approval process is long and testing is expensive and raises ethical questions. Quantification of aerosol deposition in three-dimensional (3D) models of macaque airways could be an alternative to studying deposition in the airways of live macaques. Models have a number of advantages. They do not change over time, approval is not required prior to exposures, since they do not involve live animals, and multiple data points can be obtained easily and quickly. Such models could be used to explore the relationship between factors that affect airway deposition of toxic aerosols in vitro and airway pathology following exposure to toxic aerosols in vivo. Results from these experiments could be applicable to humans, if Rhesus macaque model deposition and deposition in humans are similar.
Few deposition studies have been conducted using 3D models of the upper airways of Rhesus macaques. In addition, studies that have been carried out did not use models based on living animals and did not include more than one animal as the model. Therefore, little is known about upper airway particle deposition in models based on living animals and less is known regarding deposition variability. Finally, little is known about in vitro deposition in models of the upper airways of Rhesus macaques, compared to in vivo deposition in human upper airways. This study was designed to address this knowledge gap. The objectives of this study were to: (1) quantify particle deposition in 3D models of the upper airways and trachea (UAT) of several live Rhesus macaques, under varying flowrate conditions; (2) explore deposition variability between the models; and (3) compare in vitro deposition in the UAT models with upper airway deposition obtained in vivo in adult humans.
Methods
Model production
Physical models of the UAT were produced from CT scans of five, healthy, live Rhesus macaques, using stereolithography (SLA) technology and a VIPER si2® SLA® SYSTEM (3D Systems; Rock Hill, South Carolina). Somos Watershed XC 11122 (DSM Functional Materials; Somos® Material Group, Elgin, IL, USA), a low viscosity liquid photopolymer, was the print material. Scans were obtained from the National Biodefense Analysis and Countermeasures Center (NBACC, Frederick, MD, USA). CT images were processed using ITK-SNAP interactive software (www.itksnap.org) that converted the CT files into a 3D polygonal file.
The 3D file was modified by closing the mouth opening and attaching an exit tube at the end of the trachea using Geomagic Design X (3D systems). The mouth opening was closed in order to isolate particle deposition to nasal breathing alone. The 3D file was also sectioned into four segments using the SLA system. Four holes were inserted into the file around the periphery of each of the segments using Geomagic Design X. None of the holes passed through the model airways. When the model was printed, four rods were passed through these holes to hold the segments together. We chose to divide the upper airways into segments in order to quantify regional deposition within each segment in future experiments. Files were saved as STL files for 3D printing. Each model included the animal’s face with nostrils, nasal passages, pharynx, larynx and entire length of trachea to carina. We chose to include the trachea in our UAT models because the scans we used to generate each model provided complete images of the trachea and we decided that inclusion of the trachea would provide additional information regarding deposition estimates.
Experimental setup
The experimental setup is shown in . Models were individually placed in a large Plexiglass chamber (60" × 36" × 48") and were connected to an Aerodynamic Particle Sizer (APS) (TSI Model 3321; Shoreview, MN, USA). All measurements were made with one APS to eliminate any sampling differences due to the use of different units.
Figure 1. Photo showing the components of the experimental setup.
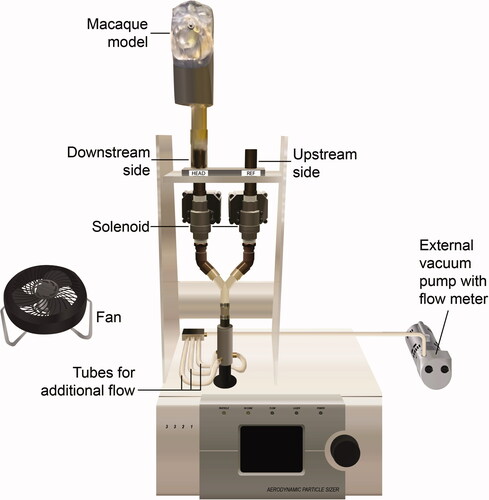
The APS pulled 1 liter per minute (LPM) of air through its inner nozzle. Since these experiments were designed to test deposition in the model at flowrates above 1 LPM, an external vacuum pump with a flow meter was used to pull additional air through the downstream and upstream sides of the setup. The external pump was connected to the setup via three tubes (). During exposures, the pump pulled a constant inspiratory airflow to achieve total flowrates of 2, 4, and 6 LPM through the downstream and upstream sides. These flows represented breathing rates for monkeys at rest and during moderate and high activity, respectively (Kelly, Asgharian, and Wong Citation2005).
Mucus simulation
Prior to exposure to the test aerosol, an aerosol of Mazola corn oil (ACH Food Companies, Oak Brook, Terrace, IL, USA) was generated by nebulizer and drawn through the models using the vacuum pump to coat the inside surfaces and simulate naturally occurring airway mucus.
Test aerosol
The test aerosol was Arizona Test Dust (ATD), a solid polydisperse aerosol that contained dry particles ranging in size between 0.54 and 9.65 microns. Approximately 0.06 ± 0.004 g of ATD was aerosolized into the chamber during each exposure, using a two fluid nozzle system.
Aerosol concentration
To insure uniform ATD concentration, a fan in the chamber mixed the air for 45 s before sampling and throughout the experiment (). In addition, upstream and downstream particle concentrations were measured by the APS without the model. The difference in upstream and downstream particle concentrations was less than 1% for 1 to 10 µm particles. This meant that particles entering the model and the upstream channel were similar in concentration. Total aerosol concentration in the chamber was less than 1000 particles/cm3, as measured by the APS. At 1000 particles/cm3, the APS manual indicates there is a less than 2% coincidence for 0.5 µm particles and less than 6% coincidence for 10 µm particles.
APS sampling
During air-mixing, the APS sampled air from the upstream side for 20 s (i.e., upstream measurement #1). The operator closed the upstream channel and opened the downstream channel using the solenoid switches (). The APS then sampled from the downstream side for 20 s (i.e., downstream measurement). The operator closed the downstream channel, opened the upstream channel and again sampled from the upstream side for 20 s (i.e., upstream measurement #2). All switching procedures took 10 s. Upstream measurement #2 was used as the upstream measurement #1 for the next run. Upstream measurements #1 and #2 were averaged. Each downstream measurement and the average of the two upstream measurements were recorded as a run. There were 30 runs per flow rate.
APS particle size bins
For each run, deposition was quantified for APS specified particle bins between 0.54 µm and 9.65 µm. The upper limit of 9.65 um for the particle size bins was selected because upstream measurements of the Arizona Road Dust with the APS typically produced about 50,000 counts per 20-s interval, with the peak count in the APS size bins near 1 μm. However, at approximately 10 μm, the counts were considerably less, particularly for the downstream samples. Since the variability induced by random errors associated with such small counts could induce uncertainty in the UAT deposition values, we needed to limit the upper particle size such that the results would be acceptable. The upper particle size limit was determined as follows. Using data from macaque 5990 at a flow rate of 6 L/min, we calculated the average number of upstream and downstream counts per 20-s interval for each APS particle size bin in the range of 7.77 to 12.86 μm. We then calculated a parameter to indicate data scatter. This parameter was the coefficient of variation of aerosol penetration values, CVi, which is the ratio of the standard deviation to the mean of APS results for the ith size channel. Aerosol penetration, rather than deposition (ηi), was used for the analysis, since it was the performance result that was calculated directly from the raw data. Penetration and deposition are related by:
A suitable upper particle size limit was selected with the maximum usable size bin being the one, above which there was a pronounced increase in scatter of results. Data in show that the CV increased from 0.24 for the APS bin below the 9.65 μm bin to a value of 0.51 for the bin above the 9.65 μm bin. For the downstream aerosol samples, single digit average APS counts were measured in bins with sizes greater than 9.65 μm, which likely was a major factor in the increase in CV values. As a result of this analysis, useful data were restricted to that provided by the 9.65 μm and smaller APS size bins.
Table 1. Results from tests with Macaque 5990 to select an upper particle size limit for reportable data.
UAT deposition
UAT deposition for each particle size bin (ηi) was expressed as a percent by dividing the downstream measurement (aerosol exiting the model) by the average of the two upstream measurements, subtracting from 1 and multiplying by 100, as shown in EquationEquation (1)(1)
(1) .
(1)
(1)
Percent UAT deposition was graphed as a function of impaction parameter, Stokes number and a combination of Stokes number and Reynolds number. Impaction parameter was calculated using EquationEquation (2)(2)
(2) .
(2)
(2)
where d = particle diameter; Q = flowrate
Stokes number was calculated using EquationEquation (3)(3)
(3) (Schroeter et al. Citation2013; Swift Citation1991).
(3)
(3)
d = particle diameter; ρ = particle density (1 g/cm3); µ = dynamic viscosity (1.81 × 10⁻⁴ g/cm s); U = characteristic airflow; dc = characteristic diameter; Cc Cunningham slip correction factor.
Incorporating a characteristic aspect of nasal geometry into calculations of Stokes number makes it possible to scale and compare models from different sources (Zhou et al. Citation2013). For these experiments, the characteristic aspect “dc” was the square root of the minimum cross-sectional area (Amin).
A combination of Stokes number and Reynolds number was calculated using EquationEquation (4)(4)
(4) (Golshahi et al. Citation2011). Golshahi et al. (Citation2011) fitted the exponentials of 1.23 and 1.28 for Stokes number and Reynolds number, respectively, to minimize variability. For our calculations, we did not determine the exponential values, but selected those used by Golshahi et al. (Citation2011).
(4)
(4)
Amin determination
A 3D numerical mesh was generated from the STL files used to print the UAT models, using Ansys ICEMCFD software (https://ansys-icem-cfd.software.informer.com). This mesh was constructed in the empty nasal airway space that was surrounded by the airway surface. A line was drawn from the point directly between the nostrils and the point on the rear center of the septum where the left and right nasal airways join. The nasal airway was sliced cross-sectionally along the line at many locations. Tecplot 360 software (https://www.tecplot.com) was used to compute the area of each cross-section. The minimum cross-sectional area for all the slices was reported as Amin.
Human subjects
Percent deposition for each macaque UAT model was compared with percent human upper airway deposition, quantified in vivo in 10 adult subjects who were studied previously using a similar approach. Detailed information about the human subjects and the experimental methodology used to quantify deposition can be found in Kesavanathan and Swift (Citation1998). Briefly, subjects in that study were healthy Asian American and European American individuals aged 23–60 years. Subjects were exposed to a polydisperse diethyl hexyl sebacate aerosol that was generated into a small chamber using a high-voltage electrospray method. A nosepiece was connected to the aerosol chamber through a sampling port. A mouthpiece was also connected through a sampling port to a vacuum pump. Subjects took a deep breath, closed their glottis, and placed the nosepiece over the nose and the mouthpiece into their mouth. The vacuum pump pulled the aerosol in through the nose and out through the mouth. An APS quantified the particle size and concentration of aerosol entering the nose and exiting the mouth. Three constant air flowrates were used in this study: 15, 25, and 35 LPM. These flowrates represented breathing rates between rest and heavy exercise, respectively, for adults, as determined by the International Commission on Radiological Protection (Ann ICRP 1994). Acoustic rhinometry was used to measure the minimum cross-sectional area (Amin) of the nasal passages, as described previously (Kesavanathan and Swift Citation1998). Deposition was determined for 13 particle sizes, ranging from 2.1 µm to 6.3 µm. Tracheal deposition was not included in these measurements.
Although, the human study did not include the trachea, we assumed deposition in the UAT of the macaque models could be compared with deposition in the upper airways of the humans. This is because particle deposition in the tracheal and bronchial region combined of humans has been shown to be quite low, with less than 7% for particles between 0.5 µm to 10 µm (Hinds Citation1999). Given the larger diameter of the trachea, compared to bronchial airways, it is likely that most of this deposition occurs in the bronchial region, with little deposition in the trachea in healthy humans.
Data analysis
Average percent deposition (± standard deviation) for the 30 runs was quantified for each UAT model at each of the three flowrates and for each particle size. Calculations included deposition in the nasal airways, the nasopharnyx, the larynx and the trachea combined. Deposition was calculated as a function of impaction parameter, Stokes number and a combination of Stokes number and Reynolds number as described above.
Deposition based on impaction parameter and Stokes number for each UAT model was compared to in vivo human upper airway deposition (no trachea) obtained in 10 adult human subjects studied previously by Kesavanathan and Swift (Citation1998) (see above for details).
Results
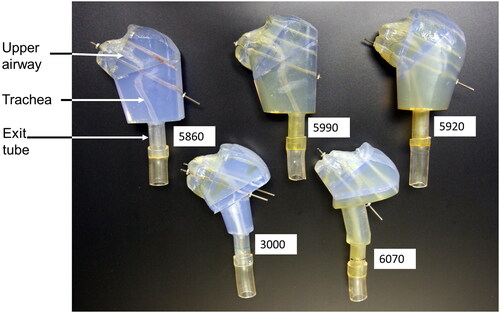
Photographs of the UAT model for each macaque in the study are shown in . The angle of the animal’s head represents the head orientation when the CT scan was obtained and differed between animals. Each model consisted of the animal’s face, nostrils, upper airway, and the entire length of the trachea. The upper airway and trachea can be seen within each model. The mouth opening was closed in these models.
Figure 2. Photographs of the upper airway and trachea for each macaque used in the study. The upper airway, trachea, and exit tubing are labeled. Four metal rods were passed through four holes in each model segment to hold the segments together. This figure shows the models with one, or two, of the rods inserted through the four segments. Each model was attached to the APS through the exit tubing.
Characteristics of the macaques upon which the models were based are summarized in . Characteristics include gender, age at the time of the CT scan, weight and Amin. Macaques are considered adults between 4 and 8 years of age (Golub et al. Citation1984). Females reach puberty around age three. Male macaques are sexually active by age four (Rawlins and Kessler Citation1986). Based on this information and their age, three female macaques in our study appear to be adolescents, while a fourth female and the sole male appear to be adults.
Table 2. Characteristics of the five, living Rhesus macaques upon which the UAT models were based.
Percent deposition for each macaque UAT model is shown as a function of impaction parameter in . Impaction parameter was calaculated using EquationEquation (2)(2)
(2) . also shows percent deposition in the upper airways (no trachea) for each of 10 human subjects as a function of impaction parameter. Data for the 10 human subjects were obtained in vivo as part of a previoulsy reported study (Kesavanathan and Swift Citation1998). For both the UAT models and humans, deposition increased as impaction parameter increased. Deposition for three of the UAT models overlapped with each other and also overlapped with the human subject data. In contrast, deposition in two models (i.e., 5860 and 5920) did not overlap with the other three models, or with the human subject data. Data based on UAT models 3000, 5990, and 6070 and for the human subjects demonstrated approximately 20–30% deposition for the impaction parameter of 100 µm2 × LPM. In contrast, models 5860 and 5920 showed approximately 65% and 90% deposition for the same impaction parameter, respectively.
Figure 3. Percent deposition in each of five models of the upper airways and trachea combined (UAT) for the Rhesus macaques, as well as percent deposition in the upper airways (no trachea) for each of 10 human subjects as a function of impaction parameter. Data for the 10 human subjects were obtained in vivo as part of a previously reported study (Kesavanathan and Swift Citation1998). Each UAT model is identifiable by symbol and number.
Percent deposition for each macaque UAT model and in the upper airways for each of the 10 human subjects is shown as a function of Stokes number in . Stokes number was calculated using EquationEquation (3)(3)
(3) , which makes it possible to compare results from different sources. For both the UAT models and humans, deposition increased as Stokes number increased. Compared to , variability in deposition between UAT models was reduced. Deposition for four UAT models (i.e., 5850, 6070, 5990, and 3000) overlapped, when compared to each other, and overlapped with the human subject data. UAT deposition for model 5920 remained dissimilar from the other four models and did not overlap with the human data. Percent deposition was estimated to be approximately 40–60% for UAT models 5850, 6070, 5990, and 3000 at a Stokes number of 0.01. In contrast, percent deposition for UAT model 5920 was approximately 100%.
Figure 4. Percent deposition in each of five models of the upper airways and trachea combined (UAT) for the Rhesus macaques, as well as percent deposition in the upper airways (no trachea) for each of the 10 human subjects as a function of Stokes number. Each UAT model is identifiable by symbol and number. Data for the 10 human subjects were obtained in vivo as part of a previously reported study (Kesavanathan and Swift Citation1998).
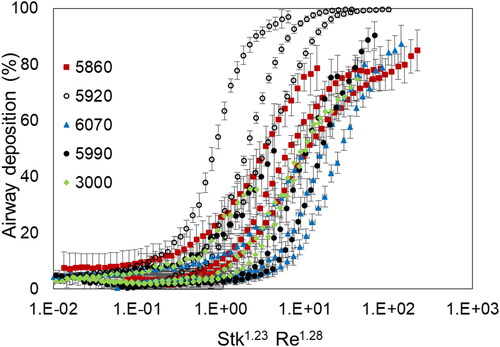
Percent deposition for each macaque UAT model is shown as a function of Stokes number and Reynolds number combined in . Stokes number and Reynolds number combined were calculated using EquationEquation (4)(4)
(4) . Variability in deposition between UAT models increased using this combination, compared to using Stokes number alone ().
Figure 5. Percent deposition in each of five models of the upper airways and trachea combined (UAT) for the Rhesus macaques, as a function of a combination of Stokes number and Reynolds number. Each UAT model is identifiable by symbol and number.
Discussion
To our knowledge, this is the first study to quantify deposition and deposition variability in the upper airways and trachea of physical models based on more than one, living Rhesus macaque. For all UAT models, percent deposition increased with increasing Stokes number. Using impaction parameter, deposition varied significantly between models. Deposition in only three of five UAT models overlapped. However, intermodel variability was reduced when plotted as a function of Stokes number. Deposition in four of the five UAT models overlapped with each other and also overlapped with the human upper airway, when plotted as a function of Stokes number.
Stokes number calculations include characteristic diameters such as Amin to improve comparison of deposition between different sources. However, despite the inclusion of individual Amin values in our calculations, UAT deposition for model 5920 did not overlap with deposition in the other models. This lack of overlap does not appear to be due to a difference in gender, or age. Model 5920 was based on an animal of the same age and gender as the animals upon which models 5860 and 5990 were based. Yet, deposition in model 5920 was dissimilar from models 5860 and 5990.
In an attempt to further reduce variability between models, we plotted deposition based on Stokes number and Reynolds number combined using EquationEquation (4)(4)
(4) . However, this combination did not improve intermodel variability. In fact, variability increased. Although, this combination of parameters may not be appropriate for deposition calculations in Rhesus macaques, we note that Zhou et al. (Citation2014) also showed no improvement in reducing variability, using this combination in his computational study of deposition in infants.
In the past, airway models have been produced from MRIs (Magnetic Resonance Images), or from nasal casts of cadavers (Janssens et al. Citation2001; Kelly, Asgharian, and Wong Citation2005; Swift Citation1991; Zwartz and Guilmette Citation2001). However, production techniques for models based on MRIs can vary, resulting in different models from the same original scans (Kelly et al. Citation2004). In addition, postmortem casts may not be a good representation of in vivo nasal airways, and could result in measurement inaccuracies. This is because cells can dry and structural changes may occur postmortem, leading to larger nasal volumes than in life (Harkema Citation1991). In recent years, particle deposition studies have utilized 3D printed models based on CT scans (Golshahi et al. Citation2011, Citation2013). These scans are easier to acquire, compared to MRI scans, and are more accurate than nasal cast models. For these reasons, we chose to use CT scans in this study.
The only other study we could identify in the literature that quantified upper airway deposition in a physical model, based on an adult Rhesus macaque, was that of Kelly, Asgharian, and Wong (Citation2005). In that study, the investigators quantified deposition in a physical model of the upper airways of a rhesus macaque, based on the cadaver of one animal. Then, they compared deposition in the macaque model to deposition in two 3D models based on MRIs of the upper airways of the same human. Results from that study showed that deposition in the upper airways of the macaque model was similar to that of deposition in the human models, when plotted as a function of Stokes number that also incorporated the square root of the minimum cross-sectional area (Amin) as the characteristic aspect “dc” (EquationEquation (3)(3)
(3) ). Interestingly, the authors report average Amin as 0.43 cm2 in their study, which is similar to Amin values we report.
However, data from Kelly’s study indicates upper airway deposition was less than 20% for their macaque model at Stokes number of 0.01. This was significantly less than what was estimated for UAT deposition in the present study at the same Stokes number.
Differences in deposition estimates between the two studies could be accounted for in several ways. For reasons explained above, the use of a model based on a cadaver instead of one based on a living monkey could partially account for the observed differences between our study and that of Kelly, Asgharian, and Wong (Citation2005). In addition, we found that deposition varied between our models, such that extremes in deposition may occur, depending on what animal the model is based on. Thus, it is possible that the one macaque chosen as the model in the Kelly study resulted in deposition at one extreme of the range of values. This is similar to what we observed in our study where four models produced similar deposition values and one model appeared to be an outlier. These findings suggest that, in future experiments, investigators should include models based on more than one animal to increase the probability of capturing the full range of deposition possibilities.
Dabisch et al. (Citation2017) conducted particle deposition studies in live, anesthetized rhesus macaques using aerosols between 1 µm and 10 µm, radiolabled with the positron-emitting isotope fluorodeoxyglucose (F18-FDG). Deposition within various regions of interest in the animal body, including the nasal/oral region and tracheal/esophageal region, was estimated using a positron emission tomography/computed tomography (PET/CT) scanner. Unlike our study, macaques in that study inhaled ad libitum, during cyclic breathing (i.e., during inhalation and exhalation). Therefore, it is not known at what flowrate animals were breathing during exposure.
Similar to our model study, Dabisch et al. (Citation2017) found that the percent of material deposited in the combined nasal/oral region plus tracheal/esophageal region of their anesthetized animals increased as particle size increased. However, deposition in the combined two regions of the anesthetized animals averaged 47.3%, 73.4%, 85.8%, and 95.8% for 1.7 µm, 3.6 µm, 7.4 µm, and 11.8 µm particles, respectively, which was higher than the average deposition values in the UAT models in the present study for similar particle sizes at all flowrates (). Differences between the studies could be due in part to cyclic breathing in vivo versus inhalation at a constant flowrate with the UAT models. In addition, differences could be due to combining deposition in the nasal region with oral deposition and combining tracheal deposition with esophageal deposition in the Dabisch study. There was no oral, or esophageal, deposition in the UAT models, since we did not include an oral cavity, or esophagus.
This is the first study to compare particle deposition in models of the upper airways and trachea based on living, Rhesus macaques to that of the upper airways of living, human subjects. Results from the present study showed that percent deposition in four of five UAT models overlapped with upper airway deposition data obtained in 10 living human subjects, when determined using Stokes number alone. These data indicate that percent deposition in the UAT of Rhesus macaques and upper airways of humans appears to be similar.
In summary, we created 3D models of the upper airways and trachea of five Rhesus macaques based on CT scans of living animals using SLA and 3D printing technology and evaluated the models for particle deposition at various flowrate conditions. For all models, upper airway deposition increased with increasing Stokes number. Deposition varied between models, but intermodel variability was reduced when plotted as a function of Stokes number. Combining Stokes number with Reynolds number did not improve intermodel variability. Using Stokes number, deposition in four of the five UAT models overlapped with each other and also overlapped with the human upper airway deposition. Nevertheless, UAT deposition for one model remained dissimilar from the other four models and did not overlap with the human data. This finding suggests that, in future experiments, investigators should include models based on more than one animal to increase the probability of capturing the full range of deposition possibilities. Results from this study also suggest that these models could be used to explore the relationship between factors that affect toxic aerosol deposition in the UAT in vitro and pathology following toxic aerosol exposure in Rhesus macaques in vivo. Results from those experiments could also be applicable to humans because of deposition similarities.
Acknowledgments
The authors wish to thank the National Biodefense Analysis and Countermeasures Center for providing CT scans of the macaques and the Advanced Design and Manufacturing Branch at CCDC CBC for printing the models. The authors also wish to thank Taylor Stephen Geiser for determining Amin for each model. The authors wish to thank Dr. Douglas Sommerville for his assistance in the statistical analysis, Dr. Andrew McFarland for his assistance in determining the upper limit for particle size, and Dr. Jerold Bottiger for his assistance in the experimental setup.
Disclosure statement
No potential conflict of interest was reported by the author(s).
Additional information
Funding
References
- Bovallius, A., B. Bucht, R. Roffey, and P. Anas. 1978. Three-year investigation of the natural airborne bacterial flora at four localities in Sweden. Appl. Environ. Microbiol. 35 (5):847–52. doi:https://doi.org/10.1128/AEM.35.5.847-852.1978.
- Dabisch, P. A., Z. Xu, J. A. Boydston, J. Solomon, J. K. Bohannon, J. J. Yeager, J. R. Taylor, R. J. Reeder, P. Sayre, J. Seidel, et al. 2017. Quantification of regional aerosol deposition patterns as a function of aerodynamic particle size in rhesus macaques using PET/CT imaging. Inhal. Toxicol. 29 (11):506–15. doi:https://doi.org/10.1080/08958378.2017.1409848.
- Day, W. C., and R. F. Berendt. 1972. Experimental tularemia in Macaca mulatta: Relationship of aerosol particle size to the infectivity of airborne Pasteurella tularensis. Infect Immun. 5 (1):77–82. doi:https://doi.org/10.1128/IAI.5.1.77-82.1972.
- DeSesso, J. M. 1993. The relevance to humans of animal models for inhalation studies of cancer in the nose and upper airways. Qual. Assur. 2:213–31.
- Druett, H. A., D. W. Henderson, L. Packman, and S. Peacock. 1953. Studies on respiratory infection. I. The influence of particle size on respiratory infection with anthrax spores. J. Hyg. 51 (3):359–71.
- Golshahi, L., M. L. Noga, R. B. Thompson, and W. H. Finlay. 2011. In vitro deposition measurement of inhaled micrometer-sized particles in extrathoracic airways of children and adolescents during nose breathing. J. Aerosol Sci. 42 (7):474–88. doi:https://doi.org/10.1016/j.jaerosci.2011.04.002.
- Golshahi, L., M. L. Noga, R. Vehring, and W. H. Finlay. 2013. An in vitro study on the deposition of micrometer-sized particles in the extrathoracic airways of adults during tidal oral breathing. Ann. Biomed. Eng. 41 (5):979–89. doi:https://doi.org/10.1007/s10439-013-0747-0.
- Golub, M. S., M. E. Gershwin, L. S. Hurley, W. Y. Saito, and A. G. Hendrickx. 1984. Studies of marginal zinc deprivation in rhesus monkeys. IV. Growth of infants in the first year. Am. J. Clin. Nutr. 40 (6):1192–202. doi:https://doi.org/10.1093/ajcn/40.6.1192.
- Harkema, J. R. 1991. Comparative aspects of nasal airway anatomy: Relevance to inhalation toxicology. Toxicol. Pathol. 19 (4_part_1):321–36. doi:https://doi.org/10.1177/0192623391019004-102.
- Heyder, J. 2004. Deposition of inhaled particles in the human respiratory tract and consequences for regional targeting in respiratory drug delivery. Proc. Am. Thorac Soc. 1 (4):315–20. doi:https://doi.org/10.1513/pats.200409-046TA.
- Hinds, W. C. 1999. Respiratory deposition. In Aerosol technology: Properties, behavior, and measurement of airborne particles, 233–59. New York: Wiley.
- Human respiratory tract model for radiological protection: A report of a Task Group of the International Commission on Radiological Protection. 1994. Ann ICRP 24 (1–3):1–482. doi:https://doi.org/10.1093/annhyg/38.inhaled_particles_VII.251.
- Janssens, H. M., J. C. De Jongste, W. J. Fokkens, S. G. F. Robben, K. Wouters, and H. A. W. M. Tiddens. 2001. The sophia anatomical infant nose-throat (saint) model: A valuable tool to study aerosol deposition in infants. J. Aerosol Med. 14 (4):433–41. doi:https://doi.org/10.1089/08942680152744640.
- Kelly, J. T., Asgharian, B. J. S. Kimbell, and B. A. Wong. 2004. Particle deposition in human nasal airway replicas manufactured by different methods. Part 1: Inertial regime particles. Aerosol Sci. Technol. 38 (11):1063–71. doi:https://doi.org/10.1080/027868290883360.
- Kelly, J. T., B. Asgharian, and B. Wong. 2005. Inertial particle deposition in a monkey nasal mold compared with that in human nasal replicas. Inhal. Toxicol. 17 (14):823–30. doi:https://doi.org/10.1080/08958370500241270.
- Kesavanathan, J., and D. L. Swift. 1998. Human nasal passage particle deposition: The effect of particle size, flow rate, and anatomical factors. Aerosol Sci. Technol. 28 (5):457–63. doi:https://doi.org/10.1080/02786829808965537.
- Lighthart, B., and B. T. Shaffer. 1995. Viable bacterial aerosol particle size distributions in the midsummer atmosphere at an isolated location in the high desert chaparral. Aerobiologica 11 (1):19–25. doi:https://doi.org/10.1007/BF02136140.
- Montero, A., M. E. Dueker, and G. D. O’Mullan. 2016. Culturable bioaerosols along an urban waterfront are primarily associated with coarse particles. PeerJ 4:e2827. doi:https://doi.org/10.7717/peerj.2827.
- Polymenakou, P. N., M. Mandalakis, E. G. Stephanou, and A. Tselepides. 2008. Particle size distribution of airborne microorganisms and pathogens during an intense African dust event in the eastern Mediterranean. Environ. Health Perspect. 116 (3):292–6. doi:https://doi.org/10.1289/ehp.10684.
- Rawlins, R.G., and M. J. Kessler, eds. 1986. Demography of the free-ranging Cayo Santiago macaques (1976-1983). In The Cayo Santiago macaques: History, behavior, and biology, 13–45. Albany, NY: State University New York Press.
- Schroeter, J. D., B. Asgharian, O. T. Price, and G. E. McClellan. 2013. Computational fluid dynamics simulations of inhaled nano- and microparticle deposition in the rhesus monkey nasal passages. Inhal. Toxicol. 25 (12):691–701. doi:https://doi.org/10.3109/08958378.2013.835889.
- Swift, D. L. 1991. Inspiratory inertial deposition of aerosols in human nasal airway replicate casts: Implication for the proposed NCRP lung model. Radiat. Prot. Dosim. 38 (1–3):29–34. doi:https://doi.org/10.1093/oxfordjournals.rpd.a081068.
- Zhou, Y., M. Guo, J. Xi, H. Irshad, and Y. S. Cheng. 2014. Nasal deposition in infants and children. J. Aerosol Med. Pulm. D. 27 (2):110–6.
- Zhou, Y., X. Jinxiang, J. Simpson, H. Irshad, and Y.-S. Cheng. 2013. Aerosol deposition in a nasopharyngolaryngeal replica of a 5-year-old child. Aerosol Sci. Technol. 47 (3):275–82. doi:https://doi.org/10.1080/02786826.2012.749341.
- Zwartz, G. J., and R. A. Guilmette. 2001. Effect of flow rate on particle deposition in a replica of a human nasal airway. Inhal. Toxicol. 13 (2):109–27. doi:https://doi.org/10.1080/089583701300001050.