
Abstract
A systematic study was conducted on the effect of a nitrate functional group on secondary organic aerosol (SOA) products and yields from reactions of C10 alkyl nitrate isomers with OH radicals in the presence of NOx. The 1- through 5-decyl nitrate isomers were synthesized from their corresponding alcohols, reacted in an environmental chamber, and the precursors and SOA were analyzed using online and offline techniques. SOA products were analogous to those formed from similar reactions of the C10 n-alkane (decane), but with an additional nitrate group. The SOA yield was highest when the nitrate group was on the terminal carbon and decreased monotonically from 0.51 to 0.50, 0.44, 0.28, and 0.15 as it moved toward the center of the molecule, at which point it was similar to that from decane. The explanation for this trend, which is supported by results of calculations performed using a kinetics model, involves a combination of the effects of the nitrate group on product vapor pressures and reaction branching ratios. In general, although the nitrate group lowers the vapor pressures of products relative to the corresponding products of the decane reaction, thus enhancing gas-to-particle partitioning and SOA formation, as it moves toward the center of the molecule it also alters the branching ratios for reaction pathways so as to enhance the formation of more volatile products. The results are compared with those from similar studies on ketone and alcohol isomers to gain a more comprehensive understanding of the effects of functional groups on SOA composition and yields.
Copyright © 2020 American Association for Aerosol Research
EDITOR:
Introduction
Volatile organic compounds (VOCs) are emitted to the atmosphere from anthropogenic and natural sources (Finlayson-Pitts and Pitts Citation2000). Once there, they can undergo chemical processing that leads to a myriad of functionalized reaction products with lower vapor pressures, which have an enhanced tendency to undergo gas-to-particle partitioning and form secondary organic aerosol (SOA) (Kroll and Seinfeld Citation2008; Ziemann and Atkinson Citation2012). Concentrations of SOA are highest in urban areas (Zhang et al. Citation2007), and have been shown to have negative health impacts on human populations (Dockery et al. Citation1993). SOA has also been implicated as a cause of poor visibility in cities, often called “urban haze” (Pöschl 2005). An important difference in the composition of air in urban compared to remote areas is the higher concentrations of NOx (NO + NO2), which is generated primarily from combustion (Singh Citation1987). One effect of higher NOx concentrations is increased production of O3 (Perring, Pusede, and Cohen 2013), which affects human health and is damaging to forests and agricultural crops (Krupnick, Harrington, and Ostro Citation1990; Murphy et al. Citation1999). Another consequence is the enhanced formation of organic nitrates, which are formed through reaction of NO with alkylperoxy radicals that are key intermediates in nearly all VOC oxidation mechanisms, and can also be formed by reaction of NO3 radicals with alkenes (Atkinson Citation2000). The formation of organic nitrates sequesters NOx, thus reducing O3 formation, and also reduces VOC volatility, thus potentially enhancing SOA formation (Perring, Pusede, and Cohen 2013). Evidence for the importance of organic nitrates in SOA formation has been obtained from measurements of SOA composition made in or downwind of urban areas as well as modeling studies (Xu et al. Citation2015; Pye et al. Citation2015).
A number of laboratory studies have provided information on the role of organic nitrates in SOA formation from OH radical-initiated reactions of alkanes (Lim and Ziemann Citation2005, Citation2009a, Citation2009b) and alkenes (Matsunaga et al. Citation2009; Matsunaga and Ziemann Citation2009) under high NOx conditions, and from reactions of NO3 radicals with alkenes (Gong, Matsunaga, and Ziemann Citation2005; Ng et al. Citation2008; Fry et al. Citation2014; Yeh, Claflin, and Ziemann Citation2015; Boyd et al. Citation2015; Ng et al. Citation2017; Claflin and Ziemann Citation2018). The experiments with alkanes were conducted under conditions for which first-generation alkyl nitrate products could react with OH radicals to form multi-generation products, but there have not been controlled studies on SOA formation from alkyl nitrates. In previous studies we measured the yields of SOA formed from OH radical-initiated reactions of isomeric alkanes (Lim and Ziemann Citation2009a), ketones (Algrim and Ziemann Citation2016), and alcohols (Algrim and Ziemann Citation2019), and observed large differences that could be explained by the effect of isomer structure on reaction mechanisms. These results, when combined with estimates of the effect of functional groups on VOC vapor pressure, provided a better understanding of the role of VOC structure on SOA products and yields. Here, we extend these studies to alkyl nitrates, and observe interesting similarities and differences with our previous results, all of which yield useful insights into the importance of atmospheric aging on SOA formation.
Experimental
Chemicals
The following chemicals, with listed purities and suppliers were used in this study: 1-decanol, 2-decanol, 3-decanol, 4-decanol, and 5-decanol (≥95%, ChemSampCo); urea (ACS grade, J.T. Baker); acetonitrile (ACS gradient grade, Sigma Aldrich); ethyl acetate (ACS grade, Millipore); 95% aqueous sulfuric acid (ACS grade, Fischer); 70% aqueous nitric acid (ACS reagent grade, Macron); and NO (CP grade, Matheson Tri-Gas). Methyl nitrite was synthesized according to the procedure of Taylor et al. (Citation1980) and stored at room temperature in a lecture bottle. The methyl nitrite purity was determined to be >99% by Fourier transform infrared (FTIR) spectroscopy.
Synthesis of alkyl nitrate isomers
The alkyl nitrate isomers needed for this study were not commercially available, and so were synthesized from the corresponding C10 alcohols using an established method (Boschan, Merrow, and Van Dolah Citation1955). The procedure was as follows: 1 mL of HNO3, 3 mL of H2SO4, and 0.1 g urea were mixed in a small round-bottom flask, which was placed in a salted ice bath. As the acid mixture and the ice bath were both mixed with Teflon stir bars, an alcohol was added dropwise to the acid mixture, at a rate of about 1 drop every 3 s. For safety, no more than 0.5 mL of alcohol was used in each batch. To obtain a reasonable yield (50–90%) it is imperative that the alcohol is added very slowly and the mixture is continually stirred. Failure to do so results in formation of a carbonyl as the primary product. The resulting clear solution was poured over ice in a separatory funnel and extracted into hexane. Purification was achieved by flash chromatography using silica gel (35–75 μm particle size) and a mobile phase of 95:5 hexane:ethyl acetate. Fractions eluting from the column were collected in test tubes, and then an aliquot from each test tube was spotted onto a silica gel-coated thin layer chromatography plate, fractionated using a mobile phase of 95:5 hexane:ethyl acetate, and developed with a permanganate stain to give three spots. The spots due to the precursor alcohol and carbonyl product were identified using standards, and the third spot was the alkyl nitrate, which had the largest retention factor due to its lower affinity for the silica gel stationary phase. All test tubes containing the alkyl nitrate were then combined in one vial, the solvent was evaporated using a stream of UHP N2, and the remaining alkyl nitrate was stored in a freezer at –30°C until needed.
The purity of the alkyl nitrates was determined to be ≥95% using gas chromatography with flame ionization detection (GC-FID), and confirmed using attenuated total reflectance (ATR)-FTIR spectroscopy. For the GC-FID analysis an alkyl nitrate/ethyl acetate solution was injected into the inlet of a Hewlett-Packard 6890 gas chromatograph equipped with a 30 m × 0.53 mm Agilent DB-1701 column with 1 μm film thickness. The injector was held at 40 °C and the column temperature was ramped at 10 °C min−1 to 280 °C and the eluted compounds were quantified with the FID. The purity was quantified as the ratio of FID peak area of the synthesized nitrate over the summed area of all peaks in the chromatogram to obtain the stated purity of ≥95% mass percent. Figure S1 in the online supplementary information (SI) shows the ATR-FTIR spectra of purified 2-decyl nitrate, and 2-decanol and 2-decanone standards, which confirms the high purity of the alkyl nitrates. The three dominant peaks at 1620, 1275, and 860 cm−1 are all indicative of the nitrate group (Day et al. Citation2010), and the sample contains no detectable alcohol, as indicated by the absence of an O–H stretch at 3300 cm−1, or ketone byproduct, as indicated by the absence of a peak at 1720 cm−1.
Chamber experiment protocol
Experiments were performed at ambient temperature (∼25°C) and pressure (∼84 kPa) in an 8 m3 FEP Teflon environmental chamber. Purified air was supplied by AADCO clean air generators (<5 ppb hydrocarbons, and <1% RH). The chamber was first seeded with ∼200 µg m−3 of either dioctyl sebocate (DOS) or dioctyl phthalate (DOP) polydisperse aerosol with peak particle diameter of ∼200 nm, which was added from an evaporation-condensation source. A measured mass of an alkyl nitrate was then added from a heated glass bulb using ultra-high purity (UHP) N2. Thermal decomposition was avoided by heating the bulb to only ∼65°C, well below the temperatures alkyl nitrates encounter during gas chromatographic analysis, and limiting the residence time in the gas phase to ∼1 s by flushing with 15 L min−1 of UHP N2. Glass bulbs containing a measured pressure of methyl nitrite or NO were prepared on a vacuum manifold and added to the chamber with UHP N2 in amounts sufficient to achieve concentrations of 5 ppm of each in the chamber. Reactions were initiated by turning on blacklights that are located on two sides of the chamber for 60 min at a light intensity corresponding to an NO2 photolysis rate constant of 0.37 min−1. Under these conditions OH radicals were generated from the photolysis of methyl nitrite (Atkinson et al. Citation1981) with average concentrations of ∼3 × 10⁷ molecules cm−3, based on the amount of alkyl nitrate that reacted and an estimated rate constant for its reaction with OH radicals (Ziemann and Atkinson Citation2012).
Gas sampling and analysis
The amount of alkyl nitrate that reacted in an experiment was determined by collecting gas samples onto Tenax adsorbent at 250 mL min−1 for 2.0 min at least twice before and twice after the reaction. The Tenax cartridge was then loaded into the inlet of the GC-FID described above and thermally desorbed at 240 °C for 7 min as the column was held at 40 °C. The column temperature was then ramped at 10 °C min−1 to 280 °C and the eluted compounds were quantified with the FID. Chromatograms before reaction were checked to verify that the alkyl nitrate had not thermally decomposed upon addition to the chamber or during analysis, which would have been indicated by the presence of additional peaks. Because Tenax samples were collected at multiple times before and after reaction, it was possible to ensure that gas-wall partitioning equilibrium was established (as indicated by an approximately constant concentration over time). In this case, the concentration of alkyl nitrate reacted can be calculated using the equation [AN]reacted = [AN]T,i(1 − FIDf/FIDi), where [AN]T,i is the mass of added alkyl nitrate divided by the chamber volume, and FIDi and FIDf are the FID signals/volume of air sampled, measured before and after reaction (Yeh and Ziemann Citation2014a). The concentration of NO in the chamber was monitored using a Thermo Fisher 42 C NO-NO2-NOx Analyzer.
Particle sampling and analysis
A scanning mobility particle sizer (SMPS) was used to monitor the particle volume concentrations during seeding and reaction (Tobias et al. Citation2001). Particle composition was monitored in real time using a thermal desorption particle beam mass spectrometer (TDPBMS) (Tobias et al. Citation2000). Duplicate particle samples were also collected on Teflon filters (Fluoropore, 0.45 μm) at 14 L min−1 for ∼90 min after the lights were turned off. Particulate matter was extracted with replicate rinses of ethyl acetate, dried in a stream of UHP N2, reconstituted in acetonitrile, and stored in a freezer at –30°C for later analysis. Extracts were fractionated on a Shimadzu HPLC equipped with an Agilent Zorbax Eclipse Plus XDB-C18 column (250 × 4.6 mm with 5 μm particle size). A binary phase solvent gradient was started at 100% solution A (5% acetonitrile in water) and ramped to 60% A at 2.0% min−1 and then from 60 to 0% A at 1.5% min−1, where it was held for 20 min. Solution B, which made up the remainder of the mobile phase, was pure acetonitrile. Organic compounds containing nitrate groups were detected at 210 nm (Matsunaga and Ziemann Citation2009), and after passing through the detector were atomized in a Collison atomizer to create an aerosol, passed through a Perma Pure nafion dryer to evaporate solvents, and sampled into the TDPBMS to obtain EI mass spectra of individual HPLC peaks.
Quantification of SOA yields
SOA mass yields were calculated for each reaction as the mass of SOA formed divided by the mass of VOC reacted (Odum et al. Citation1996). The mass of alkyl nitrate that reacted was determined by GC-FID analysis as described above. The mass of SOA formed was calculated from the maximum aerosol volume concentration measured with the SMPS (which occurred ∼20–45 min into the reaction), corrected for particle wall loss (Algrim and Ziemann Citation2019) using the measured decay of a characteristic seed particle TDPBMS peak (3–18% h−1 depending on the experiment). Since the DOS and DOP are essentially nonvolatile, the decay in their signal during an experiment could be fully attributed to particle wall loss. This approach does not account for particle size-dependent wall loss rates, but since the average particle diameter grew to >200 nm within a few minutes of initiating the reaction this effect should be negligible in our experiments (Wang et al. Citation2018). The corrected maximum aerosol volume concentration was then converted to a mass concentration by multiplying by the ratio of the mass collected on filters to the aerosol volume concentration integrated over the filter collection period. Typical conversion factors were ∼1.5, and accounted for particle density and errors in calculating the volume distribution from the SMPS measurements. Unpublished comparisons made in our lab using filter samples of spherical DOS and DOP particles of known density indicate that the correction for the SMPS is ∼1.3, consistent with studies indicating errors of up to ±30% in SMPS measurements of aerosol volume concentrations (Wiedensohler et al. Citation2012, Citation2018). This indicates a particle density of ∼1.15 g cm−3, similar to the value of 1.13 g cm−3 measured for SOA formed from a similar reaction of 1-tetradecene (Matsunaga et al. Citation2009), which should consist of compounds with similar composition of functional groups but slightly longer carbon chains. Use of this factor did not change the trends in the SOA yields, but should improve the accuracy of the values. And although reaction products can undergo gas-wall partitioning in environmental chambers (Matsunaga and Ziemann Citation2010; Krechmer et al. Citation2016), thus delaying oxidation and reducing product and SOA yields, no correction was attempted for this process. Such corrections are challenging and usually require either a dynamic model that includes a full reaction mechanism and estimates of product vapor pressures and wall properties (La et al. Citation2016), or measurements of SOA yields using seed particles with a range of surface area concentrations (Zhang et al. Citation2014). Estimates from the modeling study of La et al. (Citation2016) indicate that gas-wall partitioning of products formed from the 60 min reaction of OH radicals with tetradecane, which should have similar vapor pressures to those formed from the reactions of the C10 alkyl nitrates (see discussion below), reduced the measured yield of SOA by ∼35%. Since the effects of gas-wall partitioning should have been similar for the different alkyl nitrate isomers studied, and we were primarily interested in trends in SOA yields, the values measured here should still provide the information needed to evaluate the major effects of a nitrate group and its position on SOA products and yields.
Results and discussion
Reaction mechanism
The proposed mechanism of the OH radical-initiated reaction of decyl nitrates in the presence of NO is shown in , where the 3-decyl nitrate isomer is used as an example. It is based on the well-established mechanism of reaction of n-alkanes (Ziemann Citation2011), with the presence of a nitrate group on the parent compound only altering the branching ratios for the reaction pathways. Reaction occurs by abstraction of an H atom from anywhere along the alkyl chain to form water and a nitrooxyalkyl radical. Abstraction at the α- and β-carbons is deactivated relative to abstraction at the corresponding carbons in decane (Ziemann and Atkinson Citation2012), however, which is an important feature of alkyl nitrate oxidation when compared to ketones and alcohols, where the functional groups mostly activate H atom abstraction. In we show reactions following abstraction at the α-, β-, and γ-carbons. Reaction at the α-carbon is followed by immediate decomposition to a carbonyl and NO2, whereas abstraction anywhere else is followed by addition of O2 to form a nitrooxyperoxy radical. Under high NOx conditions, β-nitrooxyperoxy radicals react with NO to form a β-dinitrate (NN) or a β-nitrooxyalkoxy radical and NO2. This β-nitrooxyalkoxy radical can decompose to a pair of aldehydes and NO2, or isomerize via a 1,5-H-shift and add O2 to form a nitrooxyhydroxy peroxy radical. Reaction of this radical with NO forms a hydroxydinitrate (NHN) or a nitrooxyhydroxy alkoxy radical, which reverse isomerizes and reacts with O2 to form a nitrooxyhydroxy carbonyl (NHC) and HO2. When NHC partition to particles they quickly cyclize to nitrooxy cyclic hemiacetals (NCHA), which can dehydrate to form nitrooxy dihydrofurans (NDHF) through a reaction that is catalyzed by HNO3 formed from the OH + NO2 reaction.
Figure 1. Mechanism of formation of first-generation products of the reaction of 3-decyl nitrate with OH radicals in the presence of NO. On the basis of gas-particle partitioning calculations the products are predicted to mostly partition as follows: 3-Decyl Nitrate, Ketone, Aldehyde, NDHF, Hydroxyaldehyde in the gas phase (green); NHN, NHC, NCHA in the particle phase (red); and NN in the both gas and particle phases (blue).
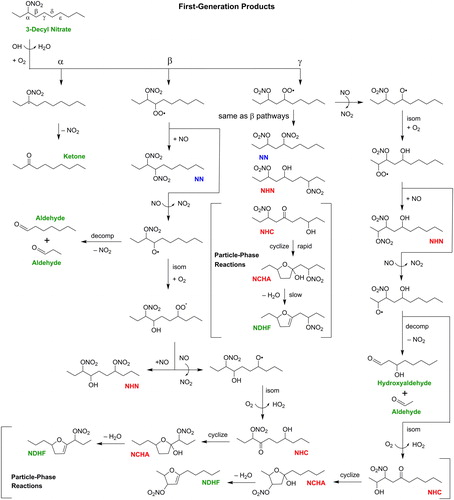
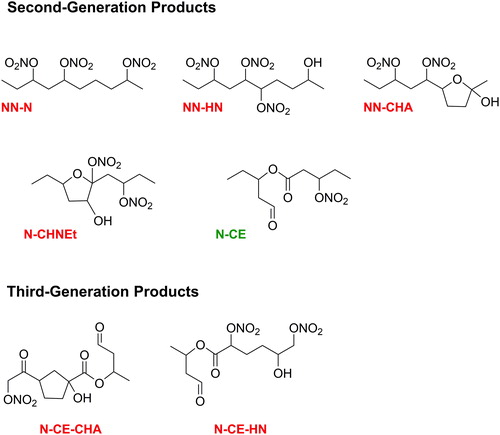
The mechanism of reaction following H atom abstraction at the γ-, δ-, and ε-carbons are similar to this, and lead to formation of NN, NHN, NHC, NCHA and NDHF. In these reactions, however, the nitrooxyalkoxy radical can also isomerize toward the nitrate group, as shown on the right side of . This again leads to NHN, NHC, NCHA and NDHF; but also forms a hydroxyaldehyde and aldehyde, hydroxycarbonyl, and a pair of hydroxyaldehydes for the γ-, δ-, and ε- pathways, respectively. First-generation NN products that are present in the gas phase can react with OH radicals by the same H atom abstraction mechanisms described above to form NN-N, NN-HN, NN-CHA; NDHF can react by OH radical addition to the C=C bond to form a nitrooxycarbonyl ester (N-CE) or nitrooxy cyclic hydroxynitrate ether (N-CHNEt); and the N-CE can react with OH radicals by the same H atom abstraction mechanisms described above to form N-CE-CHA and N-CE-HN (Ziemann Citation2011). Selected isomers of major second- and third-generation products are shown in . Because multi-generation products can be formed through many permutations, and the reaction mechanisms by which functional groups are added are the same as those shown in , the reaction mechanisms are not shown in the figure. The predominant phase of each product: gas, particle, or gas and particle was predicted using gas-particle partitioning theory (Pankow Citation1994), SIMPOL.1-calculated vapor pressures (Pankow and Asher Citation2008), an organic aerosol mass concentration of 1500 µg m−3, a mean molecular weight of organic aerosol of 250 g mole−1, and activity coefficients of 1, and are designated in and .
Figure 2. Second- and third-generation products of the reaction of 3-decyl nitrate with OH radicals in the presence of NO. On the basis of gas-particle partitioning calculations the products are predicted to mostly partition as follows: N-CE in the gas phase (green) and NN-N, NN-HN, NN-CHA, N-CHNEt, N-CE-CHA, N-CE-HN in the particle phase (red).
TDPBMS mass spectra
The TDPBMS mass spectra of SOA averaged over the 60 min reactions of the 1- through 5-decyl nitrate isomers are shown in . Spectra are relatively simple and similar for all the isomers. Four key peaks are present for every isomer at m/z 216, 232, 260, and 277. As shown in , these peaks can be assigned to ions formed by the neutral losses of OH, H2O + NO2, HNO3 + NO2, and NO3 from molecular ions of the C10 products shown in and , with no evidence for decomposition products. We have shown previously (Algrim and Ziemann Citation2019) that these losses are characteristic of structures containing a CHA, HN, NN, and N (not associated with an HN or NN group) groups, respectively. The time profiles of these ions are shown in for the 3-decyl nitrate reaction and are consistent with the assignments. The sharp rise in the m/z 216 profile is characteristic of first-generation products (NCHA and NHN), with the slow but significant decrease beyond the maximum being due to dehydration of NCHA. The slower rise of the m/z 232 and 277 profiles is characteristic of second-generation products (NN-CHA, NN-HN, and N-CHNEt), and the long lag in the m/z 260 profile is characteristic of third-generation products (N-CE-CHA and N-CE-HN), both which are formed through reactions that include dehydration of CHA to DHF, which is much slower than the gas phase reactions (Lim and Ziemann Citation2009c).
Figure 3. (a) Average TDPBMS mass spectra of SOA formed from the reactions of the 1- through 5-decyl nitrate isomers with OH radicals in the presence of NO and (b) time profiles of key ions observed in TDPBMS mass spectra of SOA formed from the reaction of 3-decyl nitrate. In (a) signal has been normalized to that at m/z 216 and signal from seed particles has been removed, and in (b) signal has been normalized to the maximum in each profile.
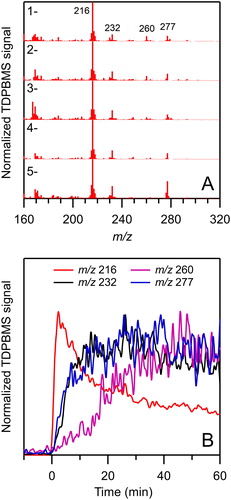
Table 1. Characteristic mass spectral ion fragments used to identify SOA products.
UV/vis and TDPBMS analysis of HPLC-fractionated NHN isomers
The NHN isomers formed from the reaction of 1-decyl nitrate were successfully fractionated using HPLC, detected by UV/vis, and then converted to an aerosol by atomization for TDPBMS analysis. The UV/vis and single ion chromatograms of SOA are shown in . Although the UV/vis chromatograms for the other isomers were similar, insufficient TDPBMS signal was obtained to perform this analysis. Nonetheless, the results discussed here should also apply to those isomers. The analysis is similar to that employed by Yeh and Ziemann (Citation2014b) for HN isomers formed from the same reaction of n-alkanes, which have similar structures but without the terminal nitrate group. The 10 peaks (3 not fully resolved) in the UV/vis chromatogram (P1–P8) can be assigned to the 10 isomer structures shown in , based on characteristic mass spectral peaks and retention times. The characteristic ions are formed by the mechanism shown in Figure S2, where ionization occurs at the hydroxyl group, followed by α-cleavage on either side of the hydroxyl group, and then loss of HNO3. In , m/z 202, 188, 174, and 160 are formed by loss of C1, C2, C3, and C4 alkyl radical fragments, and then loss of HNO3; and m/z 141, 127, 113, 99, and 85 are formed by loss of C1, C2, C3, C4, and C5 nitrooxyalkyl radical fragments, and then loss of HNO3. The retention times of the isomers are also consistent with the trends observed previously for HN (Yeh and Ziemann Citation2014b), where the retention time increases as the length of the largest alkyl chain increases because this allows for greater interaction with the C18 column. Here there are two series of isomers to consider with regards to alkyl chain length: those where the alkyl chain is attached to a CHOH group and the other where it is attached to a CHONO2 group. Within these two groups the retention times of the isomers follow the order P5 > P4a > P3 > P2, and P8 > P7 > P6 > P4b = P4c, respectively. We note the relative peak areas of all the peaks except for P1, P5, and P8 are within ∼20%, as expected based on the probability for H atom abstraction at the appropriate carbon. The much smaller peaks at P1 and P8 are due to the much-reduced probability for H atom abstraction at the terminal carbon and the β-carbon, whereas the reason for the smaller peak at P5 is not clear.
Figure 4. UV/vis and single ion TDPBMS HPLC chromatograms of NHN isomers in SOA formed from the reaction of 1-decyl nitrate with OH radicals in the presence of NO. See for the assignment of each NHN isomer.
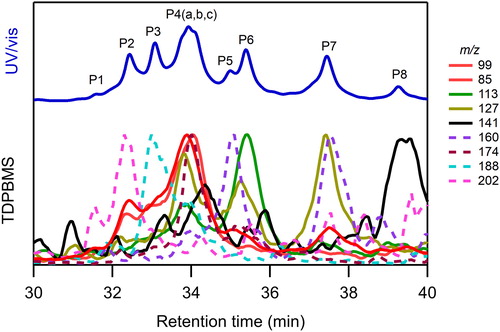
Table 2. Assignment of NHN isomer structures based on retention times and mass spectra.
SOA yields
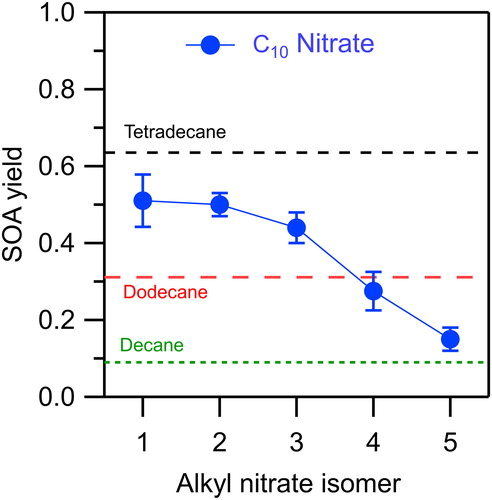
The SOA yields measured from the reactions of the 1- through 5-decyl nitrate isomers are shown , where they are compared with those measured previously for the n-alkanes decane, dodecane, and tetradecane (Algrim and Ziemann Citation2016, Citation2019). The SOA yield is highest when the nitrate group is on the 1-carbon, with a value of 0.51, and then decreases monotonically to 0.50, 0.44, 0.28, and 0.15 as it moves inward to the 5-carbon. One might expect that this trend is due to differences in the vapor pressures of the alkyl nitrates, which lead to corresponding differences in the vapor pressures of the products and therefore SOA yields. But the vapor pressures of the alkyl nitrate isomers differ only slightly: 1.2, 2.2, 2.4, 2.4, and 2.5 Pa for the 1- through 5-isomers at 25 °C, as calculated using SPARC (Hilal, Karickhoff, and Carreira Citation2003). This is much different than the n-alkanes, where the SOA yields for tetradecane and decane are 0.64 and 0.09, and their SPARC-calculated vapor pressures are 1.4 and 190 Pa. It is clear, therefore, that the differences in the SOA yields for the alkyl nitrate isomers is not due to differences in their vapor pressures.
Figure 5. SOA yields measured for reactions of alkyl nitrate isomers (this study) and n-alkanes (Algrim and Ziemann Citation2016, Citation2019) with OH radicals in the presence of NO. Error bars are standard deviations for duplicate experiments.
Kinetic modeling
The composition of SOA determined from TDPBMS mass spectra and the HPLC analysis indicate that isomerization products contribute a large portion of the SOA formed in experiments. And given that the SOA yields decrease substantially as the nitrate group moves inward from the end of the molecule, we predict that when the nitrate group is nearer to the center of the carbon chain it interferes with isomerization to a greater extent, thus forming higher volatility products and decreasing the SOA yield. As was done in past work (Algrim and Ziemann Citation2016, Citation2019), this conjecture was verified by using the mechanism shown in and kinetic models for each isomer to predict the fraction of reaction that will undergo isomerization based on our current understanding of high NOx oxidation chemistry from the literature. For each isomer, it was first determined what fraction of H atom abstraction would occur at each carbon using structure reactivity relationships (Ziemann and Atkinson Citation2012). The resulting (following addition of O2) nitrooxyperoxy radicals then react with NO, at which point a branching ratio (Yeh and Ziemann Citation2014a) was used to estimate the fractions that added a nitrate group or propagated to a nitrooxyalkoxy radical. Slower processes such as autooxidation are not considered in the model as our experiments were performed with high enough concentrations of NO to fully outcompete such processes, though this is not always the case in the atmosphere. It is the subsequent fate of the nitrooxyalkoxy radical that has the greatest effect on the overall mechanism, since it can isomerize, decompose, or react with O2. The rate constant for reaction with O2 is known and the same for all isomers (Atkinson Citation2007), and the rate constants for isomerization and decomposition can be estimated for each isomer using structure-activity relationships (Atkinson Citation2007; Vereecken and Peeters 2009, 2010; Yeh, Claflin, and Ziemann Citation2015). Calculations were thus made as detailed as possible, but only considered first-generation products since in previous work such calculations were able to capture and explain the trends in SOA yields. Also, specific products were not considered, but instead product categories such as ‘isomerization product’ and ‘decomposition product.’ This allowed the resulting products to be distributed in only six bins, simplifying interpretation. A more detailed description of the model is given in SI along with a simple schematic of the method (Figure S3) and values used for the key rate constants for nitrooxyalkoxy radical decomposition and isomerization (Table S1). The model did not include gas-particle and gas-wall partitioning and particle-phase chemistry, but it is expected that the effects of not including these processes on the predictions should be similar across isomers. The model was run using the KinSim modeling software (Peng and Jimenez Citation2019).
The results of the calculations are shown in . For comparison, the SOA molar yields are appended atop the model results. It is important to note that the purpose of our model is not to estimate SOA yields, since it does not include processes such as gas-particle and gas-wall partitioning and particle-phase chemistry. It only gives yields of first-generation products in particular categories, such as isomerization products and decomposition products. Thus, the model results are not intended to be compared quantitively to SOA molar yields, but instead provide insight into the physical-chemical basis for the trends observed in the measured SOA yields. SOA molar yields were determined from SOA mass yields by assuming an SOA molecular weight of 250 g mol−1, the approximate average for NN, NHN, and NHC. Product categories for each isomer stacked in order of increasing vapor pressure (calculated using SIMPOL.1, Pankow and Asher Citation2008) are isomerization < dinitrate < hydroxy carbonyl < nitrate carbonyl < carbonyl < decomposition. The product distribution for 1-decyl nitrate shows a majority of isomerization products, followed by ∼20% dinitrates. Very little is allocated to higher volatility products because the presence of the nitrate group at the terminal carbon leads to chemistry that closely mimics that of n-alkanes. As the nitrate group moves toward the middle of the molecule the yields of isomerization products decrease, yields of dinitrates remain approximately constant, and yields of hydroxy carbonyls and decomposition products increase, as do those of nitrate carbonyls and carbonyls, although they are always small.
Figure 6. Product distributions as determined from kinetic models for each alkyl nitrate isomer. Product categories are stacked in order of volatility with isomerization the lowest and decomposition the highest.
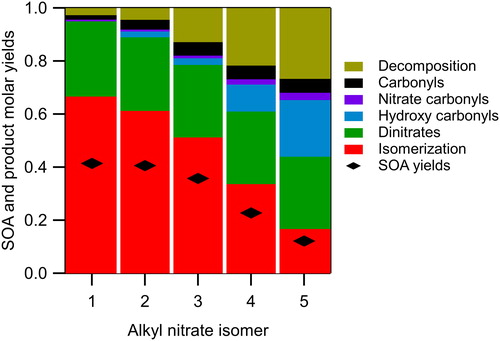
The general trends observed in product yields as the nitrate group moves toward the middle of the molecule can be explained as follows: (a) isomerization products decrease because the fraction of isomerization reactions that occur by abstraction of an H atom from an α-, β- or terminal carbon increases, and these reactions are much slower than from other sites, thus making isomerization less competitive with other nitrooxyalkoxy radical reactions; (b) hydroxy carbonyl products increase because the number of pathways by which they can form (isomerization that occurs by abstraction of an H atom from an α-carbon) increases and the number of competing pathways decreases; and (c) decomposition products increase because the number of pathways that can form β-nitrooxyalkoxy radicals increases, and thus the opportunity for decomposition increases.
Comparison of SOA yields from alkyl nitrates, ketones, alcohols, and n-alkanes
The SOA yields from the reactions of the C10 alkyl nitrates are compared in to those of C12 2-ketones, C10 1-alcohols, and C10, C12, and C14 n-alkanes determined previously (Algrim and Ziemann Citation2016, Citation2019), with all reactions performed under identical conditions. The alkyl nitrate, ketone, and alcohol isomers have similar vapor pressures. A common feature of all three series is that the SOA yields for the isomer with the functional group closest to the end of the molecule (2-dodecanone, 1-decanol, and 1-decyl nitrate) are similar to the yield of tetradecane, an n-alkane of similar vapor pressure. The SOA yields then decrease as the functional group moves toward the middle of the molecule, with the yields for 5-dodecanone (the increased yield for 6-dodecanone is due to a subtle effect of the structure, Algrim and Ziemann Citation2016), 5-decanol, and 5-decyl nitrate being similar to those of an n-alkane with approximately the same carbon number, here falling between decane and dodecane.
Figure 7. SOA yields measured for reactions of alkyl nitrate isomers (this study), and 2-ketone and alcohol isomers and n-alkanes (Algrim and Ziemann Citation2016, Citation2019) with OH radicals in the presence of NO.
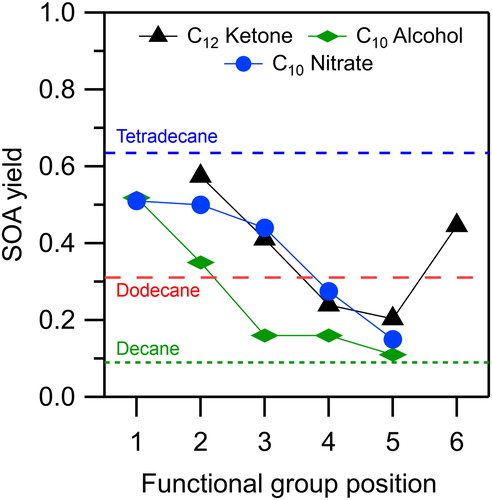
In general, when the functional group is at the end of the molecule it reduces the vapor pressure of all the products relative to that of an n-alkane with the same carbon number, thus increasing the SOA yields to values comparable to those of an n-alkane with a similar vapor pressure. But as the functional group is moved inward it alters the chemistry, increasing decomposition and other pathways that result in higher volatility products and lower SOA yields.
The rate at which the SOA yield decreases as the functional group is moved toward the middle of the molecule depends on the identity of the functional group. For ketones and alcohols, the decrease in yield occurs quickly, with a significant reduction after moving by only two carbons. By contrast, the nitrate group has minimal effect as it is moved from the 1- to the 3-carbon, but a much greater effect at the 4- and 5-carbon. These differences are attributable in large part to the different activating and deactivating effects of the functional groups on H atom abstraction from carbons near the functional group (regardless of whether it occurs by reaction with an OH radical or by alkoxy radical isomerization), and secondarily to their effects on alkoxy radical decomposition, since they all enhance decomposition. In particular, H atom abstraction at the α- and β-carbons, which tends to lead to the formation of volatile products, is activated by factors of 2.6 and 2.9 by a hydroxyl group and deactivated by factors of 0.14 and 0.28 by a nitrate group (Ziemann and Atkinson Citation2012). On the other hand, H atom abstraction is deactivated at the α-carbon by a factor of 0.75 and activated at the β-carbon by a factor of 3.9 by a keto group (Ziemann and Atkinson Citation2012). Furthermore, the keto group can significantly restrict the rate of ketoalkoxy radical isomerization (Atkinson Citation2007; Vereecken and Peeters Citation2010).
Conclusions
This work builds on previous SOA studies conducted for similar reactions with alkane (Lim and Ziemann Citation2009a), ketone (Algrim and Ziemann Citation2016), and alcohol (Algrim and Ziemann Citation2019) precursors. While the effects of hydroxyl and keto groups on SOA yields are highly relevant to growing interest in the chemistry of volatile chemical products (VCPs) (McDonald et al. Citation2018), the nitrate group most often appears on the oxidation products of VOCs. Within each class of compound, reaction products are relatively similar regardless of the position of the functional group. And although vapor pressures vary with the position of the functional group, the differences are not enough to account for the significant differences in isomer-dependent SOA yields. Overall, these results indicate that the decrease observed in measured SOA yields as the functional group is moved toward the center of the molecule is primarily due to changes in reaction branching ratios, which increase yields of higher volatility products and thus cause a smaller fraction of products to partition to the particle phase. This study further demonstrates the important role that molecular structure can play in chemical mechanisms that ultimately affect the generation of SOA. Changes in molecular structure, here as positional isomers, can have no and little effect on commonly parameterized compound properties such as O:C ratio and vapor pressure, but still have significant effects on reaction products and SOA yields. Since the observed trends in SOA yields for alkyl nitrates, alcohols, and ketones can be captured by the model-predicted isomerization fraction, which only considers one generation of reaction with the OH radical, it is likely that models that use more detailed oxidation mechanisms, such as the explicit mechanism generator GECKO-A (Aumont, Szopa, and Madronich Citation2005), when combined with gas-particle and gas-wall partitioning could predict SOA yields with reasonable accuracy (La et al. Citation2016).
Further work in the area should include similar studies on the composition and yields of SOA formed from reactions of ester, ether, and hydroperoxide positional isomers (other important functional groups present in VCPs, McDonald et al. Citation2018), and multifunctional compounds. Multifunctional compounds will pose additional experimental, mechanistic, and modeling challenges, such as difficulty in sample introduction, increased gas-wall partitioning of precursors (Yeh and Ziemann Citation2015), more complex reaction mechanisms, and increased uncertainty in the use of vapor pressure prediction methods (Hilal, Karickhoff, and Carreira Citation2003; Pankow and Asher Citation2008) and structure-reactivity relationships (Ziemann and Atkinson Citation2012), but could provide further insight into multigenerational chemistry.
Supplemental Material
Download MS Word (228.4 KB)Additional information
Funding
References
- Algrim, L. B., and P. J. Ziemann. 2016. Effect of the keto group on yields and composition of organic aerosol formed from OH radical-initiated reactions of ketones in the presence of NOx. J. Phys. Chem. A 120 (35):6978–89. doi:10.1021/acs.jpca.6b05839.
- Algrim, L. B., and P. J. Ziemann. 2019. Effect of the hydroxyl group on yields and composition of organic aerosol formed from OH radical-initiated reactions of alcohols in the presence of NOx. ACS Earth Space Chem. 3 (3):413–23. doi:10.1021/acsearthspacechem.9b00015.
- Atkinson, R. 2000. Atmospheric chemistry of VOCs and NOx. Atmos. Environ. 34 (12–14):2063–101. doi:10.1016/S1352-2310(99)00460-4.
- Atkinson, R. 2007. Rate constants for the atmospheric reactions of alkoxy radicals: An updated estimation method. Atmos. Environ. 41 (38):8468–85. doi:10.1016/j.atmosenv.2007.07.002.
- Atkinson, R., W. P. L. Carter, A. M. Winer, and J. N. Pitts, Jr. 1981. An experimental protocol for the determination of OH radical rate constants with organics using methyl nitrite photolysis as an OH radical source. J. Air Pollut. Control Assoc. 31 (10):1090–2. doi:10.1080/00022470.1981.10465331.
- Aumont, B., S. Szopa, and S. Madronich. 2005. Modelling the evolution of organic carbon during its gas-phase tropospheric oxidation: Development of an explicit model based on a self-generating approach. Atmos. Chem. Phys. 5 (9):2497–517. doi:10.5194/acp-5-2497-2005.
- Boschan, R., R. T. Merrow, and R. W. Van Dolah. 1955. The chemistry of nitrate esters. Chem. Rev. 55 (3):485–510. doi:10.1021/cr50003a001.
- Boyd, C. M., J. Sanchez, L. Xu, A. J. Eugene, T. Nah, W. Y. Tuet, M. I. Guzman, and N. L. Ng. 2015. Secondary organic aerosol formation from the β-pinene + NO3 system: Effect of humidity and peroxy radical fate. Atmos. Chem. Phys. 15 (13):7497–522. doi:10.5194/acp-15-7497-2015.
- Claflin, M. S., and P. J. Ziemann. 2018. Identification and quantitation of aerosol products of the reaction of β-pinene with NO3 radicals and implications for gas- and particle-phase reaction mechanisms. J. Phys. Chem. A 122 (14):3640–52. doi:10.1021/acs.jpca.8b00692.
- Day, D. A., S. Liu, L. M. Russell, and P. J. Ziemann. 2010. Organonitrate group concentrations in submicron particles with high nitrate and organic fractions in coastal southern California. Atmos. Environ. 44 (16):1970–9. doi:10.1016/j.atmosenv.2010.02.045.
- Dockery, D. W., C. A. Pope, X. Xu, J. D. Spengler, J. H. Ware, M. E. Fay, B. G. Ferris, and F. E. Speizer. 1993. An association between air pollution and mortality in six US cities. N. Engl. J. Med. 329 (24):1753–9. doi:10.1056/NEJM199312093292401.
- Finlayson-Pitts, B. J., and J. N. Pitts, Jr. 2000. Chemistry of the upper and lower atmosphere: Theory, experiments, and applications. San Diego, CA: Academic Press.
- Fry, J. L., D. C. Draper, K. C. Barsanti, J. N. Smith, J. Ortega, P. M. Winkler, M. J. Lawler, S. S. Brown, P. M. Edwards, R. C. Cohen, et al. 2014. Secondary organic aerosol formation and organic nitrate yield from NO3 oxidation of biogenic hydrocarbons. Environ. Sci. Technol. 48 (20):11944–53. doi:10.1021/es502204x.
- Gong, H., A. Matsunaga, and P. J. Ziemann. 2005. Products and mechanism of secondary aerosol formation from the reactions of linear alkenes with NO3 radicals. J. Phys. Chem. A 109 (19):4312–24. doi:10.1021/jp058024l.
- Hilal, S. H., S. W. Karickhoff, and L. A. Carreira. 2003. Prediction of the vapor pressure boiling point, heat of vaporization and diffusion coefficient of organic compounds. QSAR Comb. Sci. 22 (6):565–74. doi:10.1002/qsar.200330812.
- Krechmer, J. E., D. Pagonis, P. J. Ziemann, and J. L. Jimenez. 2016. Quantification of gas-wall partitioning in Teflon environmental chambers using rapid bursts of low-volatility oxidized species generated in situ. Environ. Sci. Technol. 50 (11):5757–65. doi:10.1021/acs.est.6b00606.
- Kroll, J. H., and J. H. Seinfeld. 2008. Chemistry of secondary organic aerosol: Formation and evolution of low-volatility organics in the atmosphere. Atmos. Environ. 42 (16):3593–624. doi:10.1016/j.atmosenv.2008.01.003.
- Krupnick, A. J., W. Harrington, and B. Ostro. 1990. Ambient ozone and acute health effects: Evidence from daily data. J. Environ. Econ. Manag. 18 (1):1–18. doi:10.1016/0095-0696(90)90048-4.
- La, Y. S., M. Camredon, P. J. Ziemann, R. Valorso, A. Matsunaga, V. Lannuque, J. Lee-Taylor, A. Hodzic, S. Madronich, and B. Aumont. 2016. Impact of chamber wall loss of gaseous organic compounds on secondary organic aerosol formation: Explicit modeling of SOA formation from alkane and alkene oxidation. Atmos. Chem. Phys. 16 (3):1417–31. doi:10.5194/acp-16-1417-2016.
- Lim, Y. B., and P. J. Ziemann. 2005. Products and mechanism of secondary organic aerosol formation from reactions of n-alkanes with OH radicals in the presence of NOx. Environ. Sci. Technol. 39 (23):9229–9236. doi:10.1021/es051447g.
- Lim, Y. B., and P. J. Ziemann. 2009a. Effects of molecular structure on aerosol yields from OH radical-initiated reactions of linear, branched, and cyclic alkanes in the presence of NOx. Environ. Sci. Technol. 43 (7):2328–34. doi:10.1021/es803389s.
- Lim, Y. B., and P. J. Ziemann. 2009b. Chemistry of secondary organic aerosol formation from OH radical-initiated reactions of linear, branched, and cyclic alkanes in the presence of NOx. Aerosol Sci. Technol. 43 (6):604–19. doi:10.1080/02786820902802567.
- Lim, Y. B., and P. J. Ziemann. 2009c. Kinetics of the heterogeneous conversion of 1,4-hydroxycarbonyls to cyclic hemiacetals and dihydrofurans on organic aerosol particles. Phys. Chem. Chem. Phys. 11 (36):8029–39. doi:10.1039/b904333k.
- Matsunaga, A., K. S. Docherty, Y. Lim, and P. J. Ziemann. 2009. Composition and yields of secondary aerosol formed from OH radical-initiated reactions of linear alkenes in the presence of NOx: Modeling and measurements. Atmos. Environ. 43 (6):1349–57. doi:10.1016/j.atmosenv.2008.12.004.
- Matsunaga, A., and P. J. Ziemann. 2009. Yields of β-hydroxynitrates and dihydroxynitrates in aerosol formed from OH radical-initiated reactions of linear alkenes in the presence of NOx. J. Phys. Chem. A 113 (3):599–606. doi:10.1021/jp807764d.
- Matsunaga, A., and P. J. Ziemann. 2010. Gas-wall partitioning of organic compounds in a Teflon film chamber and potential effects on reaction product and aerosol yield measurements. Aerosol Sci. Technol. 44 (10):881–92. doi:10.1080/02786826.2010.501044.
- McDonald, B. C., J. A. de Gouw, J. B. Gilman, S. H. Jathar, A. Akherati, C. D. Cappa, J. L. Jimenez, J. Lee-Taylor, P. L. Hayes, S. A. McKeen, et al. 2018. Volatile chemical products emerging as largest petrochemical source of urban organic emissions. Science 359 (6377):760–4. doi:10.1126/science.aaq0524.
- Murphy, J., M. Delucchi, D. McCubbin, and H. Kim. 1999. The cost of crop damage caused by ozone air pollution from motor vehicles. J. Environ. Manag. 55 (4):273–89. doi:10.1006/jema.1999.0256.
- Ng, N. L., S. S. Brown, A. T. Archibald, E. Atlas, R. C. Cohen, J. N. Crowley, D. A. Day, N. M. Donahue, J. L. Fry, H. Fuchs, et al. 2017. Nitrate radicals and biogenic volatile organic compounds mechamisms and organic aerosol. Atmos. Chem. Phys. 17 (3):2103–62. doi:10.5194/acp-17-2103-2017.
- Ng, N. L., A. J. Kwan, J. D. Surratt, A. W. H. Chan, P. S. Chhabra, A. Sorooshian, H. O. T. Pye, J. D. Crounse, P. O. Wennberg, R. C. Flagan, et al. 2008. Secondary organic aerosol (SOA) formation from reaction of isoprene with nitrate radicals (NO3). Atmos. Chem. Phys. 8 (14):4117–40. doi:10.5194/acp-8-4117-2008.
- Odum, J. R., T. Hoffmann, F. Bowman, D. Collins, R. C. Flagan, and J. H. Seinfeld. 1996. Gas/particle partitioning and secondary organic aerosol yields. Environ. Sci. Technol. 30 (8):2580–5. doi:10.1021/es950943+.
- Pankow, J. F. 1994. An absorption model of the gas/aerosol partitioning of organic compounds in the atmosphere. Atmos. Environ. 28 (2):185–8. doi:10.1016/1352-2310(94)90093-0.
- Pankow, J. F., and W. E. Asher. 2008. SIMPOL.1: A simple group contribution method for predicting vapor pressures and enthalpies of vaporization of multifunctional organic compounds. Atmos. Chem. Phys. 8 (10):2773–96. doi:10.5194/acp-8-2773-2008.
- Peng, Z., and J. L. Jimenez. 2019. KinSim: A research-grade user-friendly visualized kinetic simulator for chemical kinetics and environmental chemistry teaching. J. Chem. Educ. 96 (4):806–11. doi:10.1021/acs.jchemed.9b00033.
- Perring, A. E., S. E. Pusede, and R. C. Cohen. 2013. An observational perspective on the atmospheric impacts of alkyl and multifunctional nitrates on ozone and secondary organic aerosol. Chem. Rev. 113 (8):5848–70. doi:10.1021/cr300520x.
- Pöschl, U. 2005. Atmospheric aerosols: Composition, transformation, climate and health effects. Angew. Chem. Int. Ed. 44 (46):7520–40. doi:10.1002/anie.200501122.
- Pye, H. O. T., D. J. Luecken, C. M. Boyd, N. L. Ng, K. R. Baker, B. R. Ayres, J. O. Bash, K. Baumann, W. P. L. Carter, E. Edgerton, et al. 2015. Modeling the current and future roles of particulate organic nitrates in the southeastern United States. Environ. Sci. Technol. 49 (24):14195–203. doi:10.1021/acs.est.5b03738.
- Singh, H. B. 1987. Reactive nitrogen in the troposphere. Environ. Sci. Technol. 21 (4):320–7. doi:10.1021/es00158a001.
- Taylor, W. D., T. D. Allston, M. J. Moscato, G. B. Fazekas, R. Kozlowski, and G. A. Takacs. 1980. Atmospheric photodissociation lifetimes for nitromethane, methyl nitrite, and methyl nitrate. Int. J. Chem. Kinet. 12 (4):231–40. doi:10.1002/kin.550120404.
- Tobias, H. J., D. E. Beving, P. J. Ziemann, H. Sakurai, M. Zuk, P. H. McMurry, D. Zarling, R. Waytulonis, and D. B. Kittelson. 2001. Chemical analysis of diesel engine nanoparticles using a nano-DMA/thermal desorption particle beam mass spectrometer. Environ. Sci. Technol. 35 (11):2233–43. doi:10.1021/es0016654.
- Tobias, H. J., P. M. Kooiman, K. S. Docherty, and P. J. Ziemann. 2000. Real-time chemical analysis of organic aerosols using a thermal desorption particle beam mass spectrometer. Aerosol Sci. Technol. 33 (1–2):170–90. doi:10.1080/027868200410912.
- Vereecken, L., and J. Peeters. 2009. Decomposition of substituted alkoxy radicals-part I: A generalized structure-activity relationship for reaction barrier heights. Phys. Chem. Chem. Phys. 11 (40):9062–74. doi:10.1039/b909712k.
- Vereecken, L., and J. Peeters. 2010. A structure-activity relationship for the rate coefficient of H-migration in substituted alkoxy radicals. Phys. Chem. Chem. Phys. 12 (39):12608–20. doi:10.1039/c0cp00387e.
- Wang, N., S. D. Jorga, J. R. Pierce, N. M. Donahue, and S. N. Pandis. 2018. Particle wall-loss correction methods in smog chamber experiments. Atmos. Meas. Tech. 11 (12):6577–88. doi:10.5194/amt-11-6577-2018.
- Wiedensohler, A., W. Birmili, A. Nowak, A. Sonntag, K. Weinhold, M. Merkel, B. Wehner, T. Tuch, S. Pfeifer, M. Fiebig, et al. 2012. Mobility particle size spectrometers: Harmonization of technical standards and data structure to facilitate high quality long-term observations of atmospheric particle number size distributions. Atmos. Meas. Tech. 5 (3):657–85. doi:10.5194/amt-5-657-2012.
- Wiedensohler, A., A. Wiesner, K. Weinhold, W. Birmili, M. Hermann, M. Merkel, T. Müller, S. Pfeifer, A. Schmidt, T. Tuch, et al. 2018. Mobility particle size spectrometers: Calibration procedures and measurement uncertainties. Aerosol Sci. Technol. 52 (2):146–64. doi:10.1080/02786826.2017.1387229.
- Xu, L., S. Suresh, H. Guo, R. J. Weber, and N. L. Ng. 2015. Aerosol characterization over the Southeastern United States using high resolution aerosol mass spectrometry: Spatial and seasonal variation of aerosol composition and sources with a focus on organic nitrates. Atmos. Chem. Phys. 15 (13):7307–36. doi:10.5194/acp-15-7307-2015.
- Yeh, G. K., M. S. Claflin, and P. J. Ziemann. 2015. Products and mechanism of the reaction of 1-pentadecene with NO3 radicals and the effect of a -ONO2 group on alkoxy radical decomposition. J. Phys. Chem. A 119 (43):10684–96. doi:10.1021/acs.jpca.5b07468.
- Yeh, G. K., and P. J. Ziemann. 2014a. Alkyl nitrate formation from the reactions of C8−C14 n-alkanes with OH radicals in the presence of NOx. J. Phys. Chem. A 118 (37):8147–57. doi:10.1021/jp500631v.
- Yeh, G. K., and P. J. Ziemann. 2014b. Identification and product yields of 1,4-hydroxynitrates in particles formed from the reactions of C8−C16 n-alkanes with OH radicals in the presence of NOx. J. Phys. Chem. A 118 (38):8797–806. doi:10.1021/jp505870d.
- Yeh, G. K., and P. J. Ziemann. 2015. Gas-wall partitioning of oxygenated organic compounds: Measurements, structure–activity relationships, and correlation with gas chromatographic retention factor. Aerosol Sci. Technol. 49:726–37.
- Zhang, Q., J. L. Jimenez, M. R. Canagaratna, J. D. Allan, H. Coe, I. M. Ulbrich, M. R. Alfarra, A. Takami, A. M. Middlebrook, Y. L. Sun, et al. 2007. Ubiquity and dominance of oxygenated species in organic aerosols in anthropogenically-influenced Northern Hemisphere Midlatitudes. Geophys. Res. Lett. 34 (13), L13801. doi:10.1029/2007GL029979.
- Zhang, X., C. D. Cappa, S. H. Jathar, R. C. McVay, J. J. Ensberg, M. J. Kleeman, and J. H. Seinfeld. 2014. Influence of vapor wall loss in laboratory chambers on yields of secondary organic aerosol. Proc. Natl. Acad. Sci. U. S. A. 111 (16):5802–7. doi:10.1073/pnas.1404727111.
- Ziemann, P. J. 2011. Effects of molecular structure on the chemistry of aerosol formation from the OH-radical-initiated oxidation of alkanes and alkenes. Int. Rev. Phys. Chem. 30 (2):161–95. doi:10.1080/0144235X.2010.550728.
- Ziemann, P. J., and R. Atkinson. 2012. Kinetics, products, and mechanisms of secondary organic aerosol formation. Chem. Soc. Rev. 41 (19):6582–605. doi:10.1039/c2cs35122f.