
 ?Mathematical formulae have been encoded as MathML and are displayed in this HTML version using MathJax in order to improve their display. Uncheck the box to turn MathJax off. This feature requires Javascript. Click on a formula to zoom.
Abstract
A dynamic, single-path model is developed for dry powder transport in the lungs. The model differentiates between particle behavior in the respiratory bronchioles and alveolar ducts on one hand and inside the alveoli on the other. In particular, it considers the alveolar volume of each generation as a mixing chamber. Air inflow to the alveoli is calculated by accounting for the deformation of airways during breathing. Particle dispersion along the respiratory tract is taken into account and mechanistic deposition rates are developed for the alveoli. Deposition by Brownian diffusion is modeled by a concentration boundary layer, whose thickness varies inversely with the intensity of mixing. The plausibility of the assumption of alveolar mixing is tested indirectly by comparison of model predictions with benchmark data of the exhaled concentration profile and of the pulmonary deposition of continuously inhaled aerosols. The observed agreement lends support to the hypothesis that alveolar mixing represents fundamental physics of the breathing process. It also supports the suggestion that alveolar mixing provides an additional axial dispersion mechanism in the acinus, which is independent of particle size and is active at zero gravity.
Copyright © 2020 American Association for Aerosol Research
EDITOR:
1. Introduction
Prediction of the characteristics of particle transport and of the spatio-temporal variation of deposition in the respiratory tract has been a central research goal of the past decades, motivated by efforts to assess the consequences of air-born pollutants and to optimize the location of inhaled drug delivery (Heyder Citation2004; Kleinstreuer and Zhang Citation2010; Longest and Holbrook Citation2012).
Key parameters that affect aerosol transport and deposition are related to the particle itself (size, density, shape, charge, hygroscopicity), the breathing pattern (inhaled volume, flow rate and its time-variation during inhalation and exhalation) and the geometrical and dynamical characteristics of the respiratory tract, i.e., airway diameters and lengths at functional residual capacity, as well as their temporal variation, and size and distribution of alveoli.
Particle deposition along conducting airways has been typically modeled in the idealized tubular geometry and reliable correlations are available (Finlay Citation2001). Alternatively, three-dimensional simulations–based on the actual shape of upper airways as recorded by tomography and/or acinar models derived from morphometrical measurements–are increasingly becoming available (Khajeh-Hosseini-Dalasm and Longest Citation2015; Kolanjiyil and Kleinstreuer Citation2016; Hofemeier et al. Citation2018). However, because the computational load is excessive, such approaches usually concentrate on one region of the lung, or provide global predictions in combination with a model of the rest of the lung that is not simulated in detail.
Deposition in the pulmonary region, i.e., along the walls of the respiratory bronchioles and inside the alveoli, appears to be understood less satisfactorily and many open questions remain. Preliminary efforts to deal with alveolar volumes as extensions of the airways of the respective generation (Egan and Nixon Citation1985; Darquenne and Paiva Citation1994) were met with some success. A major improvement in the modeling strategy was the consideration by Choi and Kim (Citation2007) of a transport scheme that differentiates between airway and alveolar volumes and includes interchange of particles between the two.
More than two decades ago, it was first proposed that the flow inside an alveolus may result in chaotic mixing despite the very small velocities involved (Tsuda, Henry, and Butler Citation1995; Henry, Butler, and Tsuda Citation2002). Chaotic mixing was argued to be the outcome of the interaction of axial flow due to expansion/contraction with recirculation due to shear imposed by the airway flow. This idea was subsequently investigated by three-dimensional simulations and experiments (Tsuda et al. Citation2002, Tsuda, Henry, and Butler Citation2008, Tsuda, Laine-Pearson, and Hydon Citation2011; Sznitman et al. Citation2009; Henry et al. Citation2012), and was more recently enriched by a complementary mixing mechanism (Darquenne and Prisk Citation2003; Sznitman et al. Citation2009; Ma and Darquenne Citation2012; Fishler et al. Citation2017) based on streamline crossing by the particles in the presence of high velocity gradients. The idea of chaotic mixing was exploited in a simple filtration model that assumed pure convection along airways in combination with perfect mixing inside the alveolar volume of each generation (Georgakakou et al. Citation2016), and which–despite its simplicity–produced reasonable results (Gourgoulianis et al. Citation2017). It is noted that that such flow-based mixing is predominantly confined to the proximal generations of the acinus (e.g., Fishler, Mulligan, and Sznitman Citation2013).
The present work focuses on the pulmonary region and interrogates the dominant patterns of mixing and their effect on particle retention and deposition. An Eulerian, single-path deposition model (Taulbee and Yu Citation1975; Egan et al. Citation1989; Darquenne and Paiva Citation1994; Choi and Kim Citation2007) is used, which assumes symmetrically dichotomous airways. This class of models can handle time-varying deposition during realistic breathing cycles, in contrast to filtration–or Lagrangian–models (Kim et al. Citation1983; Martonen Citation1993), which apply only to steady flow conditions.
A key aspect of the present dynamic model of particle transport and deposition lies in the differentiation between the dynamics of bronchiolar airways and alveolar ducts on the one hand and alveolar volumes on the other. Indeed, the possibility that particle concentrations in respiratory airways and in alveoli follow fundamentally different dynamics has not attracted much attention in the literature, apart from the work of Choi and Kim (Citation2007).
Flow in the ducts is described by one-dimensional convection with superimposed axial dispersion (Darquenne and Paiva Citation1994), whereas the alveolar volumes of each generation are cumulatively considered as an efficient mixing chamber (Georgakakou et al. Citation2016). The results indicate the consequences of the assumption of perfect alveolar mixing and–through comparison with benchmark data–serve as an indirect test of the plausibility of this assumption.
Predictions by the model are compared to two categories of independent data: (i) Exhaled concentration profiles of a continuously inhaled aerosol (Choi and Kim Citation2007). Exhalation data, and in particular the long-time tail, represent a sensitive indicator of the retention pattern and release rate of particles from the acinus. (ii) Pulmonary deposition of a continuously inhaled aerosol, as estimated (after appropriate correction, ICRP Citation1994) by the slow-cleared fraction (Heyder et al. Citation1986). These data span a wide range of particle sizes and breathing patterns and thus represent a stringent test of any deposition model.
It is demonstrated that predictions are in satisfactory agreement with all the above data. Based on this favorable comparison, it is argued that the differentiation between the dynamics of open-ended ducts (conducting/respiratory bronchioles, alveolar ducts) and closed volumes (alveoli), and in particular the hypothesis of good mixing in the latter, may represent fundamental physics of the breathing process.
2. Methods
2.1. Modeling of time-varying lung geometry and air flow
The respiratory tract is modeled as a symmetrically bifurcating network of the trachea and N = 23 generations of flexible cylindrical airways, with the diameter, and length,
of each generation
at functional residual capacity, given by one of the standard available models (Finlay Citation2001). The same model provides reference values of
and the total alveolar volume per generation,
All alveoli are assumed to have the same size and expand/contract at the same rate. The fraction of the airway wall covered by alveoli,
is an increasing function of generation number, starting from the first alveolated generation.
In order to take into account the variation of airway diameter during breathing, we resort to a generally accepted model of airway elasticity (Lambert et al. Citation1982) and use it in combination with the compliance properties of the lung. More specifically, the airway diameter is expressed as a function of intramural pressure, ΔP, by the following two hyperbolae, matched at
(1)
(1)
(2)
(2)
Here, is the maximum airway diameter of generation i (i.e., at the end of full inspiration) and
are the elasticity parameters of each generation (Lambert et al. Citation1982). Note that the original data have been presently extrapolated by using the parameters of generation 16 also for the airway generations 17–23.
The intramural pressure at time t is related to the instantaneous lung volume, according to the following standard expression of lung elasticity (Pollak Citation1998)
(3)
(3)
where
is the lung compliance at
and
are defined in terms of TLC and RV (
) so that EquationEquation (3)
(3)
(3) does not produce singularities in the breathing range. Here, quasi-equilibrium is assumed and also pressure drop along the airways is neglected, i.e.,
is defined by taking the intramural pressure equal to the alveolar recoil pressure according to EquationEquation (3)
(3)
(3) . The maximum airway diameters,
are calculated from the values at FRC of the model used, by substituting
in EquationEquation (3)
(3)
(3) and then using the value of
in EquationEquation (2)
(2)
(2) , together with
The present model admits arbitrary, generally time-varying, inhalation and exhalation flow rates, for
and
for
which are defined at the mouth. Thus, the instantaneous lung volume, needed for EquationEquation (3)
(3)
(3) , is calculated by simple mass balances of entering and leaving air. For example, in a breathing cycle starting from
the lung volume during inhalation and exhalation is given by the following EquationEquations (4)
(4)
(4) and Equation(5)
(5)
(5) , respectively:
(4)
(4)
(5)
(5)
Next, the time-varying characteristics of the alveolar volumes are considered. Inhalation is used as an example, but the exact same reasoning and equations apply for exhalation. Air flow during inhalation is driven by the expansion of both the airways and the alveoli. By combining EquationEquations (1)–(5), we obtain the instantaneous values of airway diameters at every time instant. Thus, we may calculate the part of air flow rate, that is accommodated at each generation because of the diameter expansion
(6)
(6)
The difference between the inflow rate at the mouth and the sum of the contributions of all the airway expansion rates constitutes the total expansion rate of all the alveolar volumes. Thus, the air flow rate that enters the alveolar volume of generation is calculated as:
(7)
(7)
The first parenthesis in EquationEquation (7)(7)
(7) expresses the assumption that all alveoli expand at the same rate.
Based on the above, the remaining flow and anatomic parameters may be calculated. In particular, the air flow rate entering the airways of generation is:
(8)
(8)
and its variation along the airway is taken linear in the distance, x, from the entrance
(9)
(9)
Also, the instantaneous diameter, of the alveoli (taken as spherical cavities) may be calculated by dividing the total alveolar volume by the total number of alveoli. The instantaneous alveolar volume of generation
is given by the expression
(10)
(10)
2.2. Modeling of spatio-temporal variation of particle concentration
The concentration, of particles along the airways is described by a one-dimensional differential mass balance that includes convection and axial dispersion, as well as source and sink terms that correspond to mass exchange with the alveoli and to deposition. The concentration of particles inside the alveoli of each generation,
is taken as spatially uniform, and thus the respective mass balances depend only on time. More specifically, the following equations are formulated for generation
during inhalation:
(11a)
(11a)
(11b)
(11b)
The respective mass balances during exhalation are:
(12a)
(12a)
(12b)
(12b)
Note that is the total airway flow cross section and
the total alveolar volume of generation
Also,
is the fraction of airway wall that has been replaced by alveolar openings and
is the fraction of the area of the spherical alveolus that is missing because of the same opening. Term
is the deposition rate per unit length of the cylindrical airways of generation
and
the deposition rate in the spherical alveolar volumes of generation
The terms on the rhs of EquationEquations (11a)(11a)
(11a) and Equation(12a)
(12a)
(12a) express respectively the contribution of axial convection, axial dispersion, radial convection to/from the alveolar volume, deposition along the airway and deposition on the alveolar walls. The terms on the rhs of EquationEquations (11b)
(11b)
(11b) and Equation(12b)
(12b)
(12b) express respectively convective exchange between airway and alveoli, and interchange caused by deposition inside the airway and inside the alveoli.
Though the exact calculation of deposition terms will be described in the following section, it is important to observe here that these terms have non-trivial contributions to the mass balances. Of the total deposition rate, per unit length of a cylindrical airway, only
actually arrives on the wall, while
enters the alveolar volume through the openings. Similarly, out of the total deposition rate
inside spherical cavities, only
actually arrives at the alveolar walls, while
returns to the airway through the openings. A schematic representation of the various particle fluxes is given in .
Figure 1. Schematic of the various particle fluxes between airways and alveoli.
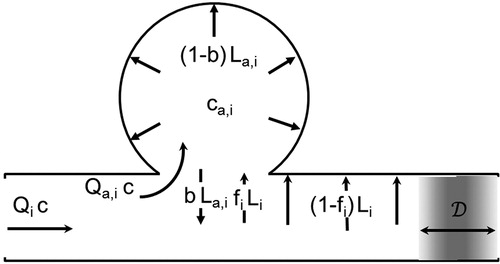
The above analysis may be summarized by stating that particles move between the airways and the alveolar volumes of each generation by two mechanisms whose contribution is additive, (a) by convection with the air flow entering or leaving the alveoli and (b) by gravitational settling and/or Brownian diffusion on the fraction of the airway wall that is absent due to the alveolar openings. This summation is equivalent to the classical formulation of mass flux of a chemical species in a mixture as the sum of a convective and a molecular component.
According to the present model, dispersion along the respiratory tract is accounted for by an explicit and an implicit contribution. The former is dominant in the conducting airways and gradually diminishes distally. The latter is a direct consequence of alveolar mixing and thus is active only in the acinus. This line of thought is in accord with the results of recent stochastic modeling of particle transport in the lung (Hofmann, Pawlak, and Sturm Citation2008), which showed that axial diffusion in conducting airways and mixing in alveoli constitute the dominant contributions to dispersion.
The explicit contribution is the effective diffusivity, in EquationEquations (11a)
(11a)
(11a) and Equation(12a)
(12a)
(12a) , which is taken to be the combined effect of Brownian diffusion and convective mixing. Following Choi and Kim (Citation2007), we write
(13)
(13)
The first term on the rhs of EquationEquation (13)(13)
(13) is the classical expression for particles of diameter
in a fluid of absolute temperature
and viscosity
including the Cunninghum correction factor,
The second term is derived from the popular expression (Taulbee and Yu Citation1975; Ultman and Thomas Citation1979)
where the mean velocity is calculated from the instantaneous values of flow rate and airway cross-section and the length is substituted by the diameter using the approximate rule
The above slight modification, which is reminiscent of a formula proposed by Scherer et al. (Citation1975) was chosen in order to take consistently into account the temporal variation of diameter and flow rate. However, it turns out that it gives indistinguishable results from the original form.
Current understanding of dispersion in the lungs focuses on the role of bifurcations (Sarangapani and Wexler Citation1999) and on the local variability of particle paths caused by the coupling of cross-stream velocity differences and gravitational settling (Darquenne and Prisk Citation2003). The expression for convective mixing in EquationEquation (13)(13)
(13) is presently applied as an empirical correlation, which accounts only for these effects. The gravity mechanism predicts that dispersion should vary with particle size, and indeed such an effect has been observed (Darquenne and Prisk Citation2003). However, experiments at zero-gravity (Darquenne, West, and Prisk Citation1998, Citation1999) indicate that significant dispersion remains, which is independent of particle properties.
It is presently argued that the assumption of alveolar mixing provides an additional, implicit dispersion mechanism, which is active in the acinus and could potentially explain the above zero-gravity dispersion. This mechanism is demonstrated by the toy-example of . (The figure is purely schematic and aims at differentiating between conduits with an inlet and an outlet–such as bronchiolar airways and alveolar ducts–on the one hand and volumes with a single opening–such as alveoli–on the other.)
Figure 2. Sketch of particle transport into and out of alveoli during (a) inhalation and (b) exhalation of a bolus.
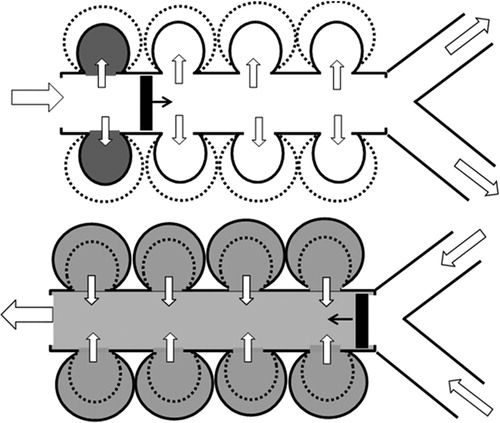
In order to single-out the contribution of alveolar mixing to axial dispersion, we consider a bolus of particles with radially uniform concentration, which travels along the duct with negligible axial dispersion. During inhalation (), the bolus moves forward and consecutively introduces particles into the expanding alveoli. The bolus reaches a certain penetration depth by the end of inhalation and starts moving back during exhalation (). Now all alveoli start to contract simultaneously and–as a result of mixing–release particles both before and after the passage of the returning bolus. Thus, despite the neglect of axial dispersion in the duct, the exhaled concentration profile is smoothed out by the pattern of particle release from the alveolar volumes. Only if the inflow and outflow of air masses in the alveoli is perfectly ordered and fully reversible, do the inhaled particles exit with the exact timing to reconstruct the original bolus.
2.3. Modeling of airway and alveolar deposition
Deposition probabilities along the airways are calculated by appropriate correlations, which provide the contributions of inertial impaction (Cai and Yu Citation1988), gravitational settling
(Heyder and Gebhart Citation1977) and Brownian diffusion
(Ingham Citation1975). The total probability of deposition,
in an airway of generation
is given by
(14)
(14)
However, the dimensionless numbers that appear in the above correlations are presently calculated at each time step, using the instantaneous values of air flow rate (spatial mean along the airway) and airway diameter. This procedure implies a quasi-steady assumption, i.e., parameters are changing with time slowly enough for the expressions, rigorously valid for steady conditions, to be applicable. Combining the above, the deposition rate per unit length of airway that appears in Equations (Equation11(11a)
(11a) ) and (Equation12
(12a)
(12a) ) is given by
(15)
(15)
where
is the local value of concentration and
is the local flow rate of particles through the cross-section at
Extrathorasic deposition is not presently modeled, instead the value of the deposited fraction is enforced exactly equal to the measurements by Heyder et al. (Citation1986). This choice avoids any bias to the predicted pulmonary deposition resulting from the modeling of extrathoracic deposition. The latter is known to be highly uncertain due to intersubject (and even intrasubject) variability (Grgic et al. Citation2004).
Alveolar deposition is modeled taking into account the instantaneous volumes of the alveolar cavities. For a settling velocity the particles that deposit by gravity in a spherical alveolus of diameter
during a differential time interval
are contained in the volume
Thus the deposition rate by gravity inside the alveoli for the entire generation
is,
(16)
(16)
where
is the number of alveoli in generation
Diffusional deposition is modeled as governed by a boundary layer of thickness close to the wall, across which particle concentration falls from the uniform value
in the bulk of the alveolar volume down to zero (Georgakakou et al. Citation2016). Therefore, the deposition rate by Brownian diffusion inside the alveoli for the entire generation
is,
(17)
(17)
where
is the dimensionless boundary layer thickness normalized with the alveolar diameter
(18)
(18)
In the frame of the alveolar mixing assumption, the thickness is determined by the competition between stirring, which tends to unify particle concentration, and diffusional deposition, which tends to deplete of particles the region close to the wall. Thus, the stronger the mixing, the smaller the value of
In this sense, parameter
may be physically understood as an indicator of the intensity of alveolar mixing.
In Georgakakou et al. (Citation2016), was chosen in order to fit the benchmark deposition data of Heyder et al. (Citation1986) at the small particle-diameter end. However, there is no a priori reason to assign the same value of Δ for all alveolar generations, and actually the discussion in Section 4.2 argues in favor of an improved choice. Thus in the following we assign as
the value of
for generation i.
Combining EquationEquations (16)(16)
(16) and Equation(17)
(17)
(17) , the deposition rate inside the alveolar volume of generation
which appears in the mass balance EquationEquations (11
(11a)
(11a) ) and (Equation12)
(12a)
(12a) is given by
(19)
(19)
A fundamental advantage of EquationEquation (19)(19)
(19) is that it provides the instantaneous deposition rate and is thus appropriate for a differential mass balance like Equations (Equation11
(11a)
(11a) ) and (Equation12
(12a)
(12a) ).
2.4. Method of solution
The system of EquationEquations (11a,b)(11a)
(11a) and Equation(12a,b)
(12a)
(12a) is augmented by the initial condition that sets all concentrations equal to zero,
and by boundary conditions at the two ends,
and
of the respiratory tract. More specifically, during inhalation and for continuous particle breathing
(20)
(20)
During exhalation, the conditions imposed at the two ends are
(21)
(21)
The above boundary conditions are standard for this problem (Darquenne and Paiva Citation1994).
The system of EquationEquations (11a(11a)
(11a) ,b) and Equation(12a
(12a)
(12a) ,b) and boundary conditions EquationEquations (20)
(20)
(20) and Equation(21)
(21)
(21) is solved numerically by a finite-volume scheme, using fully implicit time discretization, upwinding for the convection terms and central differences for the diffusion terms (Patankar Citation1980). Each airway is discretized by N = 10 grid points and inhalation/exhalation is divided into M = 1000 time steps each. This is the choice in Choi and Kim (Citation2007) and our tests also confirm that the results do not change with further grid and time step refinement.
It is noted that the finite-volume method that is applied for the airways conserves mass by definition, a property which is very useful in the present application. However, it is vital that EquationEquations (11b)(11b)
(11b) and Equation(12b)
(12b)
(12b) are also integrated fully implicitly in time, and that the source/sink terms that appear in the two equation sets–and represent exchange of particles between airways and alveoli–are computed consistently, so that mass is also conserved between different lung volumes.
3. Results
The following parameter values are used in the computations. Airway dimensions at are taken according to the model of Finlay (Citation2001), which considers the 15th generation as the first of respiratory bronchioles. Following Pollak (Citation1998), the values used in EquationEquation (3)
(3)
(3) are
The fractional coverage of airway walls by alveolar openings is taken
(Tsuda, Henry, and Butler Citation2008). Each alveolar opening is taken to subtract 20% of the spherical alveolar wall (Weibel Citation1963), thus
in EquationEquations (11a)
(11a)
(11a) and Equation(12a)
(12a)
(12a) . Finally, the variation of parameter Δ per generation is taken as:
The physical relevance of the
values and the sensitivity of the predictions to their parametric variation will be considered in Discussion.
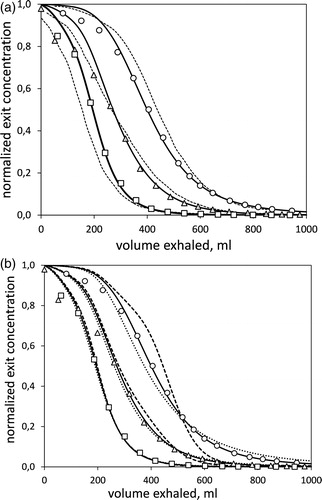
The first set of results are predictions of particle concentration in exhaled air, which are compared to literature data. Choi and Kim (Citation2007) measured the temporal variation of particle concentration in the mouth during expiration. In the experiment, air was inhaled from up to a tidal volume of
with constant flow rate
Then, it was exhaled at the same flow rate and down to the reserve volume (RV). The inhaled air was an aerosol containing particles with diameters
or
is a reproduction of the above data (points) for all three particle sizes, plotted as mouth concentration versus expired air volume. Dotted lines are predictions according to the model of Choi and Kim (Citation2007) and continuous lines are predictions based on the present work. The role of convective mixing in the present predictions is interrogated in by repeating the computation with incorrect values of
Continuous lines are the correct results, whereas dashed lines correspond to
and dotted lines to
Figure 3. Measurements and predictions of particle concentration at the mouth during exhalation. Points are data from Choi and Kim (Citation2007) for 1 μm (○), 3 μm (△) and 5 μm (□) particles. (a) Dashed lines are predictions by a model of the above authors and continuous lines are predictions by the present model. The improvement of the present prediction amounts to 70-80% reduction in the mean relative error with data. (b) The measurements are compared with modified predictions of the present model. Dashed lines correspond to the neglect of axial dispersion and dotted lines to doubling its normal value.
The second set of results are predictions of deposition, which are compared to literature data. Heyder et al. (Citation1986) measured the slow-cleared and fast-cleared fraction of monodisperse, unit-density spheres with diameters in the range They used three different breathing patterns that may schematically be classified as shallow:
intermediate:
and deep:
Their data may be converted to pulmonary (P) and tracheo-bronchial (TB) deposition following a recommendation by ICRP (Citation1994) that TB deposition also has a slow-cleared fraction,
which is estimated as
for
and
for
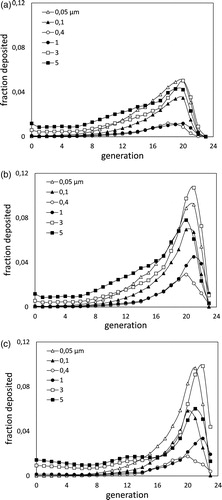
Predictions of deposition per generation for representative particle sizes are shown in , corresponding respectively to the shallow, intermediate and deep breathing pattern. However, these predictions cannot be directly compared with the aforementioned measurements, as the latter offer only cummulative results.
Figure 4. Predictions of the deposited fraction per generation for various particle sizes, and for the (a) shallow, (b) intermediate, and (c) deep breathing pattern.
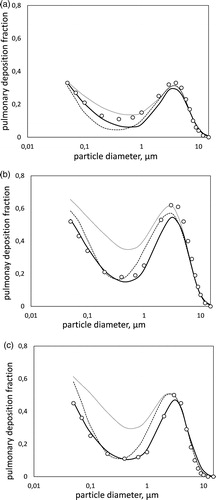
Thus, predictions are summed up to give the slow-cleared fraction, i.e., the pulmonary and the appropriate part of the tracheo-bronchial deposition, and are compared to data in (corresponding again to the shallow, intermediate and deep breathing pattern). Circles are the measurements by Heyder et al. (Citation1986) and continuous lines the results of the present model. The other lines are predictions by the simple filtration model of Georgakakou et al. (Citation2016). Dashed lines are the original results in their article, which were based on a uniform value of parameter Dotted lines are the updated predictions of that model, using the present values of parameter
Figure 5. Pulmonary deposition during (a) shallow, (b) intermediate, and (c) deep breathing pattern. Measurements by Heyder et al. (Citation1986) (points) are compared to predictions by the present model (bold lines), by the original model of Georgakakou et al. (Citation2016) (dashed lines) and by the model of Georgakakou et al. (Citation2016) using the presently selected values of (dotted lines). The present prediction reduces the mean error by 42% in (a), 65% in (b), and 87% in (c) compared to the original model of Georgakakou et al. Use of the latter with the present
leads to large overprediction.
4. Discussion
4.1. Trends in particle trapping and deposition
Attention is first drawn to the predictions of particle concentration in exhaled air. It is evident from that, beyond the first of expiration, the model is in good agreement with the data. The relative error,
is for the present model 20–30% of the error by the model of Choi and Kim (Citation2007). The temporal variation of concentration in the exhaled air–and in particular the longtime tail–is expected to reflect the rate of release of particles trapped in the alveoli. Thus, the observed agreement argues in favor of the assumption of alveolar mixing, on which the present model is based. However, it is admitted that other factors–such as ventilation distribution between dependent and non-dependent regions of the lung and airway branching asymmetry–are likely to also affect exhaled concentration profiles, and thus the quality of the agreement may to some extent be fortuitous.
It is noted that the above agreement does not depend on the choice of the only adjustable parameters in our model, i.e., the dimensionless boundary layer thicknesses in the alveoli, as this choice affects only the small-diameter end of the particle spectrum
On the contrary, the prediction depends on the correct modeling of axial dispersion, as is indicated by . Differences observed with the erroneous selections of
are more pronounced for
small for
and negligible for
As particles with
deposit the least, this behavior is attributed to the larger concentrations that float along the airways.
The importance of the inclusion of airway deformation in the model was interrogated by additional computations, holding airway dimensions constant at FRC values. In all cases, the exhaled particle concentrations decreased, with maximum deviations 15–30% around the middle of the exhalation maneuver and reduction of total exhaled particles by 5–8% (deviations increased with particle size). This behavior is understood by considering that, with rigid airways, the same inhaled volume results in larger alveolar expansion. Thus, more particles are trapped and fewer are exhaled.
An interesting deduction from the model is that the exhaled concentration profiles depend very weakly on the extent of alveolar deposition. Indeed, setting the latter artificially equal to zero (which amounts to roughly 25% reduction in total deposion) increases total exhaled particles by less than 1%. This is a confirmation of similar remarks in the literature (Darquenne and Paiva Citation1994), cautioning against the use of exhaled concentration profiles as indicators of deposition, because of the significant fraction of particles that may remain trapped in the alveoli.
Next, attention is focused on predictions of deposition and their comparison with data in . The results of the present model (bold lines) are an improvement over those of the Lagrangian model of Georgakakou et al. (dashed lines), particularly at the small and intermediate diameter range which is affected by the choice of parameters
In this range, the mean error between predictions and data is for the present model 58%, 35% and 13% of that of the older one, for the shallow, intermediate and deep breathing pattern respectively. The improvement is also reflected in the accurate prediction of the slope of the deposition curve at the fine-particle end and of the curvature around the minimum.
The dotted lines in are derived from the Lagrangian model of Georgakakou et al. (Citation2016) using the present distribution of values. The strong over-prediction of the data observed is presently understood as a consequence of the neglect of airway deformation during the breathing maneuver. If airway diameters are held constant, then only the alveoli expand during inhalation, resulting in significantly higher air and particle inflow. Once the number of particles that enter the alveolar volumes is overpredicted, agreement with data necessitates artificially low deposition rates. This explains the small value of
found by Georgakakou et al. (Citation2016) to fit best the data. It is concluded that accurate prediction of the air volumes that actually reach the alveoli is of vital importance for the quality of the model.
Finally, a note is in order for the apparently counter-intuitive outcome (both in the data and the model) that the intermediate breathing pattern results in higher pulmonary deposition than the deep breathing one. This behavior is explained if it is noted that the former pattern has twice the inhalation time of the latter, thus affording more time for gravitational settling in the acinus. Also, the higher velocities during deep breathing, result in stronger inertial deposition along the upper airways and thus decreased particle availability deep in the lung.
4.2. Implications of the assumption of perfect mixing
The central assumption of the present model, i.e., that the particle concentrations in the alveolar volumes of each generation may be treated as spatially uniform, has direct consequences on both particle transport and deposition. With respect to transport, it dictates that particles that have entered the alveoli are released during exhalation at a very slow rate, and thus remain trapped for long times even if they do not deposit. This behavior (kinematic irreversibility) is contrasted to the reversible movement of air in and out of the alveoli, which would result in the removal during exhalation of all the particles that had entered the alveoli and did not deposit on their wall.
It is also useful for the discussion that follows to recall that, according to the present model, particles move between the airways and the alveolar volumes of each generation by two mechanisms whose contribution is additive, (a) by convection with the air flow entering or leaving the alveoli and (b) by gravitational settling and/or Brownian diffusion on the fraction of the airway wall that is absent due to the alveolar openings. (This summation is equivalent to the classical formulation of mass flux of a component in a mixture as the sum of a convective and a molecular contribution.) In particular, particles enter the alveoli by mechanism (a) during inhalation and by mechanism (b) during the entire breathing cycle.
With respect to alveolar deposition, the assumption of spatially uniform particle concentration per alveolar generation is the basis of the simple expression, EquationEquation (19)(19)
(19) . However, the significance of the assumption is different for each of the two pulmonary deposition mechanisms, i.e., gravitational settling and Brownian diffusion.
More specifically, gravitational deposition is correctly predicted by EquationEquation (16)(16)
(16) , even when the particle distribution is non-uniform. For example, a higher density close to the wall would result in larger or smaller deposition depending on the orientation of the alveolus with respect to gravity, but the overall effect of a large number of randomly oriented alveoli would be equivalent to that resulting from uniform particle distribution. Thus, it is argued that gravitational deposition inside the alveoli is influenced by the rate of particle entrance and exit but is largely insensitive to the detailed spatial distribution.
It is further noted that, for particles with the characteristic gravitational time in EquationEquation (16)
(16)
(16) ,
is less than one second, and thus all the particles that enter the alveoli during inhalation (and do not move out during exhalation) have enough time to deposit. Also, and because of the high deposition probabilities of large particles in the proximal airways, the further influx by mechanism (b) is not significant. Thus, the prediction of gravitational deposition in the alveoli appears relatively straightforward. In particular, it depends to a large extent on the correct prediction of tracheo-bronchial deposition, as the latter determines the number of particles that actually reach the alveolated airways.
Prediction of the alveolar deposition for particles affected by Brownian diffusion is more uncertain because it depends on the extent of alveolar mixing per generation (which in the present model is expressed by parameters ). Small particles in the considered range (
) have two important characteristics: (i) They deposit far less in the tracheo-bronchial section, so they are contained in higher concentrations in the air that reaches the acinus. (ii) Their deposition probability in the distal airways increases strongly with generation. Thus, the fraction of particles that enter alveoli by deposition on the wall openings (mechanism (b) that is operative during the entire breathing cycle) grows rapidly in importance distally.
In order to understand the deposition behavior of these small particles, we consider the timescale for depletion of the alveolus by deposition due to Brownian diffusion, which is derived from EquationEquation (17)
(17)
(17) . Values of
lead to
indicating that particles which enter the alveoli have enough time to deposit almost completely and the actual value chosen for
is of limited importance. This appears to be the case for the first three alveolated generations, where particle inflow by inhalation (mechanism (a)) is dominant.
However, prediction of deposition for the next generations becomes increasingly more sensitive to the value of This is understood in terms of the increasing influence of particle inflow to alveoli through deposition on the openings of the airway wall (mechanism (b) that operates during the entire breathing cycle). The particles that enter during exhalation have less time to deposit and their fate depends more strongly on the intensity of mixing. In particular, no mixing occurs in the last generation, and thus deposition of small particles there is expected to be negligibly small.
Selection of appropriate values for was presently done on a purely empirical basis, i.e., by fitting predictions to data of pulmonary deposition. However, there appears to be direct correlation between
and parametric conditions that lead to chaotic mixing. More specifically, the original literature (Tsuda, Henry, and Butler Citation1995, Tsuda et al. Citation2002, Citation2008) indicates that the onset of chaotic mixing requires large values of the ratio
Using the estimates provided by Tsuda, Henry, and Butler (Citation2008), the order of magnitude of this ratio from the 15th to the 23rd generation is (3000, 1500, 900, 400, 200, 100, 40, 15, 3), to be compared with the above discussed values of
Though there is no fundamental justification for equating the dimensionless boundary layer thickness to the ratio
the similarity of scales is notable.
The present model of diffusional deposition in the alveoli is based on a double role of Brownian diffusivity. First, it defines the lengthscale, below which diffusion smears out the closely spaced concentration gradients that are created in the alveoli by the stretching and folding deformations of chaotic flow (Tsuda, Laine-Pearson, and Hydon Citation2011), leading to a uniform concentration in the core of the alveolus. This lengthscale may be estimated as
which–for a particle of
and typical duration of a breathing cycle–amounts to
Second, Brownian diffusivity determines deposition as a boundary-layer effect from this idealized, uniform concentration in the bulk, toward the wall where particle concentration is by definition zero (any particle that touches the wall deposits instantaneously).
4.3. Implications of the modeling of lung morphology and its temporal variation
Modern morphometric studies, based on the characterization of microscopic sections by stereology (Ochs et al. Citation2004; Weibel, Hsia, and Ochs Citation2007; Vasilescu et al. Citation2012), have provided valuable new information on the detailed lung micro-structure and in particular the topology of alveolar walls and openings. These findings support the simplified model used in the present work (which consists of open-ended ducts in one-dimensional flow, surrounded by uniform peripheral chambers in good mixing) in two respects: First, they confirm that the alveolar entrance rings, formed by the strong fiber tracts in the free edges of the alveolar septa, constitute a virtual duct. Second, they indicate that the size of a single alveolus varies little around a mean of and it is mainly the number of alveoli that varies with different lung volumes.
Airway elasticity has presently been taken into account, motivated by the need to estimate correctly the flow rate of air that actually reaches the alveolar volumes. The elasticity model employed is based on intramural pressure, and extrapolates measurements taken in the central and conducting airways of excised human lungs (Lambert et al. Citation1982) in order to estimate the expansion of alveolated ducts. There are other, equally legitimate modeling choices, such as for example isometric volume scaling (Choi and Kim Citation2007).
However, the reasonable criticism–that the extrapolation of elasticity characteristics from the conducting airways to the acinus is open to question–raises a more fundamental issue: Namely, what is the contribution of ducts and alveoli to volume change during expansion and contraction of the acinus, and how do the alveoli change in shape. Potential answers were discussed long ago (Greaves, Hildebrandt, and Hoppin Citation1986), and the question was highlighted more recently as “… may be the last frontier of gross anatomy” (Smaldone and Mitzner Citation2012).
Though the above issue is clearly beyond the scope of the present work, it is useful to clarify that our model corresponds to isotropic expansion and contraction of alveoli, i.e., it is valid for internal parenchymal surface area that varies with lung volume raised to the 0.67 power (For isotropic expansion, ). Isotropic variation without change in the number of active alveoli (i.e., no recruitment) has been questioned by measurements of the apparent diffusivity of 3He and of the acinar deposition of monodispersed aerosols during breathhold (Smaldone, Mitzner, and Itoh Citation1983; Hajari et al. Citation2012), but is supported by data from postmortem anatomy of frozen lungs (Glazier et al. Citation1967; Soutiere and Mitzner Citation2004).
5. Conclusions
A dynamic, single-path model has been developed for the prediction of particle transport and deposition deep in the lung. The model takes into account convection and dispersion along the air ducts, as well as particle exchange between ducts and alveoli. In particular, it models alveolar volumes of each generation as independent mixing chambers. In this respect, it is demonstrated that the assumption of alveolar mixing introduces an implicit axial dispersion mechanism that is unique to the acinus and independent of particle size and gravity.
Air inflow to (and outflow from) alveoli is calculated by accounting for the deformation of airways during breathing. Mechanistic models are derived for deposition inside the alveoli. In particular, deposition by Brownian diffusion is modeled by a concentration boundary layer, whose dimensionless thickness, varies inversely with the intensity of mixing.
The values of per generation were tailored so as to optimize the prediction of benchmark data of pulmonary deposition (Heyder et al. Citation1986). The agreement is satisfactory for all breathing patterns tested and extends over the entire particle diameter range measured (
). It is notable that the selected values of
are found to correlate with the ratio,
of airway flow to alveolar inflow. High values of this ratio are known to result in chaotic mixing (Tsuda, Henry, and Butler Citation1995, Tsuda et al. Citation2002).
The predictions of the present model are found to reproduce independent measurements of particle concentration in the mouth during pronounced exhalation of a continuously inhaled aerosol (Choi and Kim Citation2007). Because such measurements are expected to depend strongly on the release rate of particles retained in the acinus, it is argued that the agreement lends support to the assumption of alveolar mixing that is central to the model.
Funding
Partial financial support of this research by a donation from ELPEN Pharmaceutical is gratefully acknowledged.
References
- Cai, F. S., and C. P. Yu. 1988. Inertial and interceptional deposition of spherical particles and fibers in a bifurcating airway. J. Aerosol Sci. 19 (6):679–88. doi:10.1016/0021-8502(88)90003-1.
- Choi, J.-I., and C. S. Kim. 2007. Mathematical analysis of particle deposition in human lungs: An improved single path transport model. Inhal. Toxicol. 19 (11):925–39. doi:10.1080/08958370701513014.
- Darquenne, C., and M. Paiva. 1994. One-dimensional simulation of aerosol transport and deposition in the human lung. J. Appl. Physiol. 77 (6):2889–98. doi:10.1152/jappl.1994.77.6.2889.
- Darquenne, C., and G. K. Prisk. 2003. Effect of gravitational sedimentation on simulated aerosol dispersion in the human acinus. J. Aerosol Sci. 34 (4):405–18. doi:10.1016/S0021-8502(02)00187-8.
- Darquenne, C., J. B. West, and G. K. Prisk. 1998. Deposition and dispersion of 1-μm aerosol boluses in the human lung: Effect of micro- and hypergravity. J. Appl. Physiol. 85 (4):1252–9. doi:10.1152/jappl.1998.85.4.1252.
- Darquenne, C., J. B. West, and G. K. Prisk. 1999. Dispersion of 0.5- to 2-μm aerosol in μG and hypergravity as a probe of convective inhomogeneity in the lung. J. Appl. Physiol. 86 (4):1402–9. doi:10.1152/jappl.1999.86.4.1402.
- Egan, M. J., and W. Nixon. 1985. A model of aerosol deposition in the lung for use in inhalation dose assessments. Radiat. Prot. Dosimetry 11:15–7. doi:10.1093/oxfordjournals.rpd.a079438.
- Egan, M. J., W. Nixon, N. I. Robinson, A. C. James, and R. F. Phalen. 1989. Inhaled aerosol transport and deposition calculations for the ICRP Task Group. J. Aerosol Sci. 20 (8):1301–4. doi:10.1016/0021-8502(89)90822-7.
- Finlay, W. H. 2001. The mechanics of inhaled pharmaceutical aerosols an introduction. San Diego, CA: Academic Press.
- Fishler, R., M. K. Mulligan, and J. Sznitman. 2013. Acinus-on-a-chip: A microfluidic platform for pulmonary acinar flows. J. Biomech. 46 (16):2817–23. doi:10.1016/j.jbiomech.2013.08.020.
- Fishler, R., Y. Ostrovski, C.-Y. Lu, and J. Sznitman. 2017. Streamline crossing: An essential mechanism for aerosol dispersion in the pulmonary acinus. J. Biomech. 50:222–7. doi:10.1016/j.jbiomech.2016.11.043.
- Georgakakou, S., K. Gourgoulianis, Z. Daniil, and V. Bontozoglou. 2016. Prediction of particle deposition in the lungs based on simple modeling of alveolar mixing. Respir. Physiol. Neurobiol. 225:8–18. doi:10.1016/j.resp.2015.12.009.
- Glazier, J. B., J. M. Hughes, J. E. Maloney, and J. B. West. 1967. Vertical gradient of alveolar size in lungs of dogs frozen intact. J. Appl. Physiol. 23 (5):694–705. doi:10.1152/jappl.1967.23.5.694.
- Gourgoulianis, K., Z. Daniil, K. Athanasiou, S. Rozou, and V. Bontozoglou. 2017. Application of a one-dimensional computational model for the prediction of deposition from a dry powder inhaler. J. Aerosol Med. Pulm. Drug Deliv. 30 (6):435–43. doi:10.1089/jamp.2016.1363.
- Greaves, I. A., J. Hildebrandt, and F. G. Hoppin. 1986. Lung micromechanics. In Handbook of physiology-The respiratory system III edited by A. P. Fishman, P. T. Macklem, J. Mead and S. R. Geiger. Chapter 14, pp. 217–31. Bethesda: Physiological Soc.
- Grgic, B., W. H. Finlay, P. K. P. Burnell, and A. F. Heenan. 2004. In vitro intersubject and intrasubject deposition measurements in realistic mouth–throat geometries. J. Aerosol Sci. 35 (8):1025–40. doi:10.1016/j.jaerosci.2004.03.003.
- Hajari, A. J., D. A. Yablonskiy, A. L. Sukstanskii, J. D. Quirk, M. S. Conradi, and J. C. Woods. 2012. Morphometric changes in the human pulmonary acinus during inflation. J. Appl. Physiol. 112 (6):937–43. doi:10.1152/japplphysiol.00768.2011.
- Henry, F. S., J. P. Butler, and A. Tsuda. 2002. Kinematically irreversible acinar flow: A departure from classical dispersive aerosol transport theories. J. Appl. Physiol. 92 (2):835–45. doi:10.1152/japplphysiol.00385.2001.
- Henry, F. S., S. Haber, D. Haberthür, N. Filipovic, D. Milasinovic, J. C. Schittny, and A. Tsuda. 2012. The simultaneous role of an alveolus as flow mixer and flow feeder for the deposition of inhaled submicron particles. J. Biomech. Eng. 134 (12):121001. doi:10.1115/1.4007949.
- Heyder, J. 2004. Deposition of inhaled particles in the human respiratory tract and consequences for regional targeting in respiratory drug delivery. Proc. Am. Thorac. Soc. 1 (4):315–20. doi:10.1513/pats.200409-046TA.
- Heyder, J., and J. Gebhart. 1977. Gravitational deposition of particles from laminar aerosol flow through inclined circular tubes. J. Aerosol Sci. 8 (4):289–95. doi:10.1016/0021-8502(77)90048-9.
- Heyder, J., J. Gebhart, G. Rudolf, C. F. Schiller, and W. Stahlhofen. 1986. Deposition of particles in the human respiratory tract in the size range 0.005–15 μm. J. Aerosol Sci. 17 (5):811–25. doi:10.1016/0021-8502(86)90035-2.
- Hofemeier, P., K. Koshiyama, S. Wada, and J. Sznitman. 2018. One (sub-)acinus for all: Fate of inhaled aerosols in heterogeneous pulmonary acinar structures. Eur. J. Pharm. Sci. 113:53–63. doi:10.1016/j.ejps.2017.09.033.
- Hofmann, W., E. Pawlak, and R. Sturm. 2008. Semi-empirical stochastic model of aerosol bolus dispersion in the human lung. Inhal. Toxicol. 20 (12):1059–73. doi:10.1080/08958370802115081.
- ICRP. 1994. Human respiratory tract model for radiological protection. Ann. ICRP 24 (1–3):1–482.
- Ingham, D. B. 1975. Diffusion of Aerosols from a Stream Flowing Through a Cylindrical Tube. J Aerosol Sci 6 (2):125–32. doi:10.1016/0021-8502(75)90005-1.
- Khajeh-Hosseini-Dalasm, N., and P. W. Longest. 2015. Deposition of particles in the alveolar airways: Inhalation and breath-hold with pharmaceutical aerosols. J. Aerosol Sci. 79:15–30. doi:10.1016/j.jaerosci.2014.09.003.
- Kim, C. S., L. K. Brown, G. G. Lewars, and M. A. Sackner. 1983. Deposition of aerosol particles and flow resistance in mathematical and experimental airway models. J. Appl. Physiol. 55 (1):154–63. doi:10.1152/jappl.1983.55.1.154.
- Kleinstreuer, C., and Z. Zhang. 2010. Airflow and particle transport in the human respiratory system. Annu. Rev. Fluid Mech. 42 (1):301–34. doi:10.1146/annurev-fluid-121108-145453.
- Kolanjiyil, A. V., and C. Kleinstreuer. 2016. Computationally efficient analysis of particle transport and deposition in a human whole-lung-airway model. Part I: Theory and model validation. Comput. Biol. Med. 79:193–204. doi:10.1016/j.compbiomed.2016.10.020.
- Lambert, R. K., T. A. Wilson, R. E. Hyatt, and J. R. Rodarte. 1982. A computational model for expiratory flow. J. Appl. Physiol. 52 (1):44–56. doi:10.1152/jappl.1982.52.1.44.
- Longest, P. W., and L. T. Holbrook. 2012. In silico models of aerosol delivery to the respiratory tract–development and applications. Adv. Drug Deliv. Rev. 64 (4):296–311. doi:10.1016/j.addr.2011.05.009.
- Ma, B., and C. Darquenne. 2012. Aerosol bolus dispersion in acinar airways–influence of gravity and airway asymmetry. J. Appl. Physiol. 113 (3):442–50. doi:10.1152/japplphysiol.01549.2011.
- Martonen, T. B. 1993. Mathematical model for the selective deposition of inhaled pharmaceuticals. J. Pharm. Sci. 82 (12):1191–9. doi:10.1002/jps.2600821202.
- Ochs, M., J. R. Nyengaard, A. Jung, L. Knudsen, M. Voigt, T. Wahlers, J. Richter, and H. Gundersen. 2004. The number of alveoli in the human lung. Am. J. Respir. Crit. Care Med. 169 (1):120–4. doi:10.1164/rccm.200308-1107OC.
- Patankar, S. V. 1980. Numerical heat transfer and fluid flow, 79–96. New York, NY: Hemisphere.
- Pollak, A. G. 1998. A forward model for maximum expiration. Comput. Biol. Med. 28:613–25.
- Sarangapani, R., and A. S. Wexler. 1999. Modeling aerosol bolus dispersion in human airways. J. Aerosol Sci. 30 (10):1345–62. doi:10.1016/S0021-8502(99)00027-0.
- Scherer, P. W., L. H. Shendalman, N. M. Greene, and A. Bouhuys. 1975. Measurement of axial diffusivities in a model of the bronchial airways. J. Appl. Physiol 38 (4):719–23. doi:10.1152/jappl.1975.38.4.719.
- Smaldone, G. C., and W. Mitzner. 2012. Viewpoint: Unresolved mysteries. J. Appl. Physiol. 113 (12):1945–7. doi:10.1152/japplphysiol.00545.2012.
- Smaldone, G. C., W. Mitzner, and H. Itoh. 1983. The role of alveolar recruitment in lung inflation: Influence on pressure-volume hysteresis. J. Appl. Physiol. 55 (4):1321–32. doi:10.1152/jappl.1983.55.4.1321.
- Soutiere, S. E., and W. Mitzner. 2004. On defining total lung capacity in the mouse. J. Appl. Physiol. 96 (5):1658–64. doi:10.1152/japplphysiol.01098.2003.
- Sznitman, J., T. Heimsch, J. H. Wildhaber, A. Tsuda, and T. RöSgen. 2009. Respiratory flow phenomena and gravitational deposition in a three-dimensional space-filling model of the pulmonary acinar tree. J. Biomech. Eng. 131 (3):031010.
- Taulbee, D. B., and C. P. Yu. 1975. A theory of aerosol deposition in the human respiratory tract. J. Appl. Physiol. 38 (1):77–85. doi:10.1152/jappl.1975.38.1.77.
- Tsuda, A., F. S. Henry, and J. P. Butler. 1995. Chaotic mixing of alveolated duct flow in rhythmically expanding pulmonary acinus. J. Appl. Physiol. 79 (3):1055–63. doi:10.1152/jappl.1995.79.3.1055.
- Tsuda, A., F. S. Henry, and J. P. Butler. 2008. Gas and aerosol mixing in the acinus. Respir. Physiol. Neurobiol. 163 (1-3):139–49. doi:10.1016/j.resp.2008.02.010.
- Tsuda, A., F. E. Laine-Pearson, and P. E. Hydon. 2011. Why chaotic mixing of particles is inevitable in the deep lung. J. Theor. Biol. 286:57–66. doi:10.1016/j.jtbi.2011.06.038.
- Tsuda, A., R. A. Rogers, P. E. Hydon, and J. P. Butler. 2002. Chaotic mixing deep in the lung. Proc. Natl. Acad. Sci. USA. 99 (15):10173–8. doi:10.1073/pnas.102318299.
- Ultman, J. S., and M. W. Thomas. 1979. Longitudinal mixing in pulmonary airways: Comparison of inspiration and expiration. J. Appl. Physiol. 46 (4):799–805. doi:10.1152/jappl.1979.46.4.799.
- Vasilescu, D. M., Z. Gao, P. K. Saha, L. Yin, G. Wang, B. Haefeli-Bleuer, M. Ochs, E. R. Weibel, and E. A. Hoffman. 2012. Assessment of morphometry of pulmonary acini in mouse lungs by nondestructive imaging using multiscale microcomputed tomography. Proc. Natl. Acad. Sci. USA. 109 (42):17105–10. doi:10.1073/pnas.1215112109.
- Weibel, E. R. 1963. Morphology of human lung. New York, NY: Academic Press.
- Weibel, E. R., C. C. W. Hsia, and M. Ochs. 2007. How much is there really? Why sterology is essential in lung morphometry. J. Appl. Physiol. 102 (1):459–67. doi:10.1152/japplphysiol.00808.2006.