
 ?Mathematical formulae have been encoded as MathML and are displayed in this HTML version using MathJax in order to improve their display. Uncheck the box to turn MathJax off. This feature requires Javascript. Click on a formula to zoom.
Abstract
Building ventilation ducting systems play a core role in controlling indoor air quality by recirculating the indoor air and mixing with ambient air. The ventilation system can serve as an air cleaning system itself either through the filtration system or integrating other means, while at the same time, attention to energy consumption is needed. The high-efficiency fibrous filters in a conventional filtration system not only cause high-pressure drops that consume fan energy but also add to the high operation cost. This article proposes an air cleaning technique, aimed at submicron particles, by means of installing patterned surfaces on the walls of ventilation ducts, which can be easily cleaned by water and reused. The effect of patterned surfaces on particle deposition was studied numerically. In the numerical simulation, the Reynolds stress turbulent model was correlated at the near-wall regions by turbulent velocity fluctuation at the normal direction. Particle trajectory was solved by using Lagrangian particle tracking. The numerical model was then validated with a particle deposition experiment. A wind tunnel experiment was carried out to quantify the particle deposition on the semicircular micropatterns for a wide range of heights. Based on our numerical results, the semicircular pattern height of 500 µm with a pitch-to-height ratio (p/e) of 10 has 8.58 times enhancement of the energy efficiency compared with a high-efficiency particulate air filter. Our results indicated that adding surface micropatterns to ventilation ducting for submicron particle deposition is a possible energy-efficient air cleaning technique for practical usage.
Copyright © 2020 American Association for Aerosol Research
EDITOR:
1. Introduction
The transport and deposition of particles in turbulent ducts, indoor environments, and electronic devices have been widely investigated. In some indoor environments, managing particle deposition can improve occupants’ welfare and reduce the risks from exposure to poor air quality (Whicker, Wasiolek, and Tavani Citation2002). There are different sources of particulate matter (PM) and different methods to remove them in order to achieve good indoor air quality. Considering effects on health, PM is typically defined by size, with the smaller particles having a greater impact on health. There are different tools to remove different size of PM, but disadvantages exist in them. An efficient air cleaner is a good household appliance to remove particles larger than 1 However, it is difficult for most air cleaners to remove submicron particles, especially in the range of 0.1 to 1 μm (Shaughnessy et al. Citation1994). High grade, densely packed fiber filters can remove some of these particles, but such filters are expensive to maintain. Another way to improve the indoor air quality is to enhance particle deposition in commercial ventilation ducting systems. Ventilation ducting systems facilitate fresh air in indoor environments by being receptive to ambient air and re-circulating indoor air. Through ventilation ducts, outdoor particles may be carried indoors, and indoor generated particles may return indoors. Therefore, particle deposition in ventilation ducts has an important influence on building occupants’ exposure to particles. The occupants of buildings can breathe cleaner air if more particles are deposited on the ventilation ducts. Most of the current ventilation ducting systems use a high-efficiency particulate air filter (HEPA). Although, the filtration efficiency of HEPA can reach up to 99% for submicron particles, the ventilation ducting system also suffers a large pressure drop of 500 Pa (Model H13-P20, Klima-Service Incorporated, CZ). Moreover, the pressure drop increases with dust loading which leads to an unsatisfactory operation procedure due to periodical replacement (Hosseini and Tafreshi Citation2010; Thomas et al. Citation2001). Further, the heating ventilation and air conditioning (HVAC) fans required to overcome this pressure drop accounts for 30% of an HVAC system’s average energy consumption (McQuiston and Parker Citation2004). Overall, HEPA filters are not generally used due to their very high operation cost and high pressure drop. It is valuable to explore other ways that can enhance submicron particle deposition along with reducing the pressure drop.
A novel technique needs to be implemented for ventilation ducts to capture submicron particles and reduce their concentration before entering the indoor space. The particle deposition on ventilation ducting walls has been understood extensively both theoretically and experimentally. Sippola and Nazaroff (Citation2004) experimentally indicated that surface roughness is the dominant factor for deposition in a ventilation duct. They investigated the influence of particle size, air speed, and deposition surface characteristics. Their results concluded that the deposition velocities to duct ceilings and walls were greatly enhanced in ducts with insulation roughness elements in comparison with steel ducts. Zhao and Wu (Citation2006a) proposed an improved Eulerian model to predict particle deposition velocity by considering turbophoresis as well as Brownian motion, turbulent diffusion, and gravitational settling in a fully developed turbulent duct flow. Their model only required friction velocity as the input and then, they applied this model to predict particle deposition velocity onto rough walls (Zhao and Wu Citation2006b). They concluded that the dimensionless deposition velocity increases as the dimensionless effective roughness increases, which will cause the flow to separate partly to form a “separated free shear layer” behind the roughness. Lai and Nazaroff (Citation2005) studied the deposition of 0.9 to 9 µm monodisperse particles onto vertical walls with a sandpaper roughness ranging from 10 to 250 µm. It is confirmed that the deposition rate increases significantly with the increase of roughness, and it becomes a constant when the roughness is large enough. Most researchers parameterized surface roughness based on surface roughness height, moreover, Hussein et al. (Citation2012) considered two roughness parameters and generalized the models by proposing a dimensionless number: the ratio of surface roughness height to the peak-to-peak distance. Subsequently, Lai, Byrne, and Goddard (Citation1999, Citation2001) compared particle deposition rate in smooth and ribbed duct air flow by experimental measurement. Their results indicated that the ribbed wall with the rib pitch-to-height ratio of 10 could significantly enhance the 0.7 to 7.1 μm particle deposition rate. But the deposition mechanism by a patterned surface is still not well understood until flow field numerical simulation works. Lu and Lu (Citation2016) numerically explained that a larger number of particles were intercepted by the recirculation flow between the surface ribs, where the submicron particles can reach the highest enhancement. It is beneficial to use regular patterned surfaces to deposit more submicron particles in a ventilation duct.
Previous studies show that patterned surfaces can enhance the deposition of submicron particles. Since such patterned surfaces are convenient to change, this is also a simple and economical way to integrate an air cleaning function in ventilation ducts. The pressure drop increase along the ventilation duct will cause the fan energy to overcome this resistance, and, therefore, increasing HVAC system’s average energy consumption. In order to compromise the overall performance of energy consumption increase and particle deposition enhancement by various pattern shapes and different value of pitch-to-height ratio (p/e), the shape of semicircular have been selected to reach the best efficiency in comparison with the shape of triangular, rectangular, and open-circular patterned surface (Xu et al. Citation2020). Lotus leaves in semicircular shape are known to be very effective in collecting airborne particles (Beckett, Freer-Smith, and Taylor Citation1998). Another natural trait is inspired by shark skin that can reduce fluid drag effectively in the turbulent flow regime (Bechert, Bruse, and Hage Citation2000). Dean and Bhushan (Citation2010) found that circular riblets cause a reduction in shear stress at the surface, when comparing drag reduction from a blade riblet, an open triangle and an open circle shape, which all represent different patterns on a shark’s surface. These natural traits and previous studies indicate that semicircular patterns can enhance particle deposition as well as reduce fluid drag in the turbulent flow. Since the smallest scale in turbulent flow can go down to the micrometer level, if the patterned structure on the wall surface is at the micrometer-scale, the two scales become comparable and interaction is manifested. By optimizing the micro patterns’ height and p/e value, the deposition enhancement could be maximized.
In this research, there are two main objectives: first, to investigate the effects of pattern height and p/e value on deposition velocity for submicron and micron-sized particles by both numerical and experimental approaches; second, to compare the differential pressure weighted deposition enhancement between a patterned surface and a HEPA filter. Particle deposition enhancement on a semicircular surface in turbulent flows was examined by using computational fluid dynamics simulation. A particle deposition experiment was carried out to validate our numerical results for a wide range of pattern heights and particle sizes. The height of semicircular patterns in the numerical setup is 2000 µm, 1500 µm, 800 µm, and 500 µm. In order to compare with other benchmark cases, the highest semicircular rib is set to be 2000 The semicircular height of 500
is the lowest resolution we can fabricate by using 3D priting in our experiment. The p/e value varied from 3 to 10 with particle diameters of 0.1, 0.2, 0.3, 0.5, 1, 2, 3 µm. The smallest p/e is 3 for our semicircular ribs (the ratio of semicircular base to height is 2) and the largest p/e is 10 in order to determine the optimized p/e ratio under different heights. For the particle size, we focused on submicron particles. However, particles larger than 1
are used to observe the whole trend of particle deposition enhancement under various relaxation times. Finally, the benefits of our designed patterned surface are compared with a HEPA filter in a ventilation duct to indicate the best efficiency index.
2. Numerical methodology and validation
2.1. Turbulent air flow and Lagrangian particle tracking
Computational fluid dynamics simulation (CFD) methods have been used to predict the particle deposition by applying different numerical models (Tao, Inthavong, and Tu Citation2017). Gao et al. (Citation2012) compared the capability and accuracy of three Reynolds-averaged Navier–Stokes equations (RANS) turbulence model and concluded that the Reynolds stress turbulent model (RSM) with near-wall corrections obtained a more reasonable prediction of deposition rate of particles less than 1 µm than the Shear Stress Transport (SST) and Re-normalization Group (RNG)
models. Besides, Mehel et al. (Citation2010) took the recommendation of enhanced wall treatment combined with near-wall correlations in the RSM model. Their results yield very satisfactory predictions over the whole range including inertia, diffusion, and diffusion-impaction regime. In this research, the RSM was coupled with a discrete random walk model to reproduce the instantaneous velocity field and a one-way coupled Lagrangian approach was employed to solve each particle trajectory. ANSYS Fluent 16.1 with UDF near-wall correlations was used. The second-order upwind scheme was used for solving the momentum equation and additional transport equations associated with the RANS models. Here,
is the instantaneous flow velocity and the overbar represents an average. The governing equations for mass and momentum conservation are demonstrated by EquationEquations (1)
(1)
(1) and Equation(2)
(2)
(2) .
(1)
(1)
(2)
(2)
where
is the time-averaged velocity,
is the time-averaged pressure,
is the dynamic viscosity of the fluid. The anisotropy of turbulence significantly affects the mean flow, thus the corresponding Reynolds stress tensor,
was evaluated using the Reynolds stress transport model by EquationEquation (3)
(3)
(3) . Different terms from EquationEquations (4)–(7) represents the stress production term, pressure-strain redistribution term, turbulent dissipation term, and turbulent diffusion term.
(3)
(3)
(4)
(4)
(5)
(5)
(6)
(6)
(7)
(7)
The instantaneous value of the fluid velocity was determined by the summation of mean fluid phase velocity () and fluctuating velocity (
). Then, the turbulent dispersion of particles can be modeled using a stochastic approach by integrating the instantaneous fluid velocity along the particle trajectory. This process needs to compute the trajectory for enough particles (30,000 particles released in the current simulation). In EquationEquation (8)
(8)
(8) , the turbulence eddy is characterized by a Gaussian distributed random velocity fluctuation, u′, v′, and w′.
(8)
(8)
where ς is a normally distributed random number between 0 and 1, the remainder of the right-hand side is the local root mean square (RMS) value of the velocity fluctuations. Previous studies showed that turbulent velocity fluctuation in the wall-normal direction has a crucial influence on particle deposition velocity (Tian and Ahmadi Citation2007; Zhang and Chen Citation2009). A near wall correction in EquationEquation (9)
(9)
(9) was applied to the boundary layer when
(9)
(9)
where
and
Ounis, Ahmadi, and McLaughlin (Citation1991) suggested A as 0.008 by using the DNS analysis of near wall flows. Therefore, the near-wall (
) turbulence kinetic energy can be altered to EquationEquation (10)
(10)
(10) .
(10)
(10)
The values calculated by EquationEquation (10)(10)
(10) are set to the first two rows of the cells next to the wall boundaries. Although, the turbulence kinetic energy in EquationEquation (10)
(10)
(10) remains isotropic, the prediction of the normal component of Reynolds stress term is improved and the particle deposition velocity is more reasonable (Lai and Chen Citation2006). A fully developed turbulent channel flow profile for the velocity magnitude, turbulence kinetic energy, and turbulence dissipation rate were imposed at the inlet (Xu et al. Citation2020). Fluent Lagrangian discrete phase model (DPM) can accurately model the Brownian diffusion as it physically models the Brownian motion (Zhao, Chen, and Lai Citation2011). Al Assaad, Ghali, and Ghaddar (Citation2019) used DPM and validated CFD model to track the dispersion of floor-resuspended particles at the particle size of 1 µ
and 10 µ
The DPM implemented in Fluent treated the fluid phase as a continuum by solving the Navier–Stokes equations, while the dispersed phase is solved by tracking a large number of particles through the calculated flow field. The Fluent Lagrangian DPM was solved by EquationEquations (11)
(11)
(11) and Equation(12)
(12)
(12) .
(11)
(11)
(12)
(12)
EquationEquations (11)(11)
(11) and Equation(12)
(12)
(12) describe the particle velocity equation and particle trajectory equation. Here, Fdrag is the particle drag force, gx is the gravitational acceleration, and Fx is additional forces that include Brownian motion force (Fbrownian), and particle lift force (Flift) listed in . The particle drag force for micron-sized particles is dependent on different particle Reynolds number, which can be defined in EquationEquation (13)
(13)
(13) . For submicron particles, they tend to follow the flow field more quickly and, therefore, the local velocity of each particle can be considered as having the same local velocity of air.
(13)
(13)
where u is the local velocity of air and
is the local velocity of the particle. A detailed description of the numerical model and different particle force can also be found in Xu et al. (Citation2020). EquationEquations (14)
(14)
(14) and Equation(15)
(15)
(15) define the particle drag force for submicron and micron-sized particles.
(14)
(14)
(15)
(15)
Table 1. Comparison between HEPA filter and different heights of the patterned surface.
2.2. Computational domain and mesh independence study
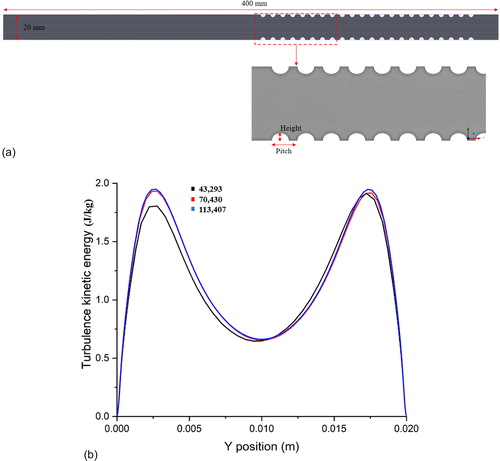
The computational domain which resembles the experimental setup with semicircular ribs is displayed in . The length of the channel is 400 mm and the width of the channel is 20 mm. The distance between the inlet and start of the semicircular rib is 200 mm. The ratio of rib height to the rib base width was 0.5, which is consistent for all cases. The “pitch” and “height” are represented in . The average inlet velocity is 6 m/s. At the outlet, the Neumann boundary condition was applied. No slip boundary condition and adiabatic boundary condition were applied to the upper and lower of the pattern wall. An unstructured mesh with fine grid combined with 11 inflation layers (the Y-plus for the first inflation layer is 1.13) around the semicircular structured surfaces and a coarse grid for the free stream flow was employed, as shown in the bottom subfigure of . displays the grid independence study for the turbulence kinetic energy along Y-axis at the outlet of the channel for three different meshes (43,293, 70,430, and 113,407 cells). It can be observed that the local turbulence kinetic energy calculated in the cases of 70,430 and 113,407 cells overlap with each other. Therefore, our numerical cases applied the cell density of 70,430.
Figure 1. (a) Computational domain of semicircular patterned surfaces and mesh distribution. (b) Turbulence kinetic energy (J/kg) along the Y-axis.
3. Validation with experimental results
3.1. Experimental setup and methodology
In order to validate the numerical model, a wind tunnel was used to provide a fully developed turbulent airflow. The bottom subfigure in illustrates the isometric view of the ribbed surface, where the upper left figure represents pitch and height. The size of the ribbed surface was 75 mm × 25 mm. Each ribbed surface was attached to the test section by double-sided tape. As shown in , the wind tunnel consists of a blower, honeycomb-screens, a long channel of more than 3 m, test section and diffuser (Fu, Leung, and Chao Citation2014). The honeycomb shaped component plus the screens are effective for removing swirl and lateral mean velocity variations. The honeycomb is used to remove twist from the flow and redirect all flow down the axis of the wind tunnel. To further reduce the amount of turbulence in the flow, Mehta and Bradshaw (Citation1979) recommend a series of turbulence reducing screens. The screens are recommended to go from a low mesh size for the first screen to a high mesh size for the final screen. A longer settling distance allows the flow to stabilize before entering the test section. Unstable flow entering the test section would cause flow separation resulting in additional turbulence. The channel measured 20 mm in height, 200 mm in width with the test section located 3 m downstream along the duct in order to stabilize the flow and was at 150 times the height of the channel. The duct was made entirely from transparent Perspex. Further, a holder was prepared in order to fix the sample on the centerline of the duct, and a blower driven by a frequency inverter at 275 Hz induced airflow into the duct at a free stream velocity of 6 m/s. This free stream velocity is similar to the air velocity in ventilation supply ducts. EquationEquation (16)(16)
(16) displays the relationship between the friction velocity and the pressure drop in a fully developed channel flow (Pope Citation2001). For a fully developed flow, the friction velocity
is related to the pressure drop per length in the downstream direction dp/dx in EquationEquation (16)
(16)
(16) .
(16)
(16)
where h is the height of the channel and
is the density of air. By comparing the measurement of pressure drop and the friction velocity using a particle image velocimetry system (Fu, Leung, and Chao Citation2014), it was confirmed that the flow was fully developed at the test section. Based on EquationEquation (16)
(16)
(16) , the friction velocity is calculated as 0.47 m/s.
Figure 2. (a) Experimental setup and patterned surface for the semicircular height of (b) 2000 µm (p/e from left to right: 3, 4, 5, and 6) and (c) 500 µm (p/e from left to right: p/e = 3, 4, 5, 6, and 10).
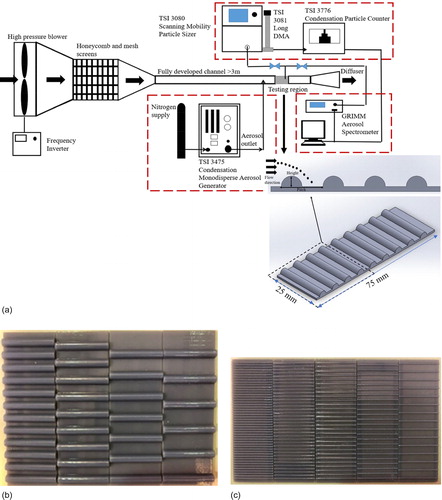
In our experiment, an aerosol generator (TSI 3475, TSI Incorporated, USA) was used to generate high concentration monodispersed aerosols. Vaporized di-2-ethyl hexyl sebacate (DEHS) was condensed onto sodium chloride (NaCl) particles to form airborne particles. The aerosol generator was able to generate particles with sizes ranging from 0.1 to 8 µm (aerodynamic diameter) with a high monodispersity by adjusting the temperature of the saturator. The geometric standard deviation factor for the aerodynamic diameter from 0.5 to 8 is less than 1.15. A compressed nitrogen cylinder was connected to the inlet of the aerosol generator to supply a constant flow rate of 250 l/h. The outlet of the aerosol generator was connected downstream of the long channel to continuously release aerosol particles at a concentration of 3×
to 5×
particles/m3 during the experiment. The flow rate of the aerosol generator is 3.67 lpm, and the aerosol density is 912 kg/m3. An aerosol spectrometer (Model 1.108, GRIMM Aerosol, Germany) was used to monitor the particle concentration (particle number per volume) in the free stream for particles of 2.5 µm or above. A Scanning Mobility Particle Sizer (SMPS 3080, TSI Incorporated, USA) was used to measure the particle number concentration for the particle size from 0.01 to 1 µm. The aerosol flow rates for SMPS and GRIMM Particle spectrometer are 3.0 lpm and 1.2 lpm, respectively. The sampling times for the SMPS and GRIMM spectrometer are 3.43 s and 1 s. Two different heights (2000 µm and 500 µm) of semicircular ribbed surface were tested in our experiment, as shown in . All the patterned surfaces were 3D-printed using photopolymer material. The particle deposition velocity,
to a surface is defined as EquationEquation (17)
(17)
(17) .
(17)
(17)
In EquationEquation (17)(17)
(17) , J is the particle flux to the patterned surface,
is the particle number concentration per volume. The particle flux is defined as the particle deposition number per area divided by the deposition duration. The particle deposition number is calculated by EquationEquation (18)
(18)
(18) . A detailed derivation of EquationEquation (18)
(18)
(18) is explained in Section S1 of online supplementary information (SI).
(18)
(18)
where Nd is the particle deposition number, rs is the measured contact radius,
is the particle contact angle, and dp is the aerodynamic particle diameter.
3.2. Comparison between experimental and numerical results
In our validation cases, the dimension of simulation geometry is similar to our patterned surface at the bottom subfigure in . The distance between the aerosol releasing position and the location of the first semicircular rib in the simulation case identical to the distance between the outlet of the aerosol generator and the patterned surface. In the simulation, all particles are assumed spherical and the particle–particle interaction and re-suspension are not considered. One-way coupling is used and, therefore, the airflow is not affected by the particle motion. As the aerosol liquid attaches to the surface, DEHS can stay for a long time without resuspension. The condensation aerosol generator nebulizes DEHS to produce a high concentration of monodisperse aerosols. The high flow velocity in the wind tunnel creates less chance of particles being able to collide and coalesce with each other in the air. Although, the fluid flow generates considerable removal forces, the liquid aerosols can still attach to the solid surface due to the adhesive force arising from the surface tension of the liquid film. According to the study of liquid aerosol sliding velocity after detachment by Fu, Leung, and Chao (Citation2014), the droplet detachment on three different materials (PMMA, Glass and Stainless Steel) are investigated. They demonstrated the friction velocity to detach liquid aerosol should be at least 1 m/s on the PMMA surface. Therefore, our friction velocity in the wind tunnel experiment is under the critical point to detach liquid aerosol. In order to predict the deposition velocity precisely, our numerical model was then validated with experimental results for the submicron and micron-sized particles.
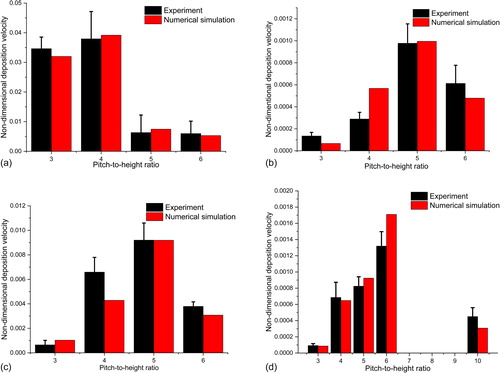
The particle deposition velocity for different p/e value of a semicircular shape between experimental (black) and numerical simulation (red) are compared and displayed in . In general, the numerical results are close to the experimental results, and the numerical model was validated by both submicron-sized (0.5 µm) and micron-sized (2.5 µm) particles. From , the bar column for experimental and numerical results follow a similar trend. The semicircular patterns dominate the surface and the effect of surface roughness for particle deposition can be negligible. The discrepancies between numerical and experimental deposition velocity may be due to the limitation of the microscope. At a larger p/e value, it can be indicated from numerical simulation that most particles tend to deposit at the upstream and downstream edge of the semicircular patterns. These regions are barely observed under the microscope. The overall enhancement calculated will be lower than the numerical results, as shown in . Illustrations of particle deposition at different regions between the cavity of semicircular patterned surface can be found in Section S2 of the SI. The deposition velocities at the upstream, center and downstream regions for the particle size of 0.5 µm and 2.5 µm at different p/e are concluded in the Tables S2 and S3 (please refer to the SI).
Figure 3. Comparison of nondimensional deposition velocity between experimental (black) and numerical simulation (red) at the semicircular height of 2000 μm for the particle size of (a) 2.5 µm and (b) 0.5 µm and semicircular height of 500 μm for the particle size of (c) 2.5 µm and (d) 0.5 µm.
4. Numerical results and discussion
4.1. Particle deposition in the cavity
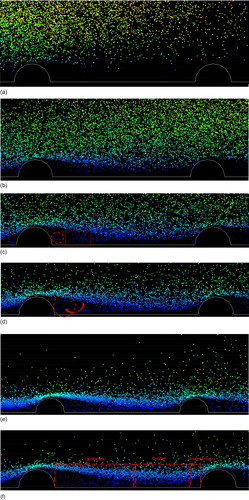
Our numerical simulation showed that the location for deposition of submicron particles mainly happened at the cavity of two semicircular ribs (upstream, center, and downstream). The flow field to induce particle trajectory in can refer to Section S3 of the SI. The height of semicircular rib in is 500 µ and the p/e is 10. The particles follow the recirculation and separation flow to deposit on the bottom surface of the cavity. However, fewer particles deposit at the windward side of semicircular ribs. In , particles follow the upward flow into the cavity. In , some of the particles follow the separation flow to the center of the cavity. As shown in , most of the particles tend to accumulate upstream of the cavity, as illustrated by the red rectangular region. The red circle in represents where a small vortex formed, and few particles were dispersed into the high-vorticity region. In , the particle swirl region is clearer because many of the particles enter the red circle. However, some of the particles still follow the mainstream to downstream of the cavity. As more particles flow into the swirl flow region, they disperse close to the solid wall in and deposit on the surface. Based on our numerical simulation results, the submicron particles tend to deposit at the bottom surface between cavities. The effect of riblet interception can only deposit fewer particles because the submicron particles have lower mechanisms of inertia impaction compared with the diffusion regime.
Figure 4. 0.5-µ particle trajectory at different time steps (p/e = 10): (a) 0.005 s; (b) 0.007 s; (c) 0.009 s; (d) 0.011 s; (e) 0.013 s; (f) 0.015 s.
4.2. Particle deposition velocity and deposition enhancement
In this section, we investigated the deposition effect of different heights and different p/e of semicircular patterns. The nondimensional particle deposition velocity and relaxation time can be estimated by EquationEquations (19)(19)
(19) and Equation(20)
(20)
(20) . In EquationEquation (19)
(19)
(19) ,
is the number of deposited particles in the time duration of
is the initial particle number uniformly distributed,
is the particle distribution region within a certain distance from the wall, and the superscript “+” means normalization by the wall units, S is the particle to air density ratio, dp is the particle diameter, υ is the air kinematic viscosity, and
is the Stokes Cunningham correlation.
(19)
(19)
(20)
(20)
The particle deposition enhancement ratio is defined as the ratio of deposition velocity of a patterned surface to the deposition velocity of a smooth surface, in EquationEquation (21)(21)
(21) .
(21)
(21)
where
and
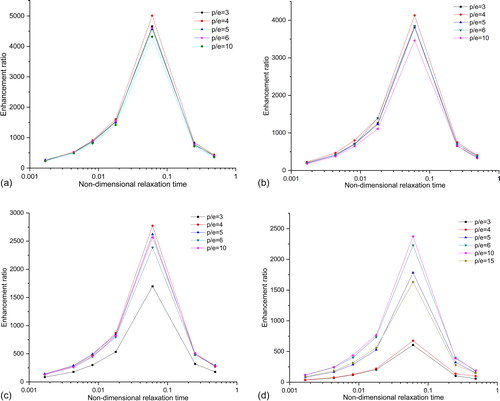
are the particle deposition velocity of a semicircular micropatterned surface and smooth surface, respectively. compares the particle deposition enhancement under different p/e value for different heights of semicircular patterns. From , the p/e value of 4 has the best particle deposition enhancement. The maximum enhancement ratio can reach 5009, 4132, 2773, and 2372 for the semicircular height of 2000 µm, 1500 µm, 800 µm, and 500 µm when the nondimensional relaxation time is 0.0606 (with a particle size of 1 µm). The enhancement ratio increased from submicron particles to the particle size of 1 µm, and then decreased for the micron-sized particles. As the relaxation time increases, the turbulent diffusion effect will decrease. The enhancement ratio for larger particles also decreases when the nondimensional relaxation time exceeds 0.06. The larger particles have no time to respond to the changes in the near-wall flow motions by the semicircular patterned. Instead, their motion is only affected by the larger eddies in the bulk of the flow. For all particle sizes at different p/e value and semicircular heights, the enhancement ratio is always above 1. The maximum enhancement ratio with a semicircular height of 500 µm changed to a p/e value of 10. The lowest enhancement ratio among all the p/e values is at 10 for the semicircular height of 2000 µm and 1500 µm; while the lowest enhancement ratio is at 3 for the semicircular height of 800 µm and 500 µm. The enhancement ratio for different p/e value can be separated clearly when the pattern height is 500 µm, as shown in . At a greater height, the enhancement effect for a single rib is too large, dominating the p/e effect. Therefore, the influence of p/e value moves closer for the higher semicircular ribs. At a smaller height of semicircular rib, the various p/e effect dominates the particle deposition enhancement. This can explain why the separation of enhancement ratio curves for different p/e increases as the height of semicircular rib decreases from 2000 µ
to 500 µ
Figure 5. Comparison of enhancement ratio for different heights of semicircular patterns: (a) 2000 µm; (b) 1500 µm; (c) 800 µm; (d) 500 µm.
4.3. Comparison of efficiency index in ventilation ducting systems
Removal of submicron particles is very difficult due to their small size, but high grade densely packed fiber HEPA (high efficiency particulate air) filters perform well (Wang and Kasper Citation1991). Joubert et al. (Citation2011) indicated a longer filtration time will impart the particles forming the cake and the water vapor in the air, therefore, resulting in a higher pressure drop during the clogging. It will eventually lead to higher energy consumption in the HVAC fans for air circulation and ventilation. In order to investigate the feasibility of integrating the air cleaning function in ventilation ducts using a patterned surface, an efficiency index ƞ has been defined in EquationEquation (22)(22)
(22) , which represents a pressure differential weighted particle deposition enhancement (Lu and Lu Citation2016).
(22)
(22)
where
and
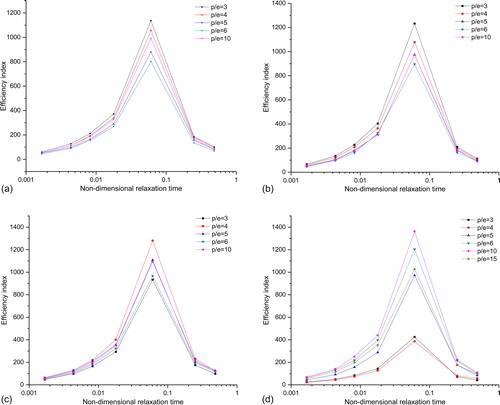
are the friction factors for a semicircular micropatterned surface and smooth surface, respectively. The pressure drop along the channel for different heights of semicircular patterns at various p/e have been discussed in the Section S3 of the SI. displays the efficiency index under different heights of a semicircular patterned surface. Regarding the maximum efficiency index, the semicircular height of 2000 µm and 1500 µm has a lower value compared with 800 µm and 500 µm. The p/e value of 10 at the semicircular height of 500 µm has the largest efficiency index of 1363 compared with all other p/e values among different heights of semicircular patterns. For the semicircular height of 2000 µm and 1500 µm, the efficiency index decreases from p/e value of 3 to 6. For the semicircular height of 800 µm, the p/e value of 4 has the best efficiency index and a p/e value of 3 has the worst performance. The particle deposition enhancement with a p/e value of 3 is much lower than any other p/e value, and this leads to the lowest efficiency index. Regarding different sizes of particles, the maximum efficiency index always appears at 1 µm. As the particle size increases or decreases, the efficiency index decreases. It shows the efficiency index becomes lower when applied to micron-sized or ultrafine particle deposition.
Figure 6. Comparison of efficiency index for different heights of semicircular patterns: (a) e = 2000 µm; (b) e = 1500 µm; (c) e = 800 µm; (d) e = 500 µm.
The HEPA has been commonly used in current ventilation systems to deposit submicron particles. It can filter the particle size around 0.5 µm with a particle separation efficiency of up to 99.95%, however, it causes a large pressure drop of 500 Pa along the HEPA filter width of 292 mm (Model H13-P20, Klima-Service Incorporated, CZ). In order to compare under similar circumstances, the pressure drop per unit length is used for both HEPA filter and micropatterned surface. If the same number of 0.5-µm particles are released from the duct inlet, the efficiency index can be calculated by EquationEquation (22)(22)
(22) . shows the comparison of efficiency index between the HEPA filter and micropatterned surface. The best efficiency index of different heights of patterned surface under optimized p/e value is listed. Although, the nondimensional deposition velocity of a HEPA filter is much larger than our patterned surface, the efficiency index is smaller than our patterned surface. The significant pressure drop caused by the HEPA filter in the ventilation duct will lead to increased energy consumption in commercial buildings. Moreover, our patterned surface can be reused and cleaned by water if particles have fully loaded the patterned surface, making the cost of our patterned surface lower than the cost of using HEPA filters to reach a similar efficiency index. Therefore, it is recommended that our proposed patterned surface be applied within a ventilation duct to enhance particle deposition as well as to reduce energy consumption.
5. Conclusions
This article reported a fundamental study on particle deposition and proposed a possibility to integrate the air cleaning function in ventilation ducts. Patterned surfaces can enhance particle deposition, but they also cause pressure resistance to the duct. The effect of different p/e value of semicircular patterned surfaces on particle deposition in a turbulent channel flow was presented. A feasibility study of applying semicircular patterned surfaces as an air cleaning technique in ventilation ducts was conducted in comparison with the HEPA filter. The overall performance combined with deposition enhancement and increase of pressure drop in the HEPA filter is 50.79. Therefore, we suggest using the semicircular height of 500 µm at the p/e value of 10, which has the highest efficiency index at 435.90. One limitation is that we only considered liquid aerosol with high adhesive force on the 3D printed patterned surface. In real life, amorphous solid particles with weaker adhesive forces may be more susceptible to detach from the surface. Therefore, further studies could be conducted to investigate different aerosol materials. Another limitation is that our numerical model did not consider the turbophoresis force for small roughness elements on the surface. As the wall roughness is always irregular and complicated, further investigations will be helpful for considering particle turbophoresis to predict the particle deposition velocity from fully turbulent flow onto rough surfaces in ventilation ducts.
Supplemental Material
Download MS Word (4.8 MB)Additional information
Funding
References
- Al Assaad, D., K. Ghali, and N. Ghaddar. 2019. Particles dispersion due to human prostration cycle and ventilation system in a prayer room. Build. Environ. 150:44–59. doi:10.1016/j.buildenv.2019.01.005.
- Bechert, D., M. Bruse, and W. Hage. 2000. Experiments with three-dimensional riblets as an idealized model of shark skin. Exp. Fluids 28 (5):403–12. doi:10.1007/s003480050400.
- Beckett, K. P., P. Freer-Smith, and G. Taylor. 1998. Urban woodlands: Their role in reducing the effects of particulate pollution. Environ. Pollut. 99 (3):347–60. doi:10.1016/S0269-7491(98)00016-5.
- Dean, B., and B. Bhushan. 2010. Shark-skin surfaces for fluid-drag reduction in turbulent flow: A review. Philos. Trans. A Math. Phys. Eng. Sci. 368 (1929):4775–806.
- Fu, S., W. Leung, and C. Y. Chao. 2014. Detachment of droplets in a fully developed turbulent channel flow. Aerosol Sci. Technol. 48 (9):916–23. doi:10.1080/02786826.2014.938801.
- Gao, N., J. Niu, Q. He, T. Zhu, and J. Wu. 2012. Using RANS turbulence models and Lagrangian approach to predict particle deposition in turbulent channel flows. Build. Environ. 48:206–14. doi:10.1016/j.buildenv.2011.09.003.
- Hosseini, S., and H. V. Tafreshi. 2010. 3-D simulation of particle filtration in electrospun nanofibrous filters. Powder Technol. 201 (2):153–60. doi:10.1016/j.powtec.2010.03.020.
- Hussein, T., J. Smolik, V.-M. Kerminen, and M. Kulmala. 2012. Modeling dry deposition of aerosol particles onto rough surfaces. Aerosol Sci. Technol. 46 (1):44–59. doi:10.1080/02786826.2011.605814.
- Joubert, A., J. C. Laborde, L. Bouilloux, S. Chazelet, and D. Thomas. 2011. Modelling the pressure drop across HEPA filters during cake filtration in the presence of humidity. Chem. Eng. J. 166 (2):616–23. doi:10.1016/j.cej.2010.11.033.
- Lai, A. C., M. A. Byrne, and A. J. Goddard. 1999. Measured deposition of aerosol particles on a two-dimensional ribbed surface in a turbulent duct flow. J. Aerosol Sci. 30 (9):1201–14. doi:10.1016/S0021-8502(99)00021-X.
- Lai, A. C., M. A. Byrne, and A. J. Goddard. 2001. Aerosol deposition in turbulent channel flow on a regular array of three-dimensional roughness elements. J. Aerosol Sci. 32 (1):121–37. doi:10.1016/S0021-8502(00)00051-3.
- Lai, A. C., and F. Chen. 2006. Modeling particle deposition and distribution in a chamber with a two-equation Reynolds-averaged Navier–Stokes model. J. Aerosol Sci. 37 (12):1770–80. doi:10.1016/j.jaerosci.2006.06.008.
- Lai, A. C., and W. Nazaroff. 2005. Supermicron particle deposition from turbulent chamber flow onto smooth and rough vertical surfaces. Atmos. Environ. 39 (27):4893–900. doi:10.1016/j.atmosenv.2005.04.036.
- Lu, H., and L. Lu. 2016. CFD investigation on particle deposition in aligned and staggered ribbed duct air flows. Appl. Therm. Eng. 93:697–706. doi:10.1016/j.applthermaleng.2015.10.030.
- McQuiston, F. C., Parker, J. D. and Spitler, J. D. 2004. Heating, ventilating, and air conditioning: analysis and design. 6th ed. New Jersey: John Wiley & Sons.
- Mehel, A., A. Tanière, B. Oesterlé, and J.-R. Fontaine. 2010. The influence of an anisotropic Langevin dispersion model on the prediction of micro-and nanoparticle deposition in wall-bounded turbulent flows. J. Aerosol Sci. 41 (8):729–44. doi:10.1016/j.jaerosci.2010.04.011.
- Mehta, R. D., and P. Bradshaw. 1979. Design rules for small low speed wind tunnels. Aeronaut. J. 83:443–53.
- Ounis, H., G. Ahmadi, and J. B. McLaughlin. 1991. Brownian diffusion of submicrometer particles in the viscous sublayer. J. Colloid Interface Sci. 143 (1):266–77. doi:10.1016/0021-9797(91)90458-K.
- Pope, S. B. 2001. Turbulent flows. 1st ed. Cambridge: Cambridge University Press.
- Shaughnessy, R. J., E. Levetin, J. Blocker, and K. L. Sublette. 1994. Effectiveness of portable indoor air cleaners: Sensory testing results. Indoor Air 4 (3):179–88. doi:10.1111/j.1600-0668.1994.t01-1-00006.x.
- Sippola, M. R., and W. W. Nazaroff. 2004. Experiments measuring particle deposition from fully developed turbulent flow in ventilation ducts. Aerosol Sci. Technol. 38 (9):914–25. doi:10.1080/027868290507213.
- Tao, Y., K. Inthavong, and J. Tu. 2017. A numerical investigation of wind environment around a walking human body. J. Wind Eng. Ind Aerodyn. 168:9–19. doi:10.1016/j.jweia.2017.05.003.
- Thomas, D., P. Penicot, P. Contal, D. Leclerc, and J. Vendel. 2001. Clogging of fibrous filters by solid aerosol particles experimental and modelling study. Chem. Eng. Sci. 56 (11):3549–61. doi:10.1016/S0009-2509(01)00041-0.
- Tian, L., and G. Ahmadi. 2007. Particle deposition in turbulent duct flows—Comparisons of different model predictions. J. Aerosol Sci. 38 (4):377–97. doi:10.1016/j.jaerosci.2006.12.003.
- Wang, H.-C., and G. Kasper. 1991. Filtration efficiency of nanometer-size aerosol particles. J. Aerosol Sci. 22 (1):31–41. doi:10.1016/0021-8502(91)90091-U.
- Whicker, J. J., P. T. Wasiolek, and R. A. Tavani. 2002. Influence of room geometry and ventilation rate on airflow and aerosol dispersion: Implications for worker protection. Health Phys. 82 (1):52–63. doi:10.1097/00004032-200201000-00007.
- Xu, H., S. C. Fu, W. T. Leung, T. W. Lai, and C. Y. H. Chao. 2020. Enhancement of submicron particle deposition on a semi-circular surface in turbulent flow. Indoor Built Environ. 29 (1):101–16. doi:10.1177/1420326X19853862.
- Zhang, Z., and Q. Chen. 2009. Prediction of particle deposition onto indoor surfaces by CFD with a modified Lagrangian method. Atmos. Environ. 43 (2):319–28. doi:10.1016/j.atmosenv.2008.09.041.
- Zhao, B., C. Chen, and A. C. Lai. 2011. Lagrangian stochastic particle tracking: Further discussion. Aerosol Sci. Technol. 45 (8):901–2. doi:10.1080/02786826.2011.570382.
- Zhao, B., and J. Wu. 2006a. Modeling particle deposition from fully developed turbulent flow in ventilation duct. Atmos. Environ. 40 (3):457–66. doi:10.1016/j.atmosenv.2005.09.043.
- Zhao, B., and J. Wu. 2006b. Modeling particle deposition onto rough walls in ventilation duct. Atmos. Environ. 40 (36):6918–27. doi:10.1016/j.atmosenv.2006.06.015.