
Abstract
Respiratory droplets are bioaerosols that originate from the respiratory tract. Knowing their deposition characteristics during exhalation would facilitate the understanding of the source of large respiratory droplets and their importance in the spread of respiratory infectious diseases. In this study, computational fluid dynamics is used to simulate the motion and deposition of droplets released from either trachea or bronchi in a realistic reconstruction of the human respiratory tract. Influences of airflow structures and locations of droplet generation on droplet deposition are studied, and droplets with diameters between 1 and 50 µm are examined. The deposition of droplets is found to be influenced mainly by the droplet diameter and the flow rate of exhalation. The number of droplets released from the trachea or bronchi that can escape into the environment decreases as the flow rate increases. When the flow rate is low (10 L/min), the critical diameter of droplets generated in the lower respiratory system that can escape into the air is approximately 12 µm, but this diameter is approximately 5 µm when the flow rate is medium (30 to 60 L/min) or large (90 L/min). The larynx is the dominant site of deposition for droplets smaller than the critical diameter, while trachea and bronchus are more important locations that account for the deposition of larger droplets. This study indicates that the lower respiratory tract is an important source of fine droplets (<5 µm) in indoor environments, and larger droplets probably originate from the upper respiratory tract, which needs further investigation.
Copyright © 2020 American Association for Aerosol Research
EDITOR:
1. Introduction
Respiratory activities, including normal breathing, speaking, coughing, and sneezing, produce large numbers of droplets in the submicron to millimeter range. These droplets and droplet nuclei are potential carriers of pathogens that cause respiratory diseases (Chao et al. Citation2009; Asadi et al. Citation2020). Considerable morbidity and mortality have been caused by respiratory diseases in this century, such as severe acute respiratory syndrome (Yu et al. Citation2004) and Middle East respiratory syndrome (Zumla, Hui, and Perlman Citation2015). Seasonal epidemics of influenza kill between 250,000 and 500,000 people worldwide each year (World Health Organization Citation2008). In late 2019, an acute respiratory tract infection named coronavirus disease 2019 (COVID-19) outbroke in China, and as of 20 February 2020, a cumulative total of 75,465 COVID-19 cases were reported in China (World Health Organization Citation2020). At present, the coronavirus COVID-19 is affecting 185 countries and territories around the world, WHO characterizes COVID-19 as a pandemic on 11 March 2020.
A number of studies have examined the number and size distribution of respiratory droplets and their evaporation, diffusion, and subsequent exposure by occupants in indoor environments. Between 1 and 320 droplets are exhaled per liter of air while breathing, between 4 and 600 while speaking, and between 24 and 23,600 while coughing (Edwards et al. Citation2004; Gupta, Lin, and Chen Citation2009). The droplet concentration is greatest at the submicron level, followed by 1 to 3 µm, and the concentration is lowest at 10 and 100 µm, depending on the mode of expiratory activity (Morawska et al. Citation2009; Johnson et al. Citation2011). After the droplets escape the respiratory tract into the environment, they evaporate, disperse, or become deposited. Droplets evaporate into droplet nuclei approximately one third their original size, and the evaporation process is significantly influenced by the indoor temperature and humidity (Liu et al. Citation2015). Human exposure to exhaled droplets and droplet nuclei was systematically examined between two standing thermal manikins in a full-scale laboratory experiment and computational fluid dynamics (CFD) simulation, which revealed transmission in the vicinity of near-source patients, including large droplet transmission and short-range airborne transmission (Liu et al. Citation2017).
Although investigations of droplets in indoor environments have been rather abundant, the specific route of transmission of respiratory infectious diseases such as influenza and COVID-19 has yet to be determined. In addition to droplet exposure, this complicated transmission process is also affected by the virus content in the respiratory droplets (Wei and Li Citation2016; Drossinos and Stilianakis Citation2020). Direct measurement of the virus content in droplets has shown that droplets with an aerodynamic size of less than 5 µm are important carriers of pathogens such as influenza virus and tuberculosis virus, which provides strong evidence for the airborne transmission of these diseases. Lindsley et al. (Citation2015) designed and built the tornado three-stage sampler and used it in volunteer experiments to show that droplets larger than 4 µm, between 1 and 4 µm, and smaller than 1 µm carried 35%, 23%, and 42% of the total influenza viruses, respectively. Milton et al. (Citation2013) set up a breathing air collection device in which the exhaled air flowed through a horizontal tapered pipe and into the first impact sampler, and the remaining droplets were collected by the second impact sampler after a condensation process. Their results showed that droplets smaller than 5 µm carried approximately 8.8 times more influenza viruses than droplets larger than 5 µm.
Studies of the mechanism and location of respiratory droplet production also help to explain the droplet size distribution and virus content and to determine the specific route of transmission of respiratory infectious diseases. Three droplet production mechanisms are widely accepted: bronchiolar film rupture, which produces submicron droplets during normal breathing (Milton et al. Citation2013); vocal fold production and coughing, which produces micron droplets from the mucosal layer of the larynx and trachea with the action of shear-induced surface-wave instability (Hasan, Lange, and King Citation2010); and the production of large droplets (≥100 µm) during speaking or coughing (Morawska Citation2006). The mouth tends to be the source of large droplets, but they contain far fewer pathogens than the lower respiratory tract. Johnson et al. (Citation2011) systematically sampled the number and size distribution of exhaled droplets and deduced the site at which they were generated. However, such studies cannot show the critical size of droplets released into the environment for each location or mechanism and do not contribute data on the formation and deposition of droplets in the respiratory tract during exhalation, which cannot be directly verified. Previous experiments have involved volunteers gargling with a solution of edible pigment, the use of slides to collect droplets generated during talking or coughing, and observation under a microscope (Johnson et al. Citation2011). However, the minimum size of droplets was 20 µm (all droplets collected contained the pigment), and the use of pigment changed the physical properties of the mucosa, thus affecting the number and size distribution of the droplets produced.
Accordingly, it is vital to study the mechanism of respiratory droplet deposition during exhalation, which could facilitate our understanding of the source of large droplets and their importance in the spread of respiratory infectious diseases. In this study, computational fluid dynamics (CFD) modeling is utilized, which is efficient and effective in the study of droplet deposition inside respiratory tracts. Longest and Vinchurkar (Citation2009) investigated the deposition of respiratory aerosols during steady exhalation using double bifurcation models of respiratory generations G3–G5 and G7–G9. They proposed correlations that predicted branch-averaged deposition efficiency as a function of both Stokes and Dean numbers. Under full breathing profiles, Verbanck et al. (Citation2011) investigated the aerosol deposition efficiency in a realistic upper airway geometry through experiment and numerical simulation. Their results showed that the deposition efficiency curves of expiratory and inspiratory were almost identical, although there was a considerable difference in the deposition hotspot in the upper airway model during expiration and inspiration, with preferential deposition in oral and pharyngeal compartments, respectively. Huang and Zhang (Citation2011) simulated transient airflow patterns and particle deposition during both inspiratory and expiratory processes in the realistic human upper respiratory tract model. They found that the transient deposition fraction was strongly depend on breathing flow rate and particle diameter.
In this study, CFD is used to numerically investigate the motion and deposition of droplets that originate in the trachea or bronchus in the respiratory tract during exhalation. The influence of turbulence and jet flow caused by the complex respiratory tract structure on droplet deposition is studied to obtain a complete droplet deposition curve along the respiratory tract. Although the large droplets produced in the bronchi, trachea, and other structures carry viruses, they are easily deposited in the respiratory tract and rarely escape into the indoor environment. In addition, the virus content of large droplets that originate in the oral cavity is very small and thus plays a negligible role in respiratory disease transmission. This article thus addresses the key question of the critical droplet size via the study of droplet deposition characteristics.
2. Methods
2.1. Geometry
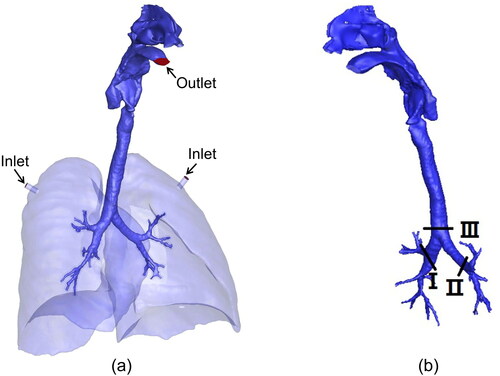
A realistic model of the human respiratory tract was reconstructed from the computed tomography scans of a healthgy male subject (Hvelplund et al. Citation2020). Briefly, the scans were obtained using a CTI whole body scanner (GE medical systems) with the subject in a supine position, and the exported geometry was further improved with ANSYS SpaceClaim 3 D modeling software by surface smoothing and deletion of duplicated facets. The model () includes the mouth, nasal cavity, pharynx, larynx, trachea, and bronchi up to the 4th generation. As there are 16 irregular bronchial inlets at the 4th generation, a lung pleural cavity was added to simplify the boundary conditions.
Figure 1. (a) Realistic model of the human respiratory tract, and (b) release locations of droplets.
2.2. Numerical methods
Airflow in the respiratory tract is assumed to be steady, incompressible, and isothermal. The continuity and momentum equations of the flow are solved with the shear stress transmission (SST) k-ω model (Menter, Langtry, and Völker Citation2006), which predicts the turbulent kinetic energy k more accurately in the laminar sublayer and thus makes the difference between isotropic and anisotropic eddy assumptions limited (Chen et al. Citation2017). After the velocity field is converged, the Lagrangian approach is used to calculate droplet motion and deposition. Droplets are individually tracked until they escape the flow field or are trapped by the respiratory tract surfaces. The motion of a droplet obeys the time integral of Newton’s second law, where only drag force, gravitional force and buoyancy force are considerd as the studied droplets are over 1 µm (Kiasadegh et al. Citation2020) . When the airflow is in a turbulent regime, random velocity fluctuations influence the droplet motion together with the averaged velocity field. The most well-known discrete random walk (DRW)model was introduced by Gosman and Loannides (Citation1983) and embedded in Fluent code to describe random velocities. In this model, the turbulent dispersion of droplets is modeled as a succession of interactions between a droplet and eddies that have finite lengths and lifetimes.
2.3. Flow solver and boundary conditions
An unstructured grid is applied to discretize the volume of the complex geometric model through ICEM CFD 19.2 (ANSYS, USA). Because the airflow structure in the boundary layer region differs from that in the bulk region, the impact of the near-wall surface on droplet motion and deposition is considered, and the grid near the wall is sufficiently refined until the dimensionless wall distance y + falls below 1.0 at the highest flow rate of 90 L/min (Simon, Timothy, and Steve Citation2007; Hvelplund et al. Citation2020). Because prism cells are adept at solving near-wall gradients, eight layers of prism elements are added to the boundary of the model. Based on grid independence verification implemented in our previous study (Hvelplund et al. Citation2020), we use a computing mesh with approximately 20 million elements.
The governing equations for airflow and droplet trajectory in the human respiratory tract are solved with the commercial software ANSYS Fluent 19.2 (ANSYS, USA). The continuous phase is calculated with the Euler method, and the discrete phase is calculated with the Lagrangian method. In the Reynolds-averaged Navier–Stokes equation, except for the pressure, the two-order upwind scheme is adopted, and the DRWmodel is used to simulate the influence of turbulence on the trajectory of the discrete phase.
A steady exhalation airflow regime is assumed, and flow rates of 10, 30, 60, and 90 L/min are used to simulate the normal expiration rates that occur during light to heavy activities. For steady-state simulations, the inlets, located at the plugs near the top of the lungs, are defined as the velocity inlet with a turbulent intensity of 5%. The outlet at the mouth is defined as the pressure outlet, and the boundary conditions of the other surfaces are all defined as wall. The airflow-droplet interaction is considered a one-way coupling, and the effects of the droplets on the airflow filed are disregarded. This study also ignores droplet-droplet interactions and droplet evaporation. The aerodynamic diameters of the droplets are set to 1, 2, 3, 4, 5, 10, 20, and 50 µm, and the density of each droplet is 1000 kg/m3. In this study, the droplets are released from two locations: one in sections I and II at the 1st generation of the bronchus, and the other in section III at the bottom of the trachea (as illustrated in ), and the droplets are assumed to be uniformly distributed throughout the cross section and their initial velocities are equal to those of the airflow. The independence of the results on the number of droplets released is validated by comparing the results of the various droplets.
2.4. Validation
The choice of turbulence models has a great effect on the outcome of the simulation, so a suitable and thorough validation study is necessary. When no validation data are available for the flow problem under study, researchers should use experimental datasets obtained for similar flow problems, which is called sub-configuration validation (Hooff, Nielsen, and Li Citation2018). In this study, we have no validation data for the realistic respiratory tract model; therefore, we conduct an indirect validation based on a highly idealized mouth-throat model (shown in ). The corresponding experimental data were obtained by Zhang, Finlay, and Matida (Citation2004).
Figure 2. (a) Scheme of highly idealized mouth-throat, (b) comparison of different methods in predicting near-wall k values along the red line in (a), and (c) comparison of experimental data and numerical calculation results on particle deposition fractions.
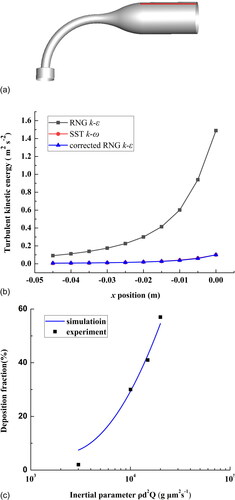
The unstructured grid of the respiratory tract model is constructed with tetrahedral cells. Ten layers of prism elements are added to the model’s boundary. We obtain a computing mesh with approximately 4.1 million elements with y+ below 1.0. The SST k-ω model is used to simulate the flow field. The initial conditions and boundary conditions are all consistent with those set by Zhang, Finlay, and Matida (Citation2004): the flow rate is 30 L/min, and the mouth is set as a pressure outlet.The k value near wall obtained with SST k-ω model was approximate to that calculated under RNG k-ε model and corrected by near wall correction proposed by Matida et al. (Citation2004) (). shows the comparison between the experimental data and the numerical calculation results on particle deposition. The simulated results agree well with the experimental results, which shows that the unstructured grid and the turbulence model we adopt are appropriate.
3. Results
3.1. Airflow structure
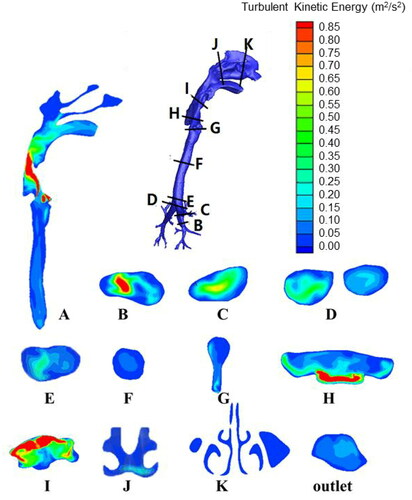
and show the contours of the velocity magnitude and turbulent intensity, respectively, at various sections for a breathing rate of 30 L/min. The longitudinal section A is the approximate symmetrical plane of the respiratory tract model, and sections B through K are the cross-sections of key parts of the respiratory tract. Section B shows that the velocity and turbulence kinetic energy of the airflow are relatively high when the airflow enters the bronchi; the velocity is approximately 5 m/s in the central position. As the airflow moves upwards, the velocity decreases to approximately 3 m/s due to the gradual increase in the diameter of the bronchi (section C). As seen in sections D and E, at the intersection of the left and right bronchi, the flow direction of the airflow changes suddenly. However, the angle of change is not very large, and the area of the flow passage also increases; therefore, the flow velocity and turbulent kinetic energy of the airflow do not change much. The geometric shape of the airflow is relatively regular in the trachea, so the velocity and turbulent kinetic energy do not fluctuate greatly, and the velocity remains approximately 3 m/s (section A and F). At section G, the cross-sectional area of the flow passage suddenly decreases, so the airflow here turns into a jet flow (the so-called “laryngeal jet”), which results in a sudden increase in velocity to greater than 5 m/s, whereas the turbulence kinetic energy shows no significant change. The changes of velocity and turbulent kinetic energy in section A are not synchronized at the larynx; the latter reaches peak values at sections H and I due to the impact of the laryngeal jet on the respiratory tract wall and the vortices generated from the complex geometry. The velocity and turbulent kinetic energy both decrease as the airflow enters the pharynx. Their values in the oral cavity remain an order of magnitude higher than those in the nasal cavity, and the outlet velocity at the mouth is approximately 2 m/s.
Figure 3. Velocity magnitude at various sections for breathing rate of 30 L/min.
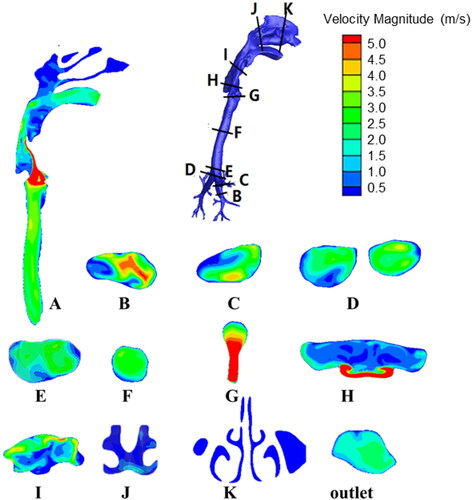
Figure 4. Turbulent kinetic energy at various sections for breathing rate of 30 L/min.
The trachea and bronchi have been considered important sources of droplet formation (Johnson and Morawska Citation2009; Hasan, Lange, and King Citation2010; Morawska Citation2006; Hvelplund et al. Citation2020). In this study, droplets are released from the trachea and bronchi to investigate the impact of droplet origin. The droplet motion and deposition characteristics are studied at flow rates of 10, 30, 60, and 90 L/min.
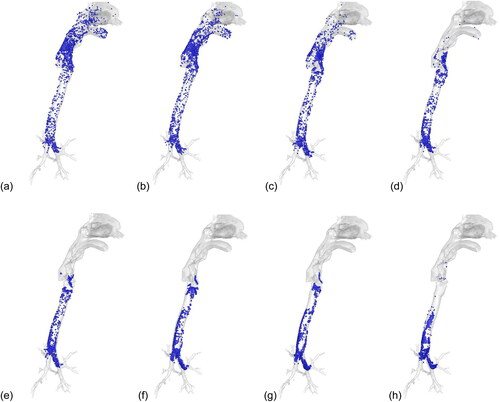
Using the breathing condition of 30 L/min for an example, shows the deposition patterns for the droplets released from the 1st generation of bronchi. The 1- and 2-µm droplets are distributed throughout the respiratory tract, whereas the medium-sized droplets (5 to 20 µm) are deposited mainly below the larynx, and large droplets (50 µm) are deposited almost entirely in the trachea and bronchi.
Figure 5. Deposition locations for droplets released from bronchi (30 L/min). (a) 1 µm, (b) 2 µm, (c) 3 µm, (d) 4 µm, (e) 5 µm, (f) 10 µm, (g) 20 µm, and (h) 50 µm.
The deposition characteristics of droplets in various parts of the respiratory tract are fully revealed in . For the main bronchi (1st generation), the deposition of small droplets (<5 µm) is negligible at a low expiration flow rate (10 L/min). As the flow rate increases, the laminar flow transforms into turbulent flow, which causes a slight increase in the deposition fraction. Droplets larger than 5 µm tend to be deposited in the main bronchi, and the deposition fraction increases with the flow rate. Under the investigated scenario, 2% to 28% of 5-µm droplets and 5% to 64% of 10-µm droplets are deposited in the main bronchi. The motion and deposition of large droplets (>50 µm) are dominated by inertial impaction and gravitational settling, and approximately 80% of droplets are deposited in the bronchi at various breathing intensities. Gravitational settling and inertial impaction at the bronchus bifurcation are the most important deposition mechanisms for large droplets.
Figure 6. Local deposition of droplets released from bronchi with different breathing conditions. (a) 10 L/min, (b) 30 L/min, (c) 60 L/min, and (d) 90 L/min.
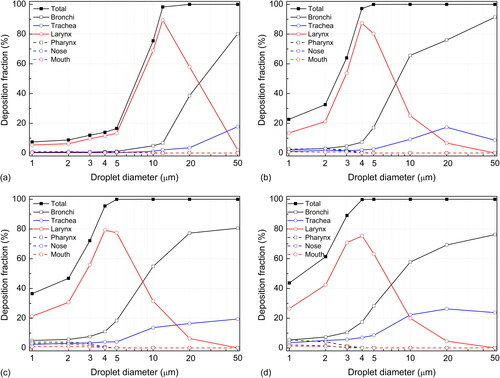
The trachea is less important than the main bronchi in trapping droplets that originate in the lung. The droplet deposition fraction increases as the breathing density increases; however, the maximum deposition fraction for all droplets is below 30%. Due to the smaller air passage and the relatively complicated geometry of the bronchi, most large droplets are deposited in the bronchi before they reach the trachea.
In the larynx, the sudden change in geometry causes a “laryngeal jet” (), which results in a sharp increase in turbulent kinetic energy () and enhances the deposition of droplets of various sizes in the larynx. From , it is obvious that the deposition fraction in the larynx increases as the droplet diameter grows, after which it reaches a peak and then decreases. Droplets larger than the peak value are deposited mostly in the bronchi or trachea. Interpolation calculation shows that the peak deposition corresponds to 12, 4.5, 4.5, and 4 µm, respectively, with the four expiration flow rates (10, 30, 60, and 90 L/min), and the peak deposition values vary from 60% to 85%.
and show that only droplets smaller than 12 µm (at 10 L/min) or 5 µm (at 30 to 90 L/min) can reach the oral cavity and nasal cavity. Because the oral breathing condition is investigated, the number of droplets that enter the nasal cavity is fairly limited. Hence, despite the complex geometry of the nasal cavity and the strong filtering effects of nose hairs, the deposition fraction in the nasal cavity is below 5%. The geometry of the oral cavity is simpler than that of the larynx, and there is no strong turbulence in the mouth, so most droplets that enter the oral cavity can escape into the environment.
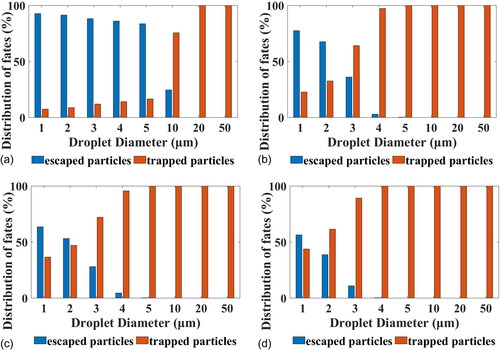
shows the proportion of captured and escaped droplets released from the bronchi at various breathing intensities. At the lowest flow rate of 10 L/min, more than 80% of small droplets (<5 µm) can escape into the environment; the critical diameter of droplets that are deposited completely within the respiratory tract lies between 10 and 20 µm, and the critical diameter calculated through interpolation is approximately 12 µm. At higher flow rates (30 to 90 L/min), the critical droplets are between 4 and 5 µm, and the number of escaped droplets decreases as the flow rate increases. The larynx is the key location inside the respiratory tract that determines the critical value ().
Figure 7. Fraction of captured and escaped droplets released from bronchi at breathing rates of (a) 10 L/min, (b) 30 L/min, (c) 60 L/min, and (d) 90 L/min.
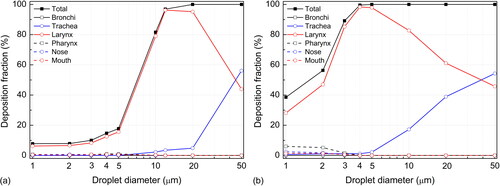
Because viruses related to respiratory infections mainly invade the ciliated columnar epithelium, they mainly duplicate in the larynx, trachea, bronchi, and lungs (Li and Wang Citation2014). Here, virus-laden droplets are easily generated in an infected individual. The above results have indicated that neither droplets larger than 10 µm below the main bronchi nor droplets larger than 5 µm under expiration flow rates above 30 L/min can escape into the environment. The trachea has been regarded as an important droplet source due to the film instability mechanism, especially for large droplets (Hasan, Lange, and King Citation2010). However, the trachea itself and the larynx easily trap large droplets, as further revealed in . In addition to the larynx, the trachea becomes an important deposition site for large droplets, accounting for approximately 50% of total deposition. The critical sizes of the escaped droplets are 14 µm at 10 L/min, 6 µm at 30 L/min, 5 µm at 60 L/min, and 5 µm at 90 L/min for droplets released from the trachea, which are slightly larger than in the above scenarios in which droplets originate from the bronchi.
Figure 8. Local deposition of droplets released from trachea at flow rates of (a) 10 L/min and (b) 90 L/min.
4. Discussions and limitations
Experimental measurements on volunteers have demonstrated that droplets with diameters as large as 100 µm can be released from the respiratory tract into the indoor environment (Chao et al. Citation2009; Gupta, Lin, and Chen Citation2009; Fabian et al. Citation2008). The atomization mechanism in the oral cavity produces large droplets, but the oral cavity has very few viruses (Morawska Citation2006). Milton et al. (Citation2013) examined human exhaled breath for 30 min with an aerosol collection system (normal breathing and 30 coughs for each test). Droplets smaller than 5 µm contained an average of 8.8-fold more viral copies than droplets larger than 5 µm, and a maximum of 2.9 × 10⁴ viral copies were detected for a single test. Taking evaporation into consideration, what Milton et al. (Citation2013) collected were probably droplet nuclei, and droplet nuclei of 5 µm correspond to droplets of 15 µm immediately after exhalation (Wei and Li Citation2015). The question then concerns the source of these virus-laden coarse droplets. A certain percentage of large droplets produced in the trachea, bronchi, or lower airways might escape, as the flow rate for realistic breathing or coughing can fall below 10 L/min at the end of expiration. Transient respiratory activity is more complex than the investigated scenario of steady exhalation, and requires further exploration. Another probable source of these virus-laden coarse droplets is the pharynyx and/or larynx. It has been demonstrated that droplets or droplet nuclei larger than 10 µm are readily collected during human speech, and more droplets are produced with a greater sound amplitude (Asadi et al. Citation2019). The high air velocity due to the laryngeal jet () and vibration of the vocal folds can both contribute to the process of droplet formation. As indicated by Wölfel et al. (Citation2020), SARS-CoV-2 is readily replicated in the throat and COVID-19 patients have high virus shedding at the early stage of infection, which might account for the high transmissibility of the disease.
This study uses a model of a real human respiratory tract. A careful grid dependency test and turbulence model validation were performed to ensure a realistic prediction. However, the inlet and outlet conditions are simplified, and steady expiration is assumed. Droplet deposition characteristics under a realistic flow condition, for example, a sinusoidal function of flow rate with time for normal breathing and combined gamma-probability-distribution functions for coughing, are probably different and will be investigated in our future study. Adoption of the lung pleural cavity simplified the inlet boundary conditions, but lung inflation is difficult to model and airflow distribution in bronchus might deviate from realistic situations. In addition, respiratory tract geometries vary from person to person, and the geometry might have a non-negligible influence on droplet deposition. We will consider models produced based on different subjects in a future study to quantify the differences in the respiratory tract models of children, teenagers, adults, and older adults.
5. Conclusions
The motion and deposition of droplets in a human respiratory tract model are numerically studied under steady flow conditions. The droplet deposition characteristics are determined mainly by the droplet diameter and the flow rate of coughing. When the flow rate is low (10 L/min), the maximum critical diameter of the droplets originating trachea or bronchus that can escape into the environment is approximately 12 µm, while the critical diameters are all close to 5 µm when the flow rate is medium (30 or 60 L/min) or intense (90 L/min). Deposition of droplets that cannot escape the respiratory tract is concentrated at several sites. The bronchi and trachea easily trap large droplets, but the larynx is the main deposition site for droplets near the critical diameter. Realistic breathing functions and individual differences in respiratory tract geometry will be considered in a future study for better prediction of droplet deposition. The larynx may be the source of relatively larger virus-laden droplets detected in human exhaled breath, which require further investigation.
Funding
This study is financially supported by the National Natural Science Foundation of China (Grant No. 51808488 and 81872672), the Fundamental Research Funds for the Central Universities, and the HKU-Zhejiang Institute for Research and Innovation (HKU-ZIRI) Seed Funding Program.
References
- Asadi, S., A. S. Wexler, C. D. Cappa, S. Barreda, N. M. Bouvier, and W. D. Ristenpart. 2019. Aerosol emission and superemission during human speech increase with voice loudness. Sci. Rep. 9 (1):2348. doi:https://doi.org/10.1038/s41598-019-38808-z.
- Asadi, S., N. Bouvier, A. S. Wexler, and W. D. Ristenpart. 2020. The coronavirus pandemic and aerosols: Does COVID-19 transmit via expiratory particles? Aerosol. Sci. Technol. 54 (6):1–638. doi:https://doi.org/10.1080/02786826.2020.1749229.
- Chao, C. Y. H., M. P. Wan, L. Morawska, G. R. Johnson, Z. D. Ristovski, M. Hargreaves, K. Mengersen, S. Corbett, Y. Li, X. Xie, et al. 2009. Characterization of expiration air jets and droplet size distributions immediately at the mouth opening. J. Aerosol. Sci. 40 (2):122–33. doi:https://doi.org/10.1016/j.jaerosci.2008.10.003.
- Chen, X., Y. Feng, W. Zhong, and C. Kleinstreuer. 2017. Numerical investigation of the interaction, transport and deposition of multicomponent droplets in a simple mouth-throat model. J. Aerosol Sci. 105:108–27. doi:https://doi.org/10.1016/j.jaerosci.2016.12.001.
- Drossinos, Y., and N. I. Stilianakis. 2020. What aerosol physics tells us about airborne pathogen transmission. Aerosol. Sci. Technol. 54 (6):639–43. doi:https://doi.org/10.1080/02786826.2020.1751055.
- Edwards, D. A., J. C. Man, P. Brand, J. P. Katstra, K. Sommerer, H. A. Stone, E. Nardell, and G. Scheuch. 2004. Inhaling to mitigate exhaled bioaerosols. Proc. Natl. Acad. Sci. USA. 101 (50):17383–8. doi:https://doi.org/10.1073/pnas.0408159101.
- Fabian, P., J. J. McDevitt, W. H. DeHaan, R. O. P. Fung, B. J. Cowling, K. H. Chan, G. M. Leung, and D. K. Milton. 2008. Influenza virus in human exhaled breath: An observational study. PLoS One 3 (7):e2691. doi:https://doi.org/10.1371/journal.pone.0002691.
- Gosman, A. D., and E. Loannides. 1983. Aspects of computer simulation of liquid fuelled combustors. Energy J. 7 (6):482–90. doi:https://doi.org/10.2514/3.62687.
- Gupta, J. K., C. H. Lin, and Q. Chen. 2009. Flow dynamics and characterization of a cough. Indoor Air. 19 (6):517–25. doi:https://doi.org/10.1111/j.1600-0668.2009.00619.x.
- Hasan, A. M. D., C. F. Lange, and M. L. King. 2010. Effect of artificial mucus properties on the characteristics of airborne bioaerosol droplets generated during simulated coughing. J. Non-Newtonian Fluid Mech. 165 (21–22):1431–41. doi:https://doi.org/10.1016/j.jnnfm.2010.07.005.
- Hooff, T. V., P. V. Nielsen, and Y. Li. 2018. Computational fluid dynamics predictions of non-isothermal ventilation flow-How can the user factor be minimized? Indoor Air. 28 (6):866–80. doi:https://doi.org/10.1111/ina.12492.
- Huang, J., and L. Zhang. 2011. Numerical simulation of micro-particle deposition in a realistic human upper respiratory tract model during transient breathing cycle. Particuology 9 (4):424–31. doi:https://doi.org/10.1016/j.partic.2011.02.004.
- Hvelplund, H. M., L. Liu, M. K. Frandsen, H. Qian, P. V. Nielsen, Y. Dai, L. Wen, and Y. Zhang. 2020. Numerical investigation of the lower airway exposure to indoor particulate contaminants. Indoor Built Environ. 29 (4):575–86. doi:https://doi.org/10.1177/1420326X19874856.
- Johnson, G. R., and L. Morawska. 2009. The mechanism of breath aerosol formation. J. Aerosol. Med. Pulm. Drug Deliv. 22 (3):229–37. doi:https://doi.org/10.1089/jamp.2008.0720.
- Johnson, G. R., L. Morawska, Z. D. Ristovski, M. Hargreaves, K. Mengersen, C. Y. H. Chao, M. P. Wan, Y. Li, X. Xie, D. Katoshevski, et al. 2011. Modality of human expired aerosol size distributions. J. Aerosol. Sci. 42 (12):839–51. doi:https://doi.org/10.1016/j.jaerosci.2011.07.009.
- Kiasadegh, M., H. Emdad, G. Ahmadi, and O. Abouali. 2020. Transient numerical simulation of airflow and fibrous particles in a human upper airway model. J. Aerosol. Sci. 140:105480. doi:https://doi.org/10.1016/j.jaerosci.2019.
- Lindsley, W. G., J. D. Noti, F. M. Blachere, R. E. Thewlis, S. B. Martin, S. Othumpangat, B. Noorbakhsh, W. T. Goldsmith, A. Vishnu, J. E. Palmer, et al. 2015. Viable influenza A virus in airborne particles from human coughs. J. Occup. Environ. Hyg. 12 (2):107–13. DOI: https://doi.org/10.1080/15459624.2014.97313.
- Li, L., and Y. Wang. 2014. Infectious diseases, 89–91. Beijing: People’s Medical Publishing House.
- Liu, L., J. Wei, Y. Li, and A. Ooi. 2015. Evaporation and dispersion of respiratory droplets from coughing. Indoor Air. 27 (1):179–90. doi:https://doi.org/10.1111/ina.12297.
- Liu, L., Y. Li, P. V. Nielsen, J. Wei, and R. L. Jensen. 2017. Short-range airborne transmission of expiratory droplets between two people. Indoor Air. 27 (2):452–62. doi:https://doi.org/10.1111/ina.12314.
- Longest, P. W., and S. Vinchurkar. 2009. Inertial deposition of aerosols in bifurcating models during steady expiratory flow. J. Aerosol. Sci. 40 (4):370–8. doi:https://doi.org/10.1016/j.jaerosci.2008.11.007.
- Matida, E. A., Finlay, W. H., Lange, C. F., Grgic, B. 2004. Improved numerical simulation of aerosol deposition in an idealized mouth–throat. J. Aerosol. Sci. 35:1–19. doi: https://doi.org/10.1016/s0021-8502(03)00381-1.
- Menter, F. R., R. Langtry, and S. Völker. 2006. Transition modelling for general purpose CFD codes. Flow. Turbulence Combust. 77 (1–4):277–303. doi:https://doi.org/10.1007/s10494-006-9047-1.
- Milton, D. K., M. P. Fabian, B. J. Cowling, M. L. Grantham, and J. J. McDevitt. 2013. Influenza virus aerosols in human exhaled breath: particle size, culturability, and effect of surgical masks. PLoS Pathog. 9 (3):e1003205. doi:https://doi.org/10.1371/journal.ppat.1003205.
- Morawska, L. 2006. Droplet fate in indoor environments, or can we prevent the spread of infection? Indoor Air. 16 (5):335–47. doi:https://doi.org/10.1111/j.1600-0668.2006.00432.x.
- Morawska, L., G. R. Johnson, Z. D. Ristovski, M. Hargreaves, K. Mengersen, S. Corbett, C. Y. H. Chao, Y. Li, and D. Katoshevski. 2009. Size distribution and sites of origin of droplets expelled from the human respiratory tract during expiratory activities. J. Aerosol Sci. 40 (3):256–69. doi:https://doi.org/10.1016/j.jaerosci.2008.11.002.
- Simon, P., F. Timothy, and P. Steve. 2007. Towards quantitative prediction of aerosol deposition from turbulent flows. J. Aerosol. Sci. 39 (2):99–112. doi:https://doi.org/10.1016/j.jaerosci.2007.10.002.
- Verbanck, S., H. S. Kalsi, M. F. Biddiscombe, V. Agnihotri, B. Belkassem, C. Lacor, and O. S. Usmani. 2011. Inspiratory and expiratory aerosol deposition in the upper airway. Inhal. Toxicol. 23 (2):104–11. doi:https://doi.org/10.3109/08958378.2010.547535.
- Wei, J., and Y. Li. 2015. Enhanced spread of expiratory droplets by turbulence in a cough jet. Build. Environ. 93:86–96. doi:https://doi.org/10.1016/j.buildenv.2015.06.018.
- Wei, J., and Y. Li. 2016. Airborne spread of infectious agents in the indoor environment. Am. J. Infect. Control. 44 (9 Suppl):S102–S8. doi:https://doi.org/10.1016/j.ajic.2016.06.003.
- Wölfel, R., V. M. Corman, W. Guggemos, M. Seilmaier, S. Zange, M. A. Mueller, D. Niemeyer, P. Vollmar, C. Rothe, M. Hoelscher, et al. 2020. Virological assessment of hospitalized cases of coronavirus disease 2019. MedRxIV. doi:https://doi.org/10.1101/2020.03.05.20030502.
- World Health Organization (WHO). 2008. Programmes and projects. Immunization, vaccines and biologicals: Influenza. Geneva, Switzerland: World Health Organization.
- World Health Organization (WHO). 2020. Report of the WHO-China joint mission on Coronavirus disease 2019 (COVID-19). Geneva, Switzerland: World Health Organization.
- Yu, I. T. S., Y. Li, T. W. Wong, W. Tam, A. T. Chan, J. H. W. Lee, D. Y. C. Leung, and T. Ho. 2004. Evidence of airborne transmission of the severe acute respiratory syndrome virus. N. Engl. J. Med 350 (17):1731–9. doi:https://doi.org/10.1056/NEJMoa032867.
- Zhang, Y., W. H. Finlay, and E. A. Matida. 2004. Particle deposition measurements and numerical simulation in a highly idealized mouth–throat. J. Aerosol Sci. 35 (7):789–803. doi:https://doi.org/10.1016/j.jaerosci.2003.12.006.
- Zumla, A., D. S. Hui, and S. Perlman. 2015. Middle East respiratory syndrome. Lancet 386 (9997):995–1007. doi:https://doi.org/10.1016/S0140-6736(15)60454-8.