
 ?Mathematical formulae have been encoded as MathML and are displayed in this HTML version using MathJax in order to improve their display. Uncheck the box to turn MathJax off. This feature requires Javascript. Click on a formula to zoom.
Abstract
A method to determine the cutoff diameter and counting efficiency of single-particle optical particle counters (OPC) is presented. An aerodynamic aerosol classifier (AAC) coupled with an atomizer was used to generate monodisperse dioctyl phthalate particles with a condensation particle counter (CPC) as the reference instrument. This method is accurate for capturing the counting efficiency of OPCs at lower size ranges and determining the cutoff diameter. The CPC was found to be a poor reference instrument for particles larger than 1 µm in which case an inkjet aerosol generator (IAG) was used as the monodisperse particle source and reference instrument. Two different particle materials were used with the IAG: lactose monohydrate and an ionic liquid (1-ethyl-3-methylimidazolium trifluoromethanesulfonate). A combination of the AAC to size smaller particles (<1 µm) and IAG to generate larger particles (>1 µm) was found to provide a comprehensive method capable of covering the counting efficiency over the entire operating range of OPCs.
Copyright © 2020 American Association for Aerosol Research
EDITOR:
1. Introduction
Optical particle counters (OPC) are commonly used for cleanroom monitoring, air pollution studies and aerosol research. An optical particle counter is an instrument that can measure the size and concentration of small particles suspended in a gas based on the light scattered by the particle (Sorensen et al. Citation2011). An optical particle counter operates by drawing an aerosol sample through a beam of light, the light scattered by the particle is received by a photodetector and converted into an electrical pulse. The number concentration of the particles in the aerosol is determined by the number of the pulses and sampled volume, and the size of the particle can be determined from the pulse height. This method of particle sizing has been known for more than 50 years with improvements in the technology being steadily developed over time; moving from white light and incandescent bulbs to lasers as the light source (Sorensen et al. Citation2011).
The cutoff diameter of an OPC is the diameter at which the counting efficiency is 50%. The counting efficiency of an OPC drops as particle sizes decrease due to the amount of light scattered by the particle being below the limit of the detector. Current standards for evaluating the counting efficiency of OPCs are outlined in ISO 21501-4 (ISO Citation2018). The procedure to evaluate the counting efficiency involves the use of two populations of calibration particles (often polystyrene latex [PSL]); one with a size close to the minimum detectable particle size of the OPC and another that is 1.5 to 2 times larger than the minimum detectable particle size. The counting efficiency is determined by taking the ratio of the concentrations measured by the particle counter being tested and a reference particle counter (either a condensation particle counter paired with a differential electrical mobility classifier or a calibrated OPC).
The main limitation of the current standard for determining the counting efficiency of an OPC is the use of calibration particles (i.e., PSL) which are only available at specific particle sizes. When there are only a few number of available sizes near the minimum detectable particle size of an OPC, the exact shape of the counting efficiency curve cannot be accurately characterized as counting efficiency curves for particle counters often have a sharp drop near the minimum detectable particle size. The minimum detectable size is an important specification of commercially available OPCs. For example, ISO 21501-4 requires that the counting efficiency is within 0.30 to 0.70 [corresponding to (50 ± 20)%] for calibration particles with a size close to the minimum detectable particle size of a given OPC. There are several studies completed in the past which evaluated the size close to the minimum detectable particle size which are summarized in . All these previous studies used polystyrene latex (PSL) particles with certified diameters as test particles. lists the diameter of PSL particles used in those studies. For particle sizes below 1.0 µm and above 100 nm, the ratio between two neighboring particle diameters, which is the ratio of the larger size over smaller size, ranges from 1.1 to 2.0, and the average value is 1.3. On the other hand, a counting efficiency of an OPC which complies with ISO 21501-4 rises from the minimum detectable size to the plateau regionFootnote1 within 1 to 1.5-2.0 of the minimum detectable size. Therefore, when using commercially available PSL particles whose sizes are greater than about 100 nm, the number of available particle diameters that can be used to evaluate the steep rising curve of the counting efficiency is generally two but not more than three. Thus, the steep curve of the counting efficiency can be difficult to fully characterize with the limited selection of available PSL particle sizes.
Table 1. Diameter of PSL particles that were used in past studies to evaluate the steep curve of the counting efficiency over sub-micrometer range.
In previous work, Sang-Nourpour and Olfert (Citation2019) demonstrated the calibration of an OPC in terms of particle size and number concentration with a system of an aerodynamic aerosol classifier (AAC) and a condensation particle counter (CPC). The AAC is an instrument which classifies particles based on their relaxation time (or aerodynamic diameter) (Tavakoli and Olfert Citation2013). The AAC can be used to create a monodisperse aerosol from most aerosol sources; and unlike other aerosol classifiers, like differential mobility analyzers or particle mass analyzers, it does not rely on the electrical charge of the particles, where there is a risk of selecting multiply charged particles. In the calibration system, the AAC is used to select particles of a desired size which are measured by a reference CPC and the OPC. As shown by Sang-Nourpour and Olfert (Citation2019), the OPC can be calibrated in terms of particle size by comparing the AAC-classified size to the size measured by the OPC (for any aerosol material over the aerodynamic size range of ∼25 nm to 6 µm). Also, the OPC can be calibrated in terms of counting efficiency by comparing the number concentration measured by the CPC and the OPC. Sang-Nourpour and Olfert (Citation2019) also found that at larger particle sizes (approximately >1 µm), the CPC makes a poor reference device because its counting efficiency is poor due to internal particle losses. However, Sang-Nourpour and Olfert (Citation2019) did not investigate how the AAC could be used in a system to determine the lower cutoff diameter of an OPC.
The purpose of this work is twofold. First, we demonstrate how an AAC system supplemented with a differential mobility analyzer (DMA) can be used to determine the cut off diameter of OPCs. Here the system was used to determine the cutoff diameters and counting efficiency of two OPCs by comparing measurements to a condensation particle counter (CPC) as the reference instrument. Compared to the current ISO standard, the AAC system provides a better method to determine the cutoff diameter of the OPCs by allowing the selection of particle sizes with high resolution and more quickly (i.e., the AAC can be adjusted in seconds to produce new particle sizes compared to tens of minutes for changing the liquid suspension of PSL in the current standard). Additionally, a DMA was used to measure the mobility diameter of the AAC-classified particles to directly measure the physical particle diameter of spherical particles to compare to the measured optical diameter of the OPCs. For this study, dioctyl phthalate (DOP) particles were used with the AAC for sizes between 80 nm to 3000 nm. Second, an inkjet aerosol generator (IAG) (Iida et al. Citation2014) was used to demonstrate the limitations of using a CPC as the reference instrument at larger sizes (approximately >1 µm), which is then used to calibrate the upper size range of the OPCs. Thus, this work demonstrates two calibration systems (AAC and CPC for small sizes and IAG for large sizes) that can be used together to calibrate the counting efficiency of OPCs over their entire operating range.
2. Material and methods
Two OPCs manufactured by RION Co., Ltd were tested, one with a nominal cutoff diameter of 0.08 µm and another with a nominal cutoff diameter of 0.3 µm. summarizes the specifications of these OPCs that are relevant to this study. The KC-22B is designed to monitor airborne particles whose diameters are as small as 80 nm in clean room environments for fabricating electronic devices. The observed upper size limit of KC-22B was around 600 nm in terms of optical diameter as will be shown in our results. The KC-01E is a general purpose OPC for monitoring clean room environments and can count particles with sizes from 0.3 µm to slightly below 10 µm.
Table 2. Specifications of the OPCs used in this study.
A schematic for the experimental set-up is shown in . In , an atomizer was used to generate smaller test particles (≤1 µm) and the two OPCs were compared to a reference CPC (Model 3790, TSI Inc.) to determine the counting efficiency. For larger particle sizes (≥1 µm), an inkjet aerosol generator (IAG, Shoreline Science Research Inc.) shown in was used to generate particles at a known rate and compared to the particle count rate measured by the KC-01E OPC. A scanning mobility particle sizer (SMPS, TSI Inc.) was used to measure the mobility diameter. The IAG was also used to test the counting efficiency of the reference CPC at particle sizes ≥1µm (Vasilatou et al. Citation2020; Iida and Sakurai Citation2018).
Figure 1. Experimental set-up for the calibration of two OPCs: (a) calibrating OPCs using an AAC and CPC (b) calibrating OPC using an IAG. The values in parenthesis are the sampling flowrate of each instrument with units of liters per minute.
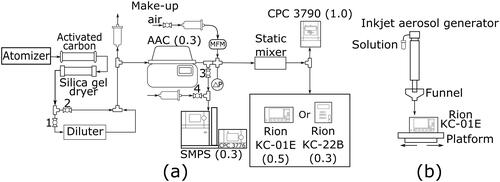
In , an atomizer (Model 3076, TSI Inc.) was used to atomize a solution of dioctyl phthalate (DOP, Wako Pure Chemical) in isopropyl alcohol (IPA, Wako Pure Chemical) to create DOP particles. A 1% (by volume) solution was used to generate particles with aerodynamic diameters up to 600 nm and a 5% (by volume) solution was used to generate particles with aerodynamic diameters larger than 600 nm. The atomized particles were sent through two aerosol conditioners: one with activated carbon and one with silica gel, to remove the propanol and any water vapor from the atomized solution. When calibrating the OPCs, Valve 2 (see ) was closed and Valve 1 was open to dilute the sample flow and decrease the particle concentration. An aerosol diluter (Model DDS 560, Topas-GmbH) was used in all tests with the AAC. The dilutor dilutes the aerosol by splitting the flow between a line with a HEPA-filter and a line without a filter, and then merging the flows to produce an aerosol with a lower particle number concentration. Using the same principle, a second custom dilution system was added in series for additional dilution in the KC-01E tests. When calibrating the OPCs Valve 3 and Valve 4 were closed and opened, respectively, to bring in filtered room air to the SMPS to keep the system running when not measuring the mobility-size distribution. The aerodynamic aerosol classifier (AAC, Cambustion Ltd.) was used to select particles to create a monodisperse aerosol which was sent through a static mixer to ensure particles were well distributed in the sample flow. The mixed sample flow was then sent to the OPC and reference CPC. The inlet pressure for the CPC and OPC were kept close to atmospheric pressure through adjusting the flowrate of the make-up air to maintain a reading close to 0 kPa on the differential pressure gauge. The counting efficiency, of an OPC is generally defined as the ratio of number concentration measured by the OPC to the reference CPC (ISO Citation2018).
(1)
(1)
where
and
are number concentrations measured by the OPC and CPC, respectively, and
is the counting efficiency of the reference CPC. When the
of KC-22B was evaluated the value of
was assumed to be constant since the mobility diameters of test particles ranged from 60 nm and 500 nm, and these values belong to the plateau region of the CPC counting efficiency curve. The evaluation of
and its uncertainty is described in the online supplementary information (SI).
In this study, the number concentration is calculated by the particle counts, divided by the sampled volume,
The sampled volume is obtained by the product of sampling flowrate,
and sampling time,
The actual sampling flowrates of the OPC and CPC were measured using the same mass flow meter (Model 4140, TSI Inc.). A custom LabView program controlled the OPC and CPC remotely to start and end counting at the same time; therefore, the sampling time divides out in the definition of
In this study the counting efficiency is expressed in terms of the ratio of particle counts and the ratio of sampling flowrates between the OPC and CPC.
(2)
(2)
In other words, the ratio of particle counts is corrected for the differences in the sampling flow rate between the OPC and reference CPC.
Using the AAC, DOP particles with aerodynamic diameters from 80 nm to 600 nm were selected and sent to the KC-22B OPC. For the KC-01E OPC, the AAC was used to select DOP particles with an aerodynamic diameter between 0.25 µm to 3 µm. The cutoff diameter, d50, was evaluated by fitting a straight line in the size range where the value of drops approximately from 90% to 20%. The expanded uncertainty (k = 2), which is equivalent to the 95% confidence interval of a Gaussian distribution, of d50 was estimated from the standard uncertainty of the linear regression with respect to particle diameter at
For particle diameters above 1 µm, the counting efficiency of the reference CPC (TSI 3790) was found to be poor (results shown below), and the CPC was no longer a good reference instrument to determine the counting efficiency of the OPCs. To evaluate the counting efficiency of the KC-01E over the micrometer range, different particles with volume equivalent diameters from 1 µm to 10 µm were generated by the IAG. Since the KC-01E outputs the pulse height distribution, the optical diameter of IAG-generated particles was determined from the measured pulse height distribution. shows the experimental setup for this evaluation. With the IAG, two different particle materials were used: lactose monohydrate (LM) and 1-Ethyl-3-methylimidazolium trifluoromethanesulfonate (TFMS), both in solution with ultrapure water. For these two solutions, the particle sizes were determined by creating solutions with increasing concentration of solute (LM or TFMS) in ultrapure water.
The IAG was set to generate particles at a fixed rate of 30.00 particles per second. The KC-01E was placed on a motorized platform which moved in the x-y directions to evenly distribute particles over the inlet plane of the sampling funnel. The funnel was attached directly to the inlet of the OPC which is located at the top of the instrument to guide particles from the IAG outlet to the OPC. As it was observed in a previous study (Sang-Nourpour and Olfert Citation2019) the internal losses inside the CPCs make the CPCs a poor reference instrument for large particle sizes. Therefore, best efforts were made to evaluate the internal losses inside the CPC and the counting efficiencies of the OPCs, evaluated by the setup in , were corrected for the losses. The same set-up with the IAG shown in was also used to determine the counting efficiency of the TSI 3790 CPC using TFMS particles as test particles with diameters between 0.7 µm to 3.7 µm. The liquid particles were used in place of the DOP particles to simulate the transport losses inside the CPC during the evaluation of under the setup given in . First, only the CPC was tested to determine the counting efficiency. Then a second set of tests were performed with 88 cm of conductive tubing leading to the CPC inlet to simulate the conditions of the initial tests with the AAC shown in . Since the inlet of the CPC was on the front of the instrument, a funnel was attached to a 90° steel tube connected to the CPC inlet to direct the particles from the IAG outlet to the CPC. When the IAG is used as a monodisperse particle number standard, the counting efficiency is defined by
(3)
(3)
where
is the particle count rate of the device under test (DUT) which is an OPC or CPC in this study, and
is the particle generation rate of the IAG.
is calculated by
divided by the sampling time set to the DUT,
An alternative expression for EquationEquation (3)
(3)
(3) is
(4)
(4)
where
is the number of particles generated by the IAG within the time
or
It is noted that the counting efficiencies of the count-matching method (EquationEquation (2)
(2)
(2) ) or the generator method (EquationEquation (4)
(4)
(4) ) are both based on the particle number; therefore, these two efficiencies are equivalent.
The experimental setup shown in was also designed to allow for the measurement of the size distribution using an SMPS to evaluate the mobility diameter of DOP droplets as well as confirm the particle size distribution of particles classified by the AAC was monodisperse. In this case, dilution of the sample was not necessary therefore Valve 2 was open and Valve 1 was closed. Valve 3 was open to send the sample to the SMPS while valve 4 was closed to stop bringing in filtered room air. For the KC-01E OPC, only particle size distributions for mobility diameters up to 0.6 µm were measured using the SMPS. Larger particle size distributions would not have been fully captured within the sizing limits of the SMPS.
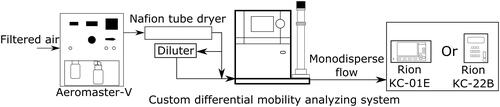
The two OPCs were initially calibrated using PSL particles to obtain a relationship between pulse height and the diameter of PSL particles. Table S1 of the SI lists the specifications of these size-standard PSL particles. This relationship was used to convert pulse height measurements made by the OPC on the DOP particles to a PSL-equivalent optical diameter (referred to simply as the ‘optical diameter’). Observed pulse heights were compared with theory. Mie theory (Bohren and Huffman Citation1983) was used to calculate the theoretical scattering cross section integrated over the collection angle of each OPC given in . shows a simplified schematic of the experimental set-up used. A nebulizer (Aeromaster-V, JSR Corporation) was used to atomize PSL suspensions to produce PSL particles. The sample flow was then sent through a nafion tube dryer to remove water from the sample flow. The sample flow was then sent through a custom differential mobility analyzing system (DMAS; ISO Citation2009) with a long DMA (Model 3081, TSI Inc.) to ensure the particles were monodisperse before being sent to an OPC. A particle size distribution measurement was first performed with the DMAS to confirm the particle sizes and to obtain the peak voltage value used to set the DMA for the OPC calibration. During the particle size distribution measurements, the sample was not diluted; however, when calibrating the OPCs the sample was sent through a custom dilution system to decrease the particle concentration. The apparent size resolution of the OPCs were evaluated by analyzing the measured pulse height distributions of PSL particles. It is called “apparent” since the width of the size distribution of PSL particles were assumed to be zero. ISO 21501-4 was used as a guideline to evaluate the apparent size-resolutionFootnote2.
Figure 2. Simplified schematic of the experimental setup used to calibrate the OPC pulse heights as a function of PSL-equivalent optical diameter.
3. Results and discussion
3.1. Opc pulse height calibration
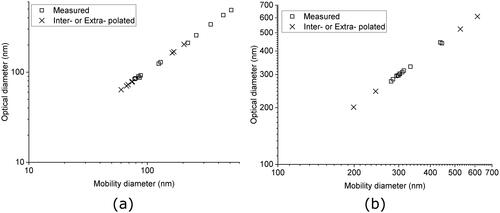
The pulse height responses of the KC-22B and KC-01E OPC are plotted as a function of PSL diameter and are shown in and b, respectively. The apparent size resolution of these OPC are shown in as a function of the diameter of PSL particles. The relationship between the optical diameter, and mobility diameter,
of the AAC-classified DOP particles are given in and b for the KC-22B and KC-01E, respectively. Regarding the KC-22B, the relationship between the pulse height and particle size is unique because the operating size regime of KC-22B is predominantly within the Rayleigh regime as Mie theory predicts. The apparent size resolution of KC-22B is 3.9% on average, the value is nearly constant over the operating size range of the OPC. When the values of
were less than 80 nm and between 163 and 202 nm the corresponding values of
could not be determined. These two size ranges were not detectable under high or low gain settings of the KC-22B, respectively, because the pulse height distributions of the DOP particles and background noise had a significant overlap. In that case, the values of
were extrapolated or interpolated from the measured relationship between
versus
at other sizes as shown in . On the other hand, the operating size range of KC-01E has a transition regime at diameters around 500 nm which is in agreement with Mie theory. When the values of
were at 508 and 594 nm the corresponding values of
could not be determined because the shape of the pulse height distributions was unusual and significantly skewed toward smaller sizes, which is most likely caused by the non-monotonic behavior of pulse height versus sizes over the transition regime (Liu, Berglund, and Agarwal Citation1974). The apparent size resolutions at 0.603, 0.814, and 2.005 µm are greater than 15% which is the upper limit according to the requirement of ISO 21501-4. The size resolution at boundary sizes of KC-01E are all less than the required upper limit; therefore, the OPC is ISO-compliant. When the values of
were less than 241 nm, the values
could not be determined from the pulse height distribution because the sizes were less than minimum detectable size of KC-01E. For the particles with
less than 241 nm and with
at 508 and 594 nm the corresponding values of
were extrapolated from the measured relationship at other sizes as shown in .
Figure 3. Calibration results for (a) KC-22B and (b) KC-01E OPC showing pulse height as a function of PSL particle size. A gain factor of 452 and 33.6 were used to convert the pulse height under low gain to high gain for KC-22B and KC-01E, respectively. The solid line represents the theoretical scattering cross section integrated over the collection angle of each OPC. The calculated results are scaled to fit the measured light scattering intensity. (c) Apparent size resolution of the two OPCs used in this study.
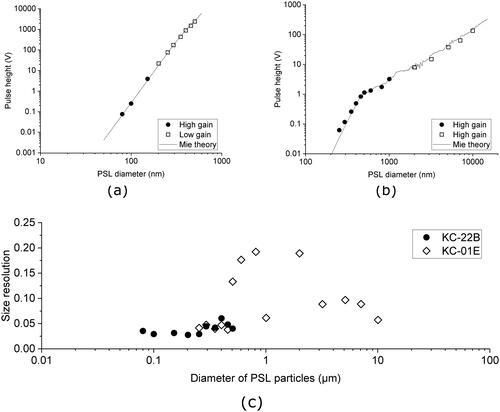
Figure 4. The relationship between the optical diameter and mobility diameter of the AAC-classified DOP particles for the KC-22B (a) and KC-01E (b) OPCs.
3.2. Counting efficiency of the OPCs
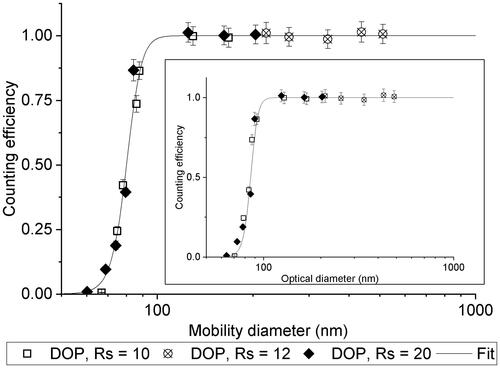
The counting efficiency of the KC-22B OPC relative to the TSI 3790 CPC is shown in as a function of mobility diameter and optical diameter (inset). From the plot, it can be seen that the counting efficiency of the KC-22B drops sharply at a mobility diameter of ∼100 nm relative to the CPC. The cutoff diameter, d50, and its expanded uncertainty (k = 2) are 79.9 nm and 1.2 nm, respectively. The cutoff diameter agrees with the minimum detectable size specified by the manufacturer. The resolution, Rs, of the AAC, defined as the inverse of the normalized full-width half-maximum of the AAC transfer function, was also varied and appeared to not affect the counting efficiency of the OPC indicating that the size-window of the AAC transfer function is sufficiently narrow for evaluating the d50 of OPCs. The optical diameter is also comparable to the mobility diameter as seen in and the d50 in terms of optical diameter and its expanded uncertainty are 84.1 nm and 1.5 nm, respectively.
Figure 5. Rion KC-22B OPC counting efficiency plotted as a function of mobility diameter. Inset shows OPC counting efficiency plotted as a function of optical diameter.
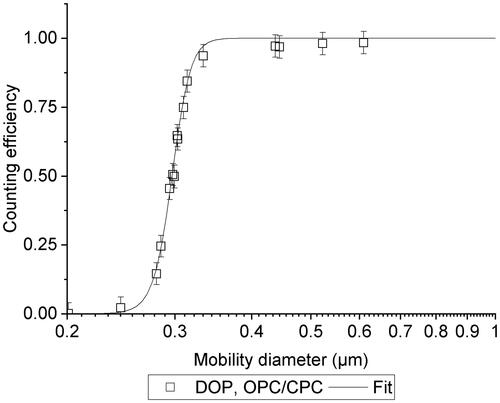
shows the counting efficiency of the KC-01E OPC as a function of mobility diameter. The mobility diameter was only measured up to 600 nm due to limited sizing-range of the SMPS. From this plot, the cutoff diameter for the KC-01E in terms of mobility diameter and its expanded uncertainty are 295.6 nm and 1.0 nm, respectively. The cutoff diameter is well within the manufacturer’s specified minimum detectable size.
Figure 6. Rion KC-01E OPC counting efficiency plotted as a function of mobility diameter.
To characterize the counting efficiency of the KC-01E above a mobility diameter of 600 nm, an IAG was used as a reference instrument along with LM and TFMS particles. The results are shown in , and in this case, since the OPC instead of the SMPS was used as the sizing instrument, the counting efficiency is plotted as a function of optical diameter. The values of in terms of optical diameter and its expanded uncertainty are 294.8 nm and 0.6 nm, respectively. As can be seen in the plot, the counting efficiency of the KC-01E begins to drop at around 10 µm which is near the upper limits specified by the manufacturer.
Figure 7. Rion KC-01E OPC counting efficiency plotted as a function of optical diameter to represent the entire range of the OPC.
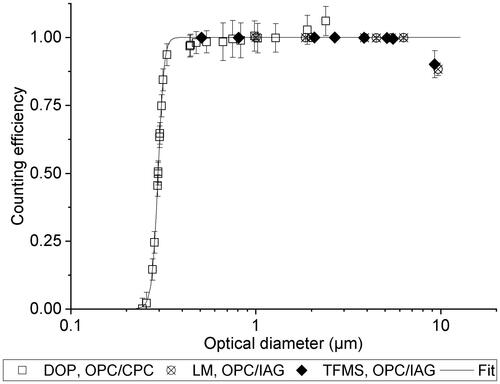
It can also be seen that in the experiments with the CPC as the reference instrument, the CPC appears to under-count particles relative to the OPC at particles with optical diameters greater than 1 µm. This is not observed when the IAG was used as the reference instrument. The reason for the OPC counting more particles than the CPC is likely due to the counting efficiency of the CPC decreasing at larger particle sizes which was also observed by Sang-Nourpour and Olfert (Citation2019).
3.3. Counting efficiency of CPC at large particle size (>1 μm)
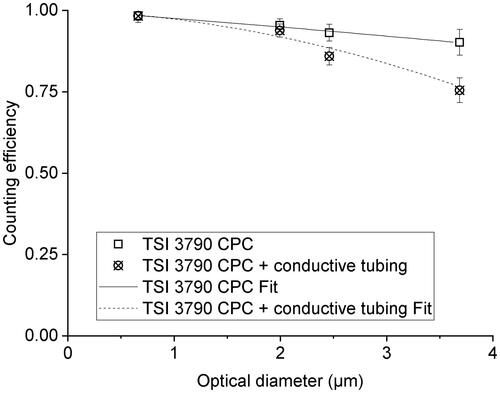
To confirm that the reason for the OPC over-counting is due to decreased CPC counting efficiency at larger particle sizes, the CPC was also tested with the IAG and TFMS particles which are liquid. A case with additional conductive tubing connected to the inlet of the CPC was used to replicate the test conditions when calibrating the OPC was also done. The results of the counting efficiency of the CPC at larger particle sizes relative to the IAG are presented in . At an optical diameter of 663 nm, the counting efficiency of the CPC remains high at 98.3 ± 1.2% for both cases. As particle size increases beyond 1 µm the counting efficiency of the CPC begins to drop and for TFMS particles with an optical diameter of 3.7 µm the counting efficiency drops to 90 ± 4% and 75 ± 4% without and with the conductive tubing; respectively. Thus, it is clear that the CPC makes a poor reference instrument for OPC calibration above ∼1 µm. Additionally, the counting efficiency of the CPC is significantly lower when conductive tubing is used to transport the sample to the CPC due to transport losses in the tubing.
Figure 8. The counting efficiency of the TSI 3790 CPC using TFMS droplets particles and the IAG. Error bars represent 95% confidence intervals.
The square symbols in represent the values of evaluated by the count-matching method. These values are already corrected for the transport losses through conductive tubing and the reference CPC. The corrected
is greater than those measured by using the IAG, and the amount of error increases with size. The observed trend suggests that the correction factors underestimates the actual losses under the count-matching method. In this study the losses through the conductive tube and CPC were simulated by introducing test particles from the IAG. A funnel was attached at the inlet of the conductive tubing, and test particles were introduced uniformly over the inlet plane of the funnel. On the other hand, under the count-matching method, the test particles were first mixed through a static mixer then split at a tee junction. The split ratio of the two flows at a tee junction usually deviates from 1:1 since the typical sampling flowrates of OPCs ranges from 0.3 to 30 L/min while the typical sampling flowrate of the CPC ranges from 0.3 to 1.0 L/min. In this study the flowrate toward the CPC was about 2 and 3.3 times higher when KC-01E and KC-22B were tested, respectively. It is difficult to design an experiment which can reproduce the mixing state and transport losses of micrometer-sized particles under the count-matching method when a flow splitting tee is used to deliver test particles to an OPC and a reference CPC. If the count-matching method is used to evaluate the counting efficiency of OPCs for micrometer-sized particles it is recommended to implement a long vertical tube with an aerosol mixing device at the point of aerosol injection because the concentration over the cross section of the tube tends to be uniform; therefore, the number concentration of test particles at the inlet of reference CPC and OPC are guaranteed to be equal (Horender, Auderset, and Vasilatou Citation2019).
4. Conclusion
The current ISO standard requires the use of PSL particles for OPC calibration, but the available selection of PSL particle sizes is a limiting factor which prevents detailed characterization of the counting efficiency near the minimum detectable particle sizes. A new method to calibrate OPCs near the minimum detectable particle size to capture the cutoff diameter was presented. The AAC was used to select particles with aerodynamic diameters between 80 nm and 3 µm (estimated PSL-equivalent optical diameters between 70 nm and 2.4 µm). This method was demonstrated to be able to accurately measure the counting efficiency near the cutoff diameter and capture the sharp drop in the counting efficiency curve. On the other hand, at larger particle sizes the CPC was proven to be a poor reference instrument as the counting efficiency decreased (which was also observed by Sang-Nourpour and Olfert [Citation2019]).
For the calibration of OPCs in the larger particle size range (> 1 µm), the IAG was shown to provide more accurate results using two types of particles. Since IAG cannot precisely control the size of generated particles at 0.3 µm, the IAG is not suitable for cases where the minimum detectable particle size of OPCs is near or below 0.3 µm. Therefore, the use of a combination of an AAC and IAG allows for the coverage of the entire particle size range and can be used to determine the lower and upper limits of OPC counting efficiency.
Supplemental Material
Download MS Word (74.3 KB)Additional information
Funding
Notes
1 The plateau region is defined here as the size range where the counting efficiency is nearly constant and reaching to an asymptote.
2 The method described in ISO 21501-4 requires the standard deviation of the size distribution of PSL particles. The standard deviation was calculated from the coefficient of variation of the size distribution (See Table S1). The calculated values at some sizes turned out be larger than the apparent standard deviation based on the pulse height analysis. As a compromise solution, PSL particles were assumed to be perfectly monodisperse.
References
- Binnig, J., J. Meyer, and G. Kasper. 2007. Calibration of an optical particle counter to provide PM2.5 mass for well-defined particle materials. J. Aerosol Sci. 38 (3):325–32. doi:10.1016/j.jaerosci.2006.12.001.
- Bohren, C. F., and D. R. Huffman. 1983. Absorption and scattering of light by small particles. Hoboken, NJ: Wiley.
- Heim, M., B. J. Mullins, H. Umhauer, and G. Kasper. 2008. Performance evaluation of three optical particle counters with an efficient “multimodal” calibration method. J. Aerosol Sci. 39 (12):1019–31. doi:10.1016/j.jaerosci.2008.07.006.
- Horender, S., K. Auderset, and K. Vasilatou. 2019. Facility for calibration of optical and condensation particle counters based on a turbulent aerosol mixing tube and a reference optical particle counter. Rev. Sci. Instrum. 90 (7):075111. doi:10.1063/1.5095853.
- Iida, K., and H. Sakurai. 2018. Counting efficiency evaluation of optical particle counters in micrometer range by using an inkjet aerosol generator. Aerosol Sci. Technol. 52 (10):1156–66. doi:10.1080/02786826.2018.1505032.
- Iida, K., H. Sakurai, K. Saito, and K. Ehara. 2014. Inkjet aerosol generator as monodisperse particle number standard. Aerosol Sci. Technol. 48 (8):789–802. doi:10.1080/02786826.2014.930948.
- ISO 2009. ISO 21501-1 - Determination of particle size distribution - Single particle light interaction methods - Part 1: Light scattering aerosol spectrometer, First Edition. ed. International Organization for Standardization, Switzerland.
- ISO 2018. ISO 21501-4 - Determination of particle size distribution - Single particle light interaction methods - Part 4: Light scattering airborne particle counter for clean spaces - Second Edition, Second Edition. ed. International Organization for Standardization, Switzerland.
- Liu, B. Y. H., R. N. Berglund, and J. K. Agarwal. 1974. Experimental studies of optical particle counters. Atmospheric Environment (1967) 8 (7):717–32. doi:10.1016/0004-6981(74)90016-X.
- Mullins, B. J., D. Kampa, and G. Kasper. 2012. Comment on “Performance evaluation of 3 optical particle counters with an efficient multimodal calibration method” (Heim et al., 2008)—Performance of improved counter. J. Aerosol Sci. 49:48–50. doi:10.1016/j.jaerosci.2012.01.009.
- Sang-Nourpour, N., and J. S. Olfert. 2019. Calibration of optical particle counters with an aerodynamic aerosol classifier. J. Aerosol Sci. 138:105452. doi:10.1016/j.jaerosci.2019.105452.
- Sorensen, C. M., J. Gebhart, T. J. O’Hern, and D. J. Rader. 2011. Optical measurement techniques: fundamentals and applications. In Aerosol Measurement, ed. P. Kulkarni, P. A. Baron, and K. Willeke, 269–312. Hoboken, NJ: John Wiley & Sons, Ltd.
- Tavakoli, F., and J. S. Olfert. 2013. An instrument for the classification of aerosols by particle relaxation time: theoretical models of the aerodynamic aerosol classifier. Aerosol Sci. Technol. 47 (8):916–26. doi:10.1080/02786826.2013.802761.
- Vasilatou, K., K. Dirscherl, K. Iida, H. Sakurai, S. Horender, and K. Auderset. 2020. Calibration of optical particle counters: first comprehensive inter-comparison for particle sizes up to 5 µm and number concentrations up to 2 cm − 3. Metrologia 57 (2):025005. doi:10.1088/1681-7575/ab5c84.
- Walser, A., D. Sauer, A. Spanu, J. Gasteiger, and B. Weinzierl. 2017. On the parametrization of optical particle counter response including instrument-induced broadening of size spectra and a self-consistent evaluation of calibration measurements. Atmos. Meas. Tech. 10 (11):4341–61. doi:10.5194/amt-10-4341-2017.
- Wen, H. Y., and G. Kasper. 1986. Counting efficiencies of six commercial particle counters. J. Aerosol Sci. 17 (6):947–61. doi:10.1016/0021-8502(86)90021-2.