
 ?Mathematical formulae have been encoded as MathML and are displayed in this HTML version using MathJax in order to improve their display. Uncheck the box to turn MathJax off. This feature requires Javascript. Click on a formula to zoom.
Abstract
Some recent findings regarding the negative health effects of particulate matter increase the relevance of the detailed characteristics of particulate emissions from different sources and especially the nonvolatile fraction of particles. In this study, the nonvolatile fraction of ultrafine particulate emissions from a non-road diesel engine was studied. The measurements were carried out in an engine laboratory and the exhaust sample was taken from the engine-out location with various steady state driving modes. Four different fuels, including fossil fuel, soybean methyl ester (SME), rapeseed methyl ester (RME), and renewable paraffinic diesel (RPD), were used. In the sampling system, the sample was diluted and led through a thermodenuder removing the volatile fraction of particles. The measured particle size distributions of nonvolatile particles were found to be trimodal. Based on the size distribution data as well as the morphology and elemental composition of particles in transmission electron microscopy (TEM) samples, we were able to draw conclusions from the most probable origin of the different particle modes, and the modes were named accordingly. From larger to smaller in particle size, the modes were a soot mode, lubricating oil originated core (LC) mode, and a fuel originated core (FC) mode. All of these three modes were detected with every driving mode, but differences were seen, for example, between different fuels. In addition, a trade-off was observed in the concentrations of the LC mode and the soot mode as a function of the engine torque.
EDITOR:
1. Introduction
Air pollution and ambient particulate matter have been reported to form the highest environmental and occupational risk for deaths and disability-adjusted life-years (Cohen et al. Citation2017). In epidemiological studies, the number of premature deaths caused annually by particulate matter have been estimated to be 3.3 million by Lelieveld et al. (Citation2015) and, more recently, 8.9 million by Burnett et al. (Citation2018). The epidemiological evidence is not only restricted to premature deaths but the ambient particulate matter has also been associated with respiratory and cardiopulmonary diseases (e.g., Cohen et al. Citation2017; Chen et al. Citation2019). However, the connection between epidemiological evidence and toxicological tests focusing on the mechanisms of particles interacting with living organisms has been very difficult to investigate. There are many challenges in the interface of aerosol science and biology especially related to the collection of particles for toxicological experiments (Paur et al. Citation2011; Ihalainen et al. Citation2019). Therefore, the air pollution mitigation actions have mainly been based on the epidemiological evidence of the harmfulness of widely measured and reported mass concentrations of fine particles (PM2.5). However, as a recent publication by Li, Jin, and Kan (Citation2019) underlines that the effect of ambient PM2.5 concentrations on human health and mortality may differ a lot depending on the characteristics of each local environment having various sources and composition of particulate matter. An interesting aspect to the field of epidemiological and toxicological studies is recently brought by studies in which metallic nanoparticles have been found in human brains and they have been associated with cognitive disorders (Maher et al. Citation2016; Fu et al. Citation2019).
Diesel vehicles are one of the main sources of particulate matter in densely populated areas and they are known to have harmful effects on human health. This has led to the implementation of international and national emission standards and they have set guidelines for the development of diesel engine technologies and aftertreatment systems since the early 1990s. One of the latest additions to the emission standards is the limitation of the number of nonvolatile particles of diesel exhaust. The aim of this emissions standard has practically been to restrict the number of soot particles known to be a major particulate mass component in the diesel engine exhaust and a component that is easily deposited on the alveolar region of human lungs. However, recent findings concerning the possible hazardous health effects of metallic nanoparticles found in human brains (Maher et al. Citation2016) motivate us to focus on the research of the possible nonvolatile particles other than soot in the diesel engine exhaust and also on the size range below 23 nm. Furthermore, the emission standards are not uniform worldwide and in several countries the use of a diesel particulate filters (DPF) that remove the majority of nonvolatile particles is practically not required by the regulation. In some countries, despite the regulated nonvolatile particle emissions, there can be a lack of control in the DPF-related maintenance and real-world particle emission monitoring. These problems, together with gradually renewing vehicle fleets, lead to the current situation in which the soot emissions of vehicles are still deteriorating the air quality. This can especially seen in traffic environments, for instance, by monitoring ambient black carbon concentrations (Helin et al. Citation2018).
The aforementioned soot particles, being carbonaceous and agglomerated particles with a mean diameter between 30 and 100 nm, typically dominate the mass of solid exhaust particles emitted by diesel (Kittelson Citation1998) and gasoline engines (see, e.g., Karjalainen et al. Citation2014). However, vehicle exhaust can also contain other primary particles. The variation of nonvolatile particle morphology, size, and composition was investigated recently by Liati et al. (Citation2018). In their study, a transmission electron microscope (TEM) and energy-dispersive X-ray (EDX) analysis were used to observe particles collected from diesel and gasoline vehicle exhaust. They found three types of solid particles, that is, soot particles, ash-bearing soot particles, and separate ash particles. Although most of the soot particles and significant fraction of the ash particles were relatively large particles including agglomerates, also smaller non-agglomerated particles were found. The reported ash particles contained tracers of lubricating oil such as calcium (Ca), phosphorous (P), magnesium (Mg), and zinc (Zn), as well as, iron (Fe) and tin (Sn) from engine wear, and, in some cases, also tungsten (W) and silicon (Si) probably originating from exhaust aftertreatment devices. The size distributions were not reported by Liati et al. (Citation2018). Similar elementary composition of particles, linked mostly to the lubricating oil as an origin, was found by Miller et al. (Citation2007) who reported lubricating oil originated particles in the sub-50 nm size range having number concentrations ranging from 105 to In their study, the test vehicle was powered by hydrogen in order to minimize the role of fuel combustion originated particles. Thus, the role of lubricating oil as an important origin of vehicle exhaust particles is obvious, also in respect of particulate mass emissions (Thiruvengadam et al. Citation2014; Carbone et al. Citation2019).
Several exhaust studies have reported high concentrations of sub-10 nm nonvolatile particles that are frequently called as core particles due to the need to separate these physically and chemically different particles from soot particles but also due to their small size and their tendency to increase in size in the tailpipe (Sgro et al. Citation2012) and in cooling dilution of exhaust (Sakurai et al. Citation2003; Rönkkö et al. Citation2007). Previous research regarding the composition of core particles is slightly inconsistent, because some studies have proposed that they would consist of metallic ash formed from the impurities of fuel or from the aforementioned metallic elements of lubricating oil (Fushimi et al. Citation2011; Lähde et al. Citation2014; Pirjola et al. Citation2015), and the others indicate that they consist of amorphous carbonaceous particles formed in combustion (Sgro et al. Citation2008, Citation2012; Paul et al. Citation2013; Seong, Choi, and Lee Citation2014). However, it has been shown, based on their nonvolatile nature and elevated electrical charge, that the core particles are formed at elevated temperatures (Alanen et al. Citation2015; Rönkkö et al. Citation2007; De Filippo and Maricq Citation2008; Lähde et al. Citation2009). In addition, their emission can be efficiently decreased by exhaust filtration, that is, by similar techniques than used for soot particle emission reduction (De Filippo and Maricq Citation2008; Heikkilä et al. Citation2009a; Lähde et al. Citation2009). Furthermore, the core particle emissions have been reported to correlate negatively with the simultaneous soot particle emissions (Lähde et al. Citation2010) and to be affected by fuel composition (Heikkilä et al. Citation2009b) and metallic fuel additives (Lee et al. Citation2006). Despite the various proposed compositions and origins for the nonvolatile core particles, none of the aforementioned studies have ended up to a conclusion that different core particles would co-exist in the exhaust and form separate particle modes.
The understanding of formation, characteristics, and size distribution of particles is crucial when their effects on human health, air quality, and climate are assessed. Furthermore, this understanding is valuable when optimized strategies for emission reduction are designed. For instance, the deposition efficiency of particles in human respiratory tract is highly dependent on the particle size (IRCRP Citation1994), and thus, together with the toxic potential of particles, it most likely determines the total harmfulness of inhaled particles. Also with respect to diesel exhaust particles, it is important to know the size distribution, mixing state, and composition of particles. A detailed characterization of emitted aerosol also helps to separate the roles of primary and delayed primary particulate matter (i.e., the particulate matter formed in cooling dilution of exhaust) in respect of their health effects or the development of emission reduction techniques.
The aim of this study is to clarify the role of different nonvolatile particles in the diesel exhaust. The study is based on experiments carried out in an engine laboratory for a non-road diesel engine and four different fuels including one fossil fuel and three renewable fuels. In the experiments, particle size distributions were measured for different steady driving test points and transmission electron microscopy samples were collected for each test point. By carefully analyzing the size distributions as well as the structure and elemental composition of particles in the electron microscopy samples, we were able to draw conclusions from the origin of the different nonvolatile particles.
2. Experimental
2.1. Engine and driving conditions
The engine used in the experiments of this study was a 4-cylinder, turbocharged, intercooled non-road diesel engine. In a standard form, the engine was designed to meet Tier 4 interim emission requirements when equipped with the DOC and SCR as the exhaust gas aftertreatment system. However, the standard aftertreatment systems were not used in this study, and the exhaust particle were studied from the engine-out (manifold-out) location. The engine was equipped with a common rail fuel injection system and it had a four-valve cylinder head. The engine was loaded by means of an eddy-current dynamometer (WT300, Horiba).
The emissions measurements were conducted according to the test cycle C1 of the ISO 8178-4 standard (), known as the Non-Road Steady Cycle (NRSC). The full load torque was first determined. At each speed, the maximum torque for the measurements was then selected so that each torque was 90% of the full load torque. This way, it was possible to run the engine at the same loads with each studied fuel. The rated speed was 2200 rpm and the intermediate speed 1500 rpm. Each measurement day, the intake air temperature was adjusted at 50 °C downstream the charge air cooler when the engine was run at maximum torque at rated speed. The temperature was controlled manually by regulating cooling water flow to the heat exchanger. Before the measurements at each load point, the engine parameters were waited to stabilize, the criteria being that the temperatures of coolant water, intake air, and exhaust were stable. Each measurement point was driven at least for 20 min after stabilization.
Table 1. Test points in the test cycle C1 of the ISO 8178-4 standard.
The engine was run with four different fuels, one fossil diesel fuel and three alternative fuels, with their details found in : fossil diesel (fulfilling EN 590:2014-04), soybean methyl ester (SME), rapeseed methyl ester (RME), and renewable paraffinic diesel (RPD). Two alternative fuels SME and RME had cetane numbers close to 50 whereas the RPD had significantly higher cetane number (74.7) while having lower bulk density. For all the fuels, sulfur content was very small (below 4 ppmw), even below the detection limit for the RPD fuel. RPD fuel consisted over 99% of C and H in elemental composition. Fatty acid methyl ester fuels, RME and SME, contained much more oxygen (not analyzed here) explaining majorly the missing elemental fraction, also these fuels contained small quantities of impurities (Na, K, Ca, Mg). The water content in SME was three times larger than in RME and about 20 times larger than in RPD. For fossil diesel fuel, most analyzes are unfortunately not available. The engine lubricant was manufacturer approved commercial viscosity grade SAE 15W-40 lubricating oil containing trace elements Ca, P, Zn, and S, 2051, 940, 1093, and 3399 mg/kg, respectively.
Table 2. Fuel specifications and composition for fossil fuel, rapeseed methyl ester (RME), soybean methyl ester (SME), and renewable paraffinic diesel (RPD).
2.2. Aerosol measurements
Aerosol sampling and measurements were performed with a setup shown in . The first part of the setup was designed to meet the needs of a parallel study on volatile particles. The primary dilution for particle size distribution and number measurements was conducted with a porous tube diluter (PTD) that enabled gas-to-particle conversion process and nucleation mode formation (Ntziachristos et al. Citation2004; Mathis et al. Citation2004). An ageing chamber was used after the PTD to enable particle growth by condensable species. The dilution ratio of the PTD was adjusted to 12 by measuring gas concentrations after the ageing chamber. Secondary exhaust dilution was performed with a Dekati ejector diluter.
Figure 1. A schematic of the experimental setup. The sample was taken from the tailpipe through a porous tube diluter (PTD), aging chamber, ejector diluter, and a thermodenuder (TD) to the measuring devices including an electrical low-pressure impactor (ELPI) and two scanning mobility particle sizers (SMPS) consisting of differential mobility analyzers (DMA) and condensation particle counters (CPC).
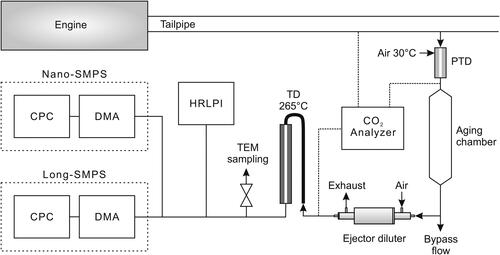
In order to study the nonvolatile particle fraction, a heated thermodenuder (TD) with low nanoparticle losses was applied (Rönkkö et al. Citation2011; Heikkilä et al. Citation2009a). In the TD, the continuous exhaust sample is first heated up to 265°C, and after that, conducted through a denuder part in order to decrease the concentration of volatilized compounds. The combination of the PTD and the TD as a sampling system has previously been compared to a heated (double ejector) dilution system by Lähde et al. (Citation2011) with a diesel engine ran without exhaust aftertreatment systems and found to produce corresponding aerosol of nonvolatile particles.
For the European solid particle number exhaust emission regulation, the volatile particle removal (VPR) system is specified to comprise of an upstream hot (>150°C) dilution stage with particle-free air, followed by heating at 300–400°C in an evaporation tube (see, e.g., Giechaskiel et al. Citation2012). A possible artifact of this measurement is the re-nucleation of once volatilized compounds after the heated section. To remove volatile material from the sample flow, a catalytic stripper (CS) or a TD could be used (see, e.g., Giechaskiel and Martini Citation2014). The performance of the TD based system was compared with a CS based VPR system by Amanatidis et al. (Citation2018). They suggest the use of sufficient dilution ratio and moderate TD temperatures (of the order of 250°C) to avoid artifact formation through sulfur driven re-nucleation. The overall dilution ratio of circa 100 used in this study is considered high enough, considering the low sulfur content of the fuel. Amanatidis et al. (Citation2018) also showed that incomplete evaporation was not a problem with the TD.
The size distribution data were corrected for the nanoparticle losses in the TD which vary, for example, between 32% and 50% for mobility particle sizes 10 and 4.5 nm, respectively (Heikkilä et al. Citation2009a). CO2 concentrations from raw exhaust and diluted exhaust were measured to determine the total exhaust dilution ratio. The number size distributions of the exhaust particles were measured with two scanning mobility particle sizers (SMPS): the first one called a Nano-SMPS operated in a size range of 3–60 nm and the second one called a Long-SMPS in a size range of 10–420 nm. The Nano-SMPS consisted of a differential mobility analyzer (DMA, TSI Model 3085) called a Nano-DMA and an ultrafine condensation particle counter (CPC, TSI Model 3025), and it was operated with a scanning time of 150 s. The Long-SMPS consisted of a DMA (TSI Model 3081) and an ultrafine CPC (TSI Model 3025), and the scanning time was set to be the same as for the Nano-SMPS. In addition, a high-resolution low-pressure impactor (HRLPI) (Arffman et al. Citation2014) was used to monitor the stability of the aerosol sample during the test points. The HRLPI is an aerosol instrument capable of measuring the particle size distribution in a size range of 5–200 nm and with a time resolution of one second.
2.3. TEM sampling and analysis
In order to study particle morphology and elemental composition, the exhaust particles were collected from the diluted sample on holey-carbon grids (Agar Scientific) by a flow-through sampler where the diluted sample flow of 1 lpm was sucked though the grids. In this sort of a sampler, the particles are collected onto grids by diffusion, interception and impaction mechanisms, which lead to particle size dependent collection process. The collected individual particles were then analyzed by shape with a TEM (Jeol JEM-2010) and by elemental composition with an energy-dispersive spectrometry (EDS, Noran Vantage with Si(Li) detector, Thermo Scientific). The EDS system was included in the TEM and an acceleration voltage of 200 kV was used in the TEM. Altogether, seven different TEM samples for different test points and fuels were analyzed including online observation, several micrographs, and several EDS analyses for each sample.
3. Results and discussion
3.1. Trimodal size distributions
As an example, shows the size distribution data and overall TEM micrographs for SME fuel and test points ISO 5, ISO 6, and ISO 7. The main observation from the combination of size distribution data and TEM images was that the trimodal shape seen in the distributions was connected to three different types of particles seen in the analyzed TEM samples. The trimodal shape of distributions may not be evident if one is not familiar with some corresponding bimodal cases measured with the same instrumentation and presented with similar logarithmic figures. Therefore, the same trimodal size distributions () are also shown in the Supplementary Material (Figure S1) along with three different bimodal reference size distributions previously reported by Karjalainen et al. (Citation2017). The two particle modes of these bimodal reference size distributions have been generated in the laboratory. Even if the difference between the mean diameters of these two modes is smaller than in the size distributions of this study, there is a clear gap between the two modes of the reference size distributions. However, in the size distributions of this study, the gap is not seen because of the third mode existing between the smallest and the largest particle modes. The instrumentation used to measure the reference size distributions was identical to the instrumentation used in this study consisting of a Nano-SMPS and a Long-SMPS.
Figure 2. An example of transmission electron microscopy (TEM) images and particle size distributions for the driving modes (a) ISO 5, (b) ISO 6, and (c) ISO 7. The distributions were measured with two scanning mobility particle sizers (SMPS). Lognormal fits for three different particle modes are drawn with a black dashed line and the sum of these fits with a black solid line. The fuel was soy methyl ester (SME) in all of these three cases.
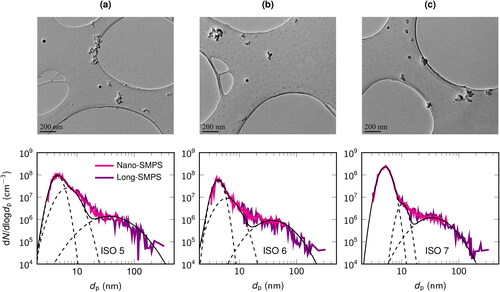
Three different types of particles were distinguished in the analyzed TEM samples. One of the particle types was the agglomerated soot mainly seen in a diameter range from 50 to 200 nm. Then there were spherical droplet-like particles mainly seen below 50 nm and very small core particles below 10 nm. Because the collection efficiency of TEM sampling was unknown and not uniform for different particle sizes, we cannot directly compare the number concentrations of the modes and the number of particles seen on TEM grids, nor the mean sizes of the modes and the diameters of individual particles on TEM grids. Another uncertainty in the comparison of TEM images and size distributions is that, for example, small carbonaceous particles may not be distinguishable on the carbon film on a TEM grid. However, we found three different types of particles in all of the analyzed TEM samples and the trimodal shape was seen to some extent in all of the measured size distributions. In this study, we call the smallest particle mode as a fuel originated core (FC) mode, the largest particle mode as a soot mode, and the mode in between these two as a lubricating oil originated core (LC) mode. The terminology is based on the origin of these modes discussed later in this section. According to the observation of TEM samples, the number of LC mode particles seen on the TEM grids decreased with the decreasing engine torque. A similar decreasing trend was observed in the visibility of the LC mode in the measured size distributions as seen in while moving from the test point ISO 5 to ISO 6 and further to ISO 7.
In , the dilution-corrected size distributions measured with the Nano-SMPS and Long-SMPS are complemented with lognormal fits for three different modes and the sum of these fits. The lognormal fits were obtained by minimizing the difference between the sum of fits and the measured size distribution by using a numerical algorithm based on the Nelder–Mead simplex method (Lagarias et al. Citation1998). Free parameters in the minimizing process were the geometric mean diameter (GMD), the geometric standard deviation (GSD), and the particle concentration (N). In the two-stage minimizing process, the parameter values were defined at first for the soot mode by manually limiting the size range for large particle sizes and after that for the FC and LC modes. The initial values for the free parameters and the minimizing process were defined manually, but the process was not sensitive to the selection of these values. A few of the obtained fits were omitted because the fitting process was not succeeded. In most of the cases, the fitting process was successful and shows three examples of them. As seen in , the lognormal fits agreed well with the measured size distributions. The only repeatedly seen discrepancy was that the fits did not fully correspond to the measured size distributions between the LC mode and the soot mode. This was probably due to some limitations of the Nano-SMPS in the lower end of the measured size distributions, which may have resulted in excessively narrow lognormal fits for the FC mode, and thus in a shift toward smaller particle sizes and a narrower shape in the LC mode. However, this was an issue related to all the distributions and it did not prevent to see the relative changes in the modes, such as the decrease of the number concentration of the LC mode with the decreasing engine torque seen in .
All the data obtained from the fitting and minimizing process is seen in , in which the parameters including the GMD, GSD, and the particle concentration N are plotted as a function of the engine torque and speed, separately for all the three particle modes. In order to estimate the changes of the parameter values as a function of the engine torque and speed, separate fits for each particle mode and parameter were calculated and they are also seen in . For the GSD, these fits were chosen to be linear and, for the GMD and N, they were exponential. The parameter GSD was found to remain unchanged both as a function of the engine torque and speed for all the particle modes. This is reasonable and supports the reliability of the fitting process, even though the problems of the process were also seen in the relatively small values of GSD (i.e., narrow modes) for the FC and LC modes, as well as in the relatively large deviation in the GSD values for the soot mode. The latter was probably caused by the relatively small concentrations of the soot mode compared to the other modes together with the overlapping of the modes. Also the parameter GMD was found to remain unchanged as a function of the engine torque and speed despite the case for the soot mode and engine speed. The soot mode GMD was namely found to decrease as a function of the engine speed. The fitting parameters should be looked at as a whole, and the deviation of the data points in together with the challenges of the lognormal fits discussed earlier () also describes the uncertainty of the fitting process. However, the behavior of the parameters as a whole and some clear trends revealed by the data set are in line with other conclusions based on the raw size distributions and TEM analysis.
Figure 3. The parameters including the geometric mean diameter (GMD), the geometric standard deviation (GSD), and the particle concentration (N) as a function of the engine torque and speed. Solid lines represent linear (for GSD) or exponential fits (GMD and N) separately shown for each particle mode. Various fuels including fossil diesel, soybean methyl ester (SME), rapeseed methyl ester (RME), and renewable paraffinic diesel (RPD) are distinguished with different marker shapes.
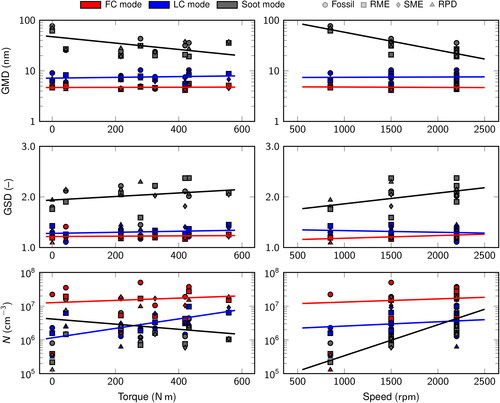
The most interesting result of the fitting process was seen in the particle concentration (N) parameter as a function of the engine torque (). For the FC mode, the particle concentration was not dependent on the engine torque, but for the LC mode and the soot mode, there could be seen a tradeoff in the particle concentrations of these two modes. In other words, the concentration of the soot mode decreased with the increasing engine torque while the concentration of the LC mode increased. A similar tradeoff was also seen by Lähde et al. (Citation2010) for a soot mode and a core mode that was concluded to be originated from lubricating oil. As a function of the engine speed, the particle concentration clearly increased for the soot mode but was remained unchanged for the FC mode and the LC mode. The increase of the soot mode concentration as function of the engine speed is connected to the decrease of the mode GMD. For the other trends seen in the mode concentrations, similar connections to the change of the mode GMD were not clearly seen. It is still possible that some trends are not visible with this sort of an analysis based on mode fitting parameters. The idling may also be problematic with respect to the trends as a function of the engine torque since it is such an unique driving mode compared to the others.
3.2. Effect of fuel
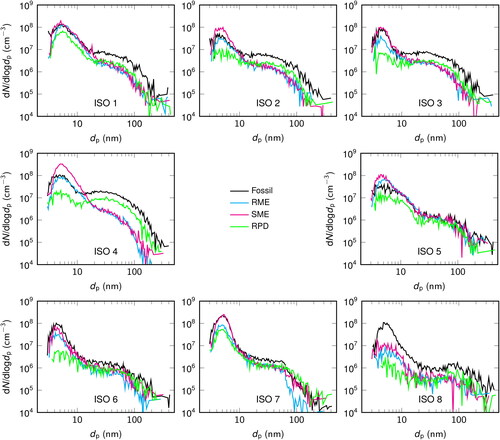
Also the four different fuels are distinguished in with the marker shape. However, there cannot be seen any clear trend in the parameter values with respect to the fuel. That is partly due to the lack of such trend for several parameters, but also due to the overlap of different markers and a limited resolution of the figures in some cases. In order to take a closer look at the effect of fuel on particle size distributions, shows the particle size distributions for different fuels and separately for different test points. One of the most visible differences was that the soot mode concentrations of the fossil fuel were clearly higher compared to other fuels for the test points ISO 1–4 but not for the test points ISO 5–7. Another clear trend was that the FC mode concentrations of RPD were the lowest with respect to other fuels for all the test points. The effect of fuel was seen at the most for the test point ISO 4 which is a low load and medium speed test point. The size distributions for SME and RME were found to be close to each other for all the test points. At the high load test point ISO 5, in which the LC mode was clearly seen, it can be seen that the LC mode was very similar for different fuels and had only slightly lower concentrations for RPD compared to other fuels. However, at the same test point, the concentration of the FC mode showed much more variation with respect to different fuels. All in all, the qualitative analysis based on the size distributions in indicates that the FC mode was more influenced by the fuel than the LC mode. In addition, the soot mode was consistently larger for the fossil fuel than for the renewable fuels, which is in line with previous studies and the established explanation of its origin in the fuel combustion.
Figure 4. Particle size distributions for different fuels including fossil diesel fuel, soybean methyl ester (SME), rapeseed methyl ester (RME), and renewable paraffinic diesel (RPD). The distributions are shown separately for all the test points (ISO 1–8).
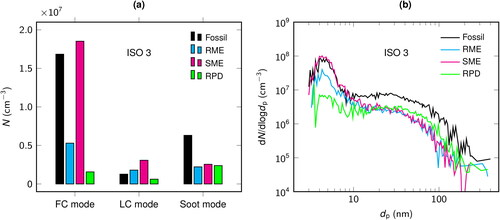
Even though the fitting parameters may not show the effect of fuel as clearly as the closer look on the measured size distributions, some of the conclusions can also be drawn from the numerical comparison of the parameters. shows an example of the particle concentration parameters of different modes for the test point ISO 3 in which the fitting process was successful for all the fuels and particle modes. First of all, the most visible differences in the corresponding measured size distribution between the different fuels () are also seen in the particle concentration parameter values (); that is, the over two times higher soot mode concentration of the fossil fuel compared to the renewable fuels and the huge variation of the FC mode concentration between different fuels in terms of absolute particle concentration. Furthermore, the variation of the LC mode concentration between different fuels is rather small in terms of absolute concentration and the LC mode concentration seems not to be influenced by the fuel as much as the FC mode and the soot mode. It is still evident that the relative changes in the concentration of the LC mode between different fuels are notable. However, in the fitting process, there is always higher uncertainty and noise level of those modes that are smaller than the others dominating the total concentration, and the relative changes in the LC mode concentration should not paid too much attention to, at least in the case of the test point ISO 3 in which the LC mode is small compared the FC mode and the soot mode. Unfortunately, the fitting process was not successful with respect to all the fuels in the test point ISO 5 in which the LC mode concentration would be higher, and we have to rely on the qualitative analysis based on the measured size distributions.
Figure 5. (a) The particle concentration (N) of different modes separately shown for different fuels as an example for the test point ISO 3. (b) The corresponding measured size distributions for the test point ISO 3 are also shown.
3.3. Morphology and composition of particles
The TEM micrographs enabled analyzing the morphology of individual particles. shows examples of individual FC mode particles, LC mode particles, and soot mode particles. In , several individual small particles most probably representing the FC mode particles can be seen. Some of them are rather well visible but the smallest ones can hardly be distinguished on the carbon film of a TEM grid. The largest particle in this example micrograph are approximately 14 nm in diameter and the smallest visible particles approximately 5 nm. The resolution of the micrograph imposes restrictions on the morphology analysis, but it seems that the shape of these particles is not perfectly spherical but slightly irregular, similar to the primary particles of soot agglomerates. The EDS analysis of these particles did not reveal any elements except the ones always present in the EDS analysis with the used grids and microscope setup, such as carbon and oxygen. This does not prove that, for example, any metallic elements would not have been present because the particles were very small for the EDS analysis, but, together with the poor visibility of 5 nm particles on the carbon film of a TEM grid, this may indicate carbonaceous composition of the particles. In addition to the size distribution results and the effect of different fuels on the FC mode, also the information obtained from the TEM micrographs supports the conclusion that these particles would be fuel originated. Nevertheless, the limited resolution of the TEM micrographs restricts the reliability of these conclusions.
Figure 6. Transmission electron microscopy (TEM) micrographs showing individual (a) fuel originated core (FC) mode particles, (b) lubricating oil originated (LC) mode particles, and (c) soot mode particles.
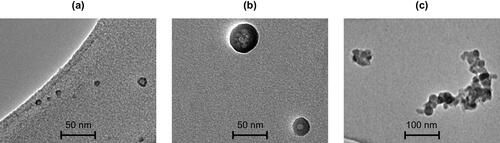
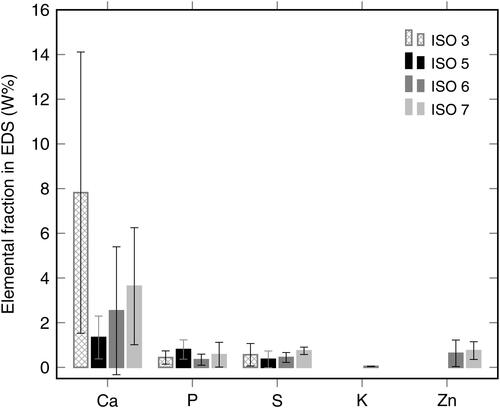
In , two individual LC mode particles are seen. The larger particle is slightly above 40 nm in diameter and the smaller is approximately 25 nm. These two examples represent well the LC mode particles that were seen on the TEM grids as dark-colored droplet-like particles with a regular spherical shape. Common for all these particles was also that they tended to be unstable under the beam of the electron microscope. This sort of beam sensitive behavior in the electron microscope is also possible for particles that are defined as nonvolatile with respect to the TD sampling. However, fresh soot particles are not sensitive to the electron beam (see, e.g., Pirjola et al. Citation2017), and thus the sensitivity of the LC mode particles refers to completely different composition compared to the soot particles. Because the collection efficiency of TEM sampling was not uniform for different particle sizes, the diameter of the LC mode particles was in general larger than the size distribution measurement and the mode fitting analysis would have predicted. The results of the EDS analyses carried out for individual LC mode particles is seen in , including the data from 2, 15, 3, and 5 individual particles from the test points ISO 3, ISO 5, ISO 6, and ISO 7, respectively. The 15 individual particles from the test point ISO 5 included 3–4 particles sampled with each fuel, but no significant difference was found between different fuels. The main result of the EDS analyses for the LC mode particles was that elements such as calcium, phosphorous, and sulfur were found in the particles regardless of the test point and fuel. In addition, zinc was found in the samples of the test points ISO 6 and ISO 7, and a relatively small amount of potassium in the samples of the test point ISO 6. All of these elements, except potassium, are found in the lubricating oil used in the engine in these experiments. The results of the EDS analyses strongly support the conclusion that the LC mode particles are lubricating oil originated.
Figure 7. The elemental fraction of calcium (Ca), phosphorous (P), sulfur (S), potassium (K), and zinc (Zn) found in energy-dispersive X-ray spectroscopy (EDS) analyses of lubricating oil originated core (LC) mode particles. The analyses were carried out for several individual particles, separately shown for driving modes ISO 3, ISO 5, ISO 6, and ISO 7. The error bars represent the standard deviations. Note that the elements always shown in the EDS analysis with the used grids and microscope setup, such as carbon and oxygen, are not shown in the figure. Furthermore, the elemental fractions of the shown elements can only be assessed with respect to each other, not with respect to the fraction of carbon and oxygen.
3.4. Particle formation mechanisms
The main result of this study is the observation of three separate particle modes in the size distribution of nonvolatile particles. Reliable explanations on the formation of these particles are beyond the scope of this study but some hypotheses can be made and others excluded. As pointed out in Section 1, the previous studies have suggested that the core particles would be formed of either metallic elements or amorphous carbon. The latter has been supported by flame experiments in which the formation of core particles has been found to be closely connected to the soot formation in high temperatures (Sgro et al. Citation2008). One possible explanation for the formation of carbonaceous core particles is the break up or fragmentation of soot particles during oxidation (Neoh, Howard, and Sarofim Citation1985). On the other hand, Lähde et al. (Citation2014) ended up to a conclusion that the core particles in diesel engine exhaust were metallic ash formed from lubricating oil also in high temperatures referring to in-cylinder processes but independent on the soot formation. Our hypothesis is that, in the case of this study, the FC mode particles and soot particles are formed during the fuel combustion inside the cylinder and they are dependent on each other. In our case, a modern diesel engine with a relatively low soot emissions may favor the formation of carbonaceous core particles. Furthermore, we suggest that the LC mode particles are formed from lubricating oil independently on the other two modes. The spherical shape of these particles indicate that they have been in liquid phase at some point. The independent formation of different particle modes is possible temporally at different stages of the four-stroke engine cycle or spatially at different regions inside the cylinder.
According to our hypothesis on the particle formation, all the three modes of nonvolatile particles exist at the exhaust valve of the engine cylinder. At this point, the concentrations, especially for the FC mode particles, are very high. Therefore, we wanted to investigate the effect of coagulation on the size distribution before the first dilution of the sampling. In the Supplementary Material, there is a table of delay times, temperatures, and pressures corresponding to this region for different test points and fuels (Table S1). It is notable, that the delay times are in general very short because the sample was taken from a location that was very close to the engine in the exhaust line. Coagulation was modeled with a sectional aerosol model. At first, we investigated the effect of coagulation on a bimodal input size distribution including the FC mode and the soot mode (Figure S2). With a realistic delay time or with a tenfold delay time, the effect of coagulation cannot be seen. With a hundredfold delay time, the effect of coagulation can be seen, but the bimodal input size distribution would not in any case account for the shape of the measured size distributions. Also, by increasing the concentration of the FC mode by a factor of hundred, the effect of coagulation on the bimodal size distribution with a realistic delay time remains small (Figure S3). These cases can also be used as a rough estimate for in-cylinder processes because the effect of pressure and temperature on coagulation is comparable to the effect of delay time. Finally, we used the measured trimodal size distribution as an input and tested the effect of coagulation on that with different delay times (Figure S4). Also in this case, the effect of coagulation was small on the shape of the size distribution even with a hundredfold delay time. These modeling results support the hypothesis of two separate core particle modes that can be formed independently on each other and also be measured after the tailpipe.
4. Summary and conclusions
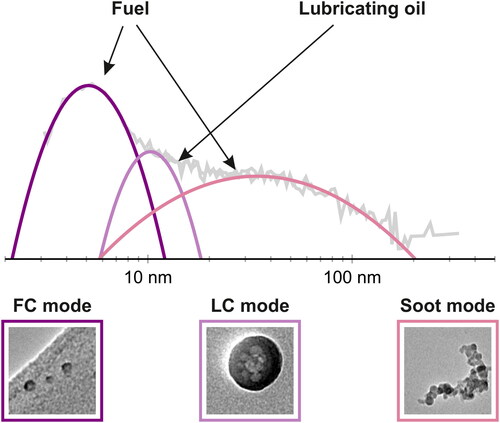
The nonvolatile fraction of the ultrafine particulate emissions of a non-road diesel engine was studied from the engine-out location in an engine laboratory experiment. Based on the particle size distributions as well as electron microscopy micrographs and elemental analyses, we were able to divide the nonvolatile fraction of particles into three different types of particles and three different particle modes. shows a summarizing schematic of the results of this study: a size distribution with three nonvolatile particle modes, most probable origins for these modes, and examples of electron microscopy micrographs of each particle types with different morphologies. The first and the smallest mode in particle size, named as a fuel originated core (FC) mode in this study, was found have highest particle concentration and it was affected by fuel changes. Compared to that, the second mode, named as a lubricating oil originated core (LC) mode, had lower number concentrations and larger mean particle sizes. The LC mode particles contained lubricating oil derived metallic elements that confirmed its origin, and the concentration of this mode was affected by the engine torque. The increase in the engine torque typically increases the in-cylinder peak temperatures and peak pressures, likely affecting the presence of engine oil components in the gas mixture inside the cylinder. The spherical shape of these particles indicate that they have been in liquid phase at some point, but, in order to say more about the formation mechanisms, further research is required. The third observed nonvolatile particle mode was a soot mode having number concentrations comparable to the LC mode. The soot mode concentration was affected by the engine torque, likely due to the effects of in-cylinder conditions on the soot formation and oxidation. The soot mode was also clearly affected by fuel changes.
Figure 8. A schematic of a size distribution with three different nonvolatile particle modes and the most probable origins for these particles. The modes are a fuel originated core (FC) mode, lubricating oil originated core (LC) mode, and a soot mode.
Previous studies on exhaust nanoparticles have indicated two possible compositions and origins for nonvolatile core particles. This study showed that both of these are possible, even in one engine application. Importantly, these two particle types were found to form two separate particle modes. This a significant result that may also lead to a new interpretation of previously published data. For example, the results reported by Lähde et al. (Citation2010) indicate that the size distribution measured under high load may have consisted of three modes including two different core modes.
Therefore, the exhaust aerosol can be said to be externally mixed with particles having different physical and chemical characteristics. This may have implications especially with respect to the potential health effects of particles. For instance, the LC mode particles including metallic elements may end up human brains via the olfactory bulb as proposed by Maher et al. (Citation2016). The LC mode particles are also in such a size range that they are efficiently deposited in the alveolar region of human lungs (IRCRP Citation1994), and the effect of these particles on human health might be very different from soot particles. The externally mixed aerosol with three different nonvolatile particle modes, partly overlapping in particle size with each other, is also a huge challenge, for example, for the collection of particles in toxicological experiments. This has to be taken into account in designing relevant experiments or collection methods. Furthermore, the externally mixed aerosol with different sizes and chemical components of nonvolatile particles may also affect the functioning of diesel particulate filters (DPF), and it has to be taken into account in the design of these.
The results of this study showed that both lubricating oil and fuel affect the nonvolatile particle fraction emitted by a diesel engine. This highlights the importance of further development of these technologies. Development and changes in fuel or lubricating oil composition may have effect on nonvolatile emission particles, which would be important especially for vehicles not equipped with a proper DPF. These can be older vehicles, vehicles in which the DPF is damaged, or vehicles in those countries in which the regulation does not require the installation of filters. Often those countries are also having the worst air quality problems in their cities and a lot of population that is exposed to the vehicle emissions.
Supplemental Material
Download PDF (379.6 KB)Acknowledgments
The authors acknowledge all the personnel of the engine laboratory at University of Vaasa. Dr. Anssi Arffman is acknowledged for providing the HRLPI instrument for the experiments.
Additional information
Funding
References
- Alanen, J., E. Saukko, K. Lehtoranta, T. Murtonen, H. Timonen, R. Hillamo, P. Karjalainen, H. Kuuluvainen, J. Harra, J. Keskinen, et al. 2015. The formation and physical properties of the particle emissions from a natural gas engine. Fuel 162:155–61. doi:10.1016/j.fuel.2015.09.003.
- Amanatidis, S., L. Ntziachristos, P. Karjalainen, E. Saukko, P. Simonen, N. Kuittinen, P. Aakko-Saksa, H. Timonen, T. Rönkkö, and J. Keskinen. 2018. Comparative performance of a thermal denuder and a catalytic stripper in sampling laboratory and marine exhaust aerosols. Aerosol Sci. Technol. 52 (4):420–32. doi:10.1080/02786826.2017.1422236.
- Arffman, A., J. Yli-Ojanperä, J. Kalliokoski, J. Harra, L. Pirjola, P. Karjalainen, T. Rönkkö, and J. Keskinen. 2014. High-resolution low-pressure cascade impactor. J. Aerosol Sci. 78:97–109. doi:10.1016/j.jaerosci.2014.08.006.
- Burnett, R., H. Chen, M. Szyszkowicz, N. Fann, B. Hubbell, C. A. Pope, J. S. Apte, M. Brauer, A. Cohen, S. Weichenthal, et al. 2018. Global estimates of mortality associated with long-term exposure to outdoor fine particulate matter. Proc. Natl. Acad. Sci. USA 115 (38):9592–7., doi:10.1073/pnas.1803222115.
- Carbone, S., H. Timonen, A. Rostedt, M. Happonen, T. Rönkkö, J. Keskinen, J. Ristimäki, H. Korpi, P. Artaxo, M. Canagaratna, et al. 2019. Distinguishing fuel and lubricating oil combustion products in diesel engine exhaust particles. Aerosol Sci. Technol. 53 (5):594–607. doi:10.1080/02786826.2019.1584389.
- Chen, R., P. Yin, X. Meng, L. Wang, C. Liu, Y. Niu, Y. Liu, J. Liu, J. Qi, J. You, et al. 2019. Associations between coarse particulate matter air pollution and cause-specific mortality: A nationwide analysis in 272 Chinese cities. Environ. Health Perspect. 127 (1):17008. doi:10.1289/EHP2711.
- Cohen, A., M. Brauer, R. Burnett, H. Anderson, J. Frostad, K. Estep, K. Balakrishnan, B. Brunekreef, L. Dandona, R. Dandona, et al. 2017. Estimates and 25-year trends of the global burden of disease attributable to ambient air pollution: An analysis of data from the global burden of diseases study 2015. Lancet 389 (10082):1907–18. doi:10.1016/S0140-6736(17)30505-6.
- De Filippo, A., and M. M. Maricq. 2008. Diesel nucleation mode particles: Semivolatile or solid? Environ. Sci. Technol. 42 (21):7957–62. doi:10.1021/es8010332.
- Fu, P., X. Guo, F. Cheung, and K. Yung. 2019. The association between PM2.5 exposure and neurological disorders: A systematic review and meta-analysis. Sci. Total Environ. 655:1240–8. doi:10.1016/j.scitotenv.2018.11.218.
- Fushimi, A., K. Saitoh, Y. Fujitani, S. Hasegawa, K. Takahashi, K. Tanabe, and S. Kobayashi. 2011. Organic-rich nanoparticles (diameter: 10–30 nm) in diesel exhaust: Fuel and oil contribution based on chemical composition. Atmos. Environ. 45 (35):6326–36. doi:10.1016/j.atmosenv.2011.08.053.
- Giechaskiel, B., A. Mamakos, J. Andersson, P. Dilara, G. Martini, W. Schindler, and A. Bergmann. 2012. Measurement of automotive nonvolatile particle number emissions within the European legislative framework: A review. Aerosol Sci. Technol. 46 (7):719–49. doi:10.1080/02786826.2012.661103.
- Giechaskiel, B., and G. Martini. 2014. Engine exhaust solid sub-23 nm particles: II. Feasibility study for particle number measurement systems. SAE Int. J. Fuels Lubr. 7 (3):935–49. doi:10.4271/2014-01-2832.
- Heikkilä, J., T. Rönkkö, T. Lähde, M. Lemmetty, A. Arffman, A. Virtanen, J. Keskinen, L. Pirjola, and D. Rothe. 2009a. Effect of open channel filter on particle emissions of modern diesel engine. J. Air Waste Manage. Assoc. 59 (10):1148–54. doi:10.3155/1047-3289.59.10.1148.
- Heikkilä, J., A. Virtanen, T. Rönkkö, J. Keskinen, P. Aakko-Saksa, and T. Murtonen. 2009b. Nanoparticle emissions from a heavy-duty engine running on alternative diesel fuels. Environ. Sci. Technol. 43 (24):9501–6. doi:10.1021/es9013807.
- Helin, A., J. Niemi, A. Virkkula, L. Pirjola, K. Teinilä, J. Backman, M. Aurela, S. Saarikoski, T. Rönkkö, E. Asmi, et al. 2018. Characteristics and source apportionment of black carbon in the Helsinki metropolitan area, Finland. Atmos. Environ. 190:87–98. doi:10.1016/j.atmosenv.2018.07.022.
- Ihalainen, M., P. Jalava, T. Ihantola, S. Kasurinen, O. Uski, O. Sippula, A. Hartikainen, J. Tissari, K. Kuuspalo, A. Lähde, et al. 2019. Design and validation of an air–liquid interface (ALI) exposure device based on thermophoresis. Aerosol Sci. Technol. 53 (2):133–45., doi:10.1080/02786826.2018.1556775.
- IRCRP. 1994. Human respiratory tract model for radiological protection. A report of a Task Group of the International Commission on Radiological Protection. Ann. ICRP 24:1–482. doi:10.1093/annhyg/38.inhaled_particles_VII.251.
- Karjalainen, P., L. Pirjola, J. Heikkilä, T. Lähde, T. Tzamkiozis, L. Ntziachristos, J. Keskinen, and T. Rönkkö. 2014. Exhaust particles of modern gasoline vehicles: A laboratory and an on-road study. Atmos. Environ. 97:262–70. doi:10.1016/j.atmosenv.2014.08.025.
- Karjalainen, P., S. Saari, H. Kuuluvainen, T. Kalliohaka, A. Taipale, and T. Rönkkö. 2017. Performance of ventilation filtration technologies on characteristic traffic related aerosol down to nanocluster size. Aerosol Sci. Technol. 51 (12):1398–408. doi:10.1080/02786826.2017.1356904.
- Kittelson, D. B. 1998. Engines and nanoparticles: A review. J. Aerosol Sci. 29 (5–6):575–88. doi:10.1016/S0021-8502(97)10037-4.
- Lagarias, J., J. Reeds, M. Wright, and P. Wright. 1998. Convergence properties of the Nelder–Mead simplex method in low dimensions. SIAM J. Optim. 9 (1):112–47. doi:10.1137/S1052623496303470.
- Lähde, T., T. Rönkkö, M. Happonen, C. Söderström, A. Virtanen, A. Solla, M. Kytö, D. Rothe, and J. Keskinen. 2011. Effect of fuel injection pressure on a heavy-duty diesel engine nonvolatile particle emission. Environ. Sci. Technol. 45 (6):2504–9. doi:10.1021/es103431p.
- Lähde, T., T. Rönkkö, A. Virtanen, T. Schuck, L. Pirjola, K. Hämeri, M. Kulmala, F. Arnold, D. Rothe, and J. Keskinen. 2009. Heavy duty diesel engine exhaust aerosol particle and ion measurements. Environ. Sci. Technol. 43 (1):163–8. doi:10.1021/es801690h.
- Lähde, T., T. Rönkkö, A. Virtanen, A. Solla, M. Kytö, C. Söderström, and J. Keskinen. 2010. Dependence between nonvolatile nucleation mode particle and soot number concentrations in an EGR equipped heavy-duty diesel engine exhaust. Environ. Sci. Technol. 44 (8):3175–80. doi:10.1021/es903428y.
- Lähde, T., A. Virtanen, M. Happonen, C. Söderström, M. Kytö, and J. Keskinen. 2014. Heavy-duty, off-road diesel engine low-load particle number emissions and particle control. J. Air Waste Manage. Assoc. 64 (10):1186–94. doi:10.1080/10962247.2014.936985.
- Lee, D., A. Miller, D. Kittelson, and M. Zachariah. 2006. Characterization of metal-bearing diesel nanoparticles using single-particle mass spectrometry. J. Aerosol Sci. 37 (1):88–110. doi:10.1016/j.jaerosci.2005.04.006.
- Lelieveld, J., J. Evans, M. Fnais, D. Giannadaki, and A. Pozzer. 2015. The contribution of outdoor air pollution sources to premature mortality on a global scale. Nature 525 (7569):367–71. doi:10.1038/nature15371.
- Li, X., L. Jin, and H. Kan. 2019. Air pollution: A global problem needs local fixes. Nature 570 (7762):437–9. doi:10.1038/d41586-019-01960-7.
- Liati, A., D. Schreiber, Y. Arroyo Rojas Dasilva, and P. Dimopoulos Eggenschwiler. 2018. Ultrafine particle emissions from modern gasoline and diesel vehicles: An electron microscopic perspective. Environ. Pollut. 239:661–9. doi:10.1016/j.envpol.2018.04.081.
- Maher, B., I. Ahmed, V. Karloukovski, D. MacLaren, P. Foulds, D. Allsop, D. Mann, R. Torres-Jardón, and L. Calderon-Garciduenas. 2016. Magnetite pollution nanoparticles in the human brain. Proc. Natl. Acad. Sci. USA 113 (39):10797–801. doi:10.1073/pnas.1605941113.
- Mathis, U., J. Ristimäki, M. Mohr, J. Keskinen, L. Ntziachristos, Z. Samaras, and P. Mikkanen. 2004. Sampling conditions for the measurement of nucleation mode particles in the exhaust of a diesel vehicle. Aerosol Sci. Technol. 38 (12):1149–60. doi:10.1080/027868290891497.
- Miller, A., C. Stipe, M. Habjan, and G. Ahlstrand. 2007. Role of lubrication oil in particulate emissions from a hydrogen-powered internal combustion engine. Environ. Sci. Technol. 41 (19):6828–35. doi:10.1021/es070999r.
- Neoh, K., J. Howard, and A. Sarofim. 1985. Effect of oxidation on the physical structure of soot. Symp. (Int.) Combust. 20 (1):951–7. doi:10.1016/S0082-0784(85)80584-1.
- Ntziachristos, L., B. Giechaskiel, P. Pistikopoulos, Z. Samaras, U. Mathis, M. Mohr, J. Ristimäki, J. Keskinen, P. Mikkanen, R. Casati, et al. 2004. Performance evaluation of a novel sampling and measurement system for exhaust particle characterization. SAE Technical Papers. doi:10.4271/2004-01-1439
- Paul, B., A. Datta, A. Datta, and A. Saha. 2013. A comparison of chemical structures of soot precursor nanoparticles from liquid fuel combustion in flames and engine. J. Nanopart. Res. 15 (4), art. no. 1550. doi:10.1007/s11051-013-1550-4.
- Paur, H. R., F. Cassee, J. Teeguarden, H. Fissan, S. Diabate, M. Aufderheide, W. Kreyling, O. Hänninen, G. Kasper, M. Riediker, et al. 2011. In-vitro cell exposure studies for the assessment of nanoparticle toxicity in the lung – A dialog between aerosol science and biology. J. Aerosol Sci. 42 (10):668–92. doi:10.1016/j.jaerosci.2011.06.005.
- Pirjola, L., P. Karjalainen, J. Heikkilä, S. Saari, T. Tzamkiozis, L. Ntziachristos, K. Kulmala, J. Keskinen, and T. Rönkkö. 2015. Effects of fresh lubricant oils on particle emissions emitted by a modern gasoline direct injection passenger car. Environ. Sci. Technol. 49 (6):3644–52. doi:10.1021/es505109u.
- Pirjola, L., J. Niemi, S. Saarikoski, M. Aurela, J. Enroth, S. Carbone, K. Saarnio, H. Kuuluvainen, A. Kousa, T. Rönkkö, et al. 2017. Physical and chemical characterization of urban winter-time aerosols by mobile measurements in Helsinki, Finland. Atmos. Environ. 158:60–75. doi:10.1016/j.atmosenv.2017.03.028.
- Rönkkö, T., A. Arffman, P. Karjalainen, T. Lähde, J. Heikkilä, L. Pirjola, D. Rothe, and J. Keskinen. 2011. Diesel exhaust nanoparticle volatility studies by a new thermodenuder with low solid nanoparticle losses. Technology 43:9501–6.
- Rönkkö, T., A. Virtanen, J. Kannosto, J. Keskinen, M. Lappi, and L. Pirjola. 2007. Nucleation mode particles with a nonvolatile core in the exhaust of a heavy duty diesel vehicle. Environ. Sci. Technol. 41 (18):6384–9. doi:10.1021/es0705339.
- Sakurai, H., H. Tobias, K. Park, D. Zarling, K. Docherty, D. Kittelson, P. McMurry, and P. Ziemann. 2003. On-line measurements of diesel nanoparticle composition and volatility. Atmos. Environ. 37 (9–10):1199–210. doi:10.1016/S1352-2310(02)01017-8.
- Seong, H., S. Choi, and K. Lee. 2014. Examination of nanoparticles from gasoline direct-injection (GDI) engines using transmission electron microscopy (TEM). Int. J. Automot. Technol. 15 (2):175–81. doi:10.1007/s12239-014-0019-5.
- Sgro, L. A., A. Borghese, L. Speranza, A. C. Barone, P. Minutolo, A. Bruno, A. D'Anna, and A. D'Alessio. 2008. Measurements of nanoparticles of organic carbon and soot in flames and vehicle exhausts. Environ. Sci. Technol. 42 (3):859–63. doi:10.1021/es070485s.
- Sgro, L., P. Sementa, B. Vaglieco, G. Rusciano, A. D’Anna, and P. Minutolo. 2012. Investigating the origin of nuclei particles in GDI engine exhausts. Combust. Flame 159 (4):1687–92. doi:10.1016/j.combustflame.2011.12.013.
- Thiruvengadam, A., M. Besch, S. Yoon, J. Collins, H. Kappanna, D. Carder, A. Ayala, J. Herner, and M. Gautam. 2014. Characterization of particulate matter emissions from a current technology natural gas engine. Environ. Sci. Technol. 48 (14):8235–42. doi:10.1021/es5005973.