
 ?Mathematical formulae have been encoded as MathML and are displayed in this HTML version using MathJax in order to improve their display. Uncheck the box to turn MathJax off. This feature requires Javascript. Click on a formula to zoom.
Abstract
Environmental chamber studies are widely employed to investigate atmospheric chemistry and aerosol formation. However, the large surface area-to-volume ratio of a chamber leads to effects that need to be accounted for in order to apply the results of chamber studies to the ambient atmosphere. These include, but are not limited to, gas-wall partitioning and particle deposition to walls, both of which can impact quantification of reaction products. Here, a low-cost vaporizer was developed to provide a means to rapidly create well-characterized organic vapors and aerosol particles inside the chamber. This in situ approach eliminates the losses to surfaces that can occur when organic gases or particles are created in a device outside the chamber and then transported inside through tubing, thus providing a simple means for achieving quantitative addition. Thermally stable volatile organic compounds can be added to the chamber within ∼1 min, which allows for accurate measurements of gas-wall partitioning timescales and equilibrium using gas chromatography. The vaporizer can also be used to create low-volatility organic aerosol particles with a mean diameter of ∼150 nm and selectable mass concentration as low as 5 µg m−3 via homogeneous nucleation within a few minutes. Such an aerosol can be used to calibrate or evaluate the performance of instruments such as the scanning mobility particle sizer in laboratory and field studies.
Copyright © 2020 American Association for Aerosol Research
EDITOR:
Introduction
Environmental chambers have been used for decades to simulate and investigate atmospheric reactions and to inform chemical transport models used to determine the impacts of atmospheric processing of emissions on air quality and climate (Finlayson-Pitts and Pitts Jr. Citation2000; Burkholder et al. Citation2017). The walls of chambers can be stainless steel (Duplissy et al. Citation2010; Wang et al. Citation2011), glass (Behnke et al. Citation1988), or Teflon (Hallquist et al. Citation2009), with the latter material being the most widely used because of its flexibility, low cost, suitability for construction of chambers of almost any size, and relative chemical inertness. These chambers have a much higher surface area-to-volume ratio than the atmosphere, however, which results in partitioning of gases and deposition of particles to Teflon walls that can impact measurements of yields and properties of reaction products and secondary organic aerosol (SOA). Although particle deposition can be routinely characterized using a variety of methods (Wang et al. Citation2018), gas-wall partitioning of gases is more difficult to quantify. Measurements have typically involved the addition of selected VOCs to the chamber (which in some cases were converted to more oxidized reaction products by photooxidation), followed by time-resolved measurements of VOC gas-phase concentrations using gas chromatography (Matsunaga and Ziemann Citation2010; Yeh and Ziemann Citation2015) or online mass spectrometry (Zhang et al. Citation2015; Krechmer et al. Citation2016, Citation2017). These studies have shown that gas-wall partitioning can be significant for volatile organic compounds (VOCs) with saturation vapor concentrations (C*) < 105 µg m−3 and that equilibrium is reached on timescales of ∼10–60 min in Teflon chambers, with subsequent diffusion into the Teflon film leading to additional slow partitioning that occurs on timescales of many hours (Matsunaga and Ziemann Citation2010; Huang et al. Citation2018).
When measuring gas-wall partitioning it is important to be able to add organic compounds rapidly and quantitatively, which can be a challenge when using a transfer line to connect the VOC source to the chamber. Although it is possible to rapidly create organic compounds of interest in situ through VOC photooxidation (Zhang et al. Citation2015; Krechmer et al. Citation2016, Citation2017; Liu et al. Citation2019a), and to avoid delays or losses in transfer lines (Pagonis et al. Citation2017; Deming et al. Citation2019; Liu et al. Citation2019b) during VOC addition by using a heated glass bulb with a short neck (Matsunaga and Ziemann Citation2010; Yeh and Ziemann Citation2014, Citation2015), a simpler, more versatile approach would be valuable. Therefore, as part of an effort to develop a standard procedure for quantifying gas-wall partitioning in environmental chambers we have designed, constructed, and evaluated a low-cost vaporizer for rapid, quantitative, in situ addition of thermally stable organic compounds. This device can be used with either gas chromatography (GC), a method that is available in many laboratories, or online mass spectrometry to measure gas-wall partitioning timescales and equilibrium.
The vaporizer also provides a convenient way to rapidly create low-volatility, spherical organic aerosol particles with known composition, a relatively narrow size distribution, and a large range of selectable mass concentrations in situ. This capability offers clear advantages over commonly used flow methods for aerosol generation, such as evaporation-condensation (Muir Citation1965) and nebulization of solutions (May Citation1973). Both of those methods create aerosols that are transported into a chamber from outside using tubing, and the particles must be subsequently analyzed using instruments that have their own measurement uncertainties. Particle losses to the walls that occur during aerosol generation and in the transfer line result in non-quantitative particle generation methods, and as such rely on the accuracy of instruments such as the scanning mobility particle sizer (SMPS) or aerosol mass spectrometer (AMS) for measurements of mass concentrations. The vaporizer described here can instead directly generate known aerosol mass concentrations within the chamber, which to our knowledge is the first time this has been demonstrated. The particles can then be used to calibrate or evaluate the accuracy of an SMPS or AMS for measurements of aerosol mass concentration, as well as for studies of gas-particle partitioning (Robinson, Saleh, and Donahue Citation2015; Krechmer et al. Citation2017; Liu et al. Citation2019a), heterogeneous/multiphase chemistry (Ziemann Citation2005; Docherty and Ziemann Citation2006; Sage et al. Citation2009), and seeded SOA experiments (Reed Harris et al. Citation2017).
Experimental
Vaporizer design
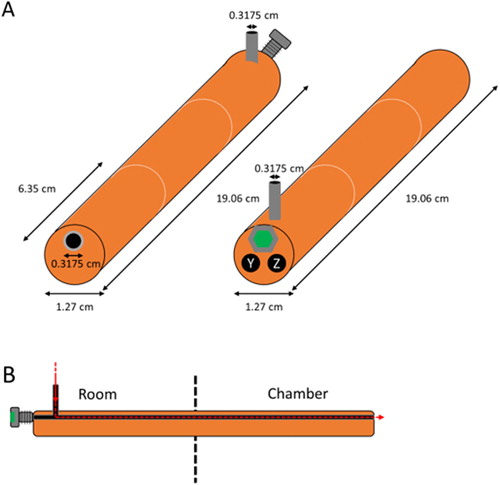
A schematic of the vaporizer is shown in . The vaporizer is a 19.05 cm long × 1.27 cm O.D. copper cylinder, constructed by brazing together three 6.35 cm long sections of copper. Two 0.318 cm diameter holes were bored through 17.8 cm of the length of the copper cylinder to provide space for a cartridge heater (17.8 cm × 0.31 cm diameter, Watlow Model #2063-8514) and Type J thermocouple, respectively, as shown in as Y and Z. The cartridge heater, controlled by a Variac power supply, resistively heats the copper block. A third 0.318 cm hole was bored through the entire length of the vaporizer to allow for addition of organic compounds into the chamber. This hole is lined with a 0.318 cm O.D., 0.159 cm I.D. stainless-steel tube to prevent surface reactions of organic compounds with the heated copper and is sealed by a 405-nut fit with an Alltech thermal green septum used for gas chromatographs. This tube is connected via a T-junction for airflow through a 0.318 cm O.D., 0.159 cm I.D. stainless-steel tube 0.5 cm from the side where all three holes were drilled. This guarantees that the airflow only enters the chamber and allows for introduction of organic compounds into the stainless-steel tube via a syringe needle pierced through the septum, as shown in . The vaporizer is interfaced to the chamber by means of a standard 1.9 cm O.D. Swagelok union that was bored through and mounted on the chamber frame. A brass cylindrical sleeve bearing (Bunting Bearings) that is 2.5 cm long, 1.9 cm O.D., and 1.27 cm I.D. is inserted into the union, it is sealed there using a stainless-steel ferrule and a finger tightened brass nut, and then the vaporizer is inserted into the sleeve bearing. This arrangement insulates the Teflon wall from the hottest part of the vaporizer. We found that particles would be generated in the absence of added material if the vaporizer temperature was increased to 280 °C, but not for the operating temperatures outlined below.
Figure 1. Schematic of the vaporizer. Copper is orange-brown, stainless steel is gray, GC septum is green, holes are black, UHP nitrogen flow is red. (a) Outer view of the vaporizer, with chamber side in front (left) and room side in front (right). The thermocouple is placed in “Y” and cartridge heater is placed in “Z”. (b) Center-cut cross-section of vaporizer, showing UHP N2 flow as a dashed line. The septum is pierced by needle to insert liquid. The vaporizer is interfaced to the chamber by means of a bored-through Swagelok union with a brass cylindrical sleeve.
Gas-wall partitioning experiments
Experiments were conducted in a 6.9 m3 FEP Teflon chamber at ∼25 °C and ∼630 Torr. Clean, dry air (RH < 1%, VOCs and NOx < 5 ppb) was supplied at 160 L min−1 from Aadco 737-14 clean air generators. The procedure used for gas-wall partitioning measurements with the vaporizer was adapted from previous studies that also employed gas chromatography for analysis of organic compounds (Matsunaga and Ziemann Citation2010; Yeh and Ziemann Citation2015). By leveraging the ability of the vaporizer to rapidly and quantitatively add VOCs to the chamber, the method described below provides a routine means for characterizing gas-wall partitioning using instrumentation that is often readily available in atmospheric chemistry laboratories.
Ten Tenax adsorbent cartridges were baked at 250 °C under a gentle stream of ultra-high purity (UHP) N2 the day prior to an experiment. A solution containing 0.11 mole each of C7-C13 2-ketones was prepared without the use of solvents. The solution was drawn into a 50 µL Hamilton syringe with a removable needle by first pulling air, then solution, then more air. This method ensured complete delivery of organic compounds during injection onto the vaporizer and minimized possible measurement errors due to the needle dead volume. The resulting concentration of each ketone in the chamber was ∼100 ppb (where 1 ppb = 2.04 × 10¹⁰ molecules cm−3 at ambient pressure), which is <1% of its saturation vapor pressure at 25 °C calculated using SIMPOL.1 (Pankow and Asher Citation2008). This high degree of undersaturation was chosen in order to prevent possible condensation of ketones on the chamber walls via liquid film formation rather than absorptive partitioning into the Teflon film. The vaporizer was heated to 120 °C and flushed with 250 cm3 min−1 of UHP N2. This temperature and flow rate are suitable for rapid, quantitative addition of 2-ketones into the chamber, and should also work for monofunctional alcohols, nitrates, and carboxylic acids, as well as diols, all of which were shown in previous gas-wall partitioning studies (Yeh and Ziemann Citation2014, Citation2015) to be stable and unreactive when subjected to temperatures up to 250 °C during GC analysis. In addition, it is well established that monofunctional ethers and esters are also stable and unreactive at temperatures above 400 °C (Steacie Citation1933; Hurd and Blunck Citation1938). Conversely, organic peroxides decompose in the neighborhood of 100 °C (Benson and Shaw Citation1970) and multifunctional compounds containing various combinations of hydroxyl, carboxyl, and carbonyl groups may be susceptible to thermal decomposition at temperatures <100 °C (Zhao et al. Citation2020). As such, when using the vaporizer it is recommended that particle- and gas-phase composition be monitored to identify the occurrence of thermal decomposition. The microliter syringe was then pierced through the vaporizer septum, held for 1 min to heat the needle, the VOC mixture was slowly injected into the vaporizer over a period of 30 s, and the needle was maintained in the vaporizer for 1 min to ensure complete addition of VOC to the chamber before removing. At this point a Teflon-coated fan was turned on for 10 s to ensure mixing in the chamber, which is important for accurate measurements of partitioning. The minimum time required to run the fan was determined by experiments in which the CO2 concentration was monitored with a fast-response LI-COR LI-840A CO2 analyzer as pulses of CO2 were added to the chamber while the fan was running. In those experiments, mixing was extensive within 10 s and then complete in ∼25 s (). Running the fan for 10 s therefore provided the necessary mixing on a short timescale without significantly distorting measured gas-wall partitioning timescales, as Krechmer et al. (Citation2016) have shown can occur when the fan is run for longer times. Experiments conducted by adding CO2 and then pulses of 160 L min−1 of clean air led to complete mixing within 4 min (). Although the accuracy of the LI-COR CO2 analyzer was not a factor in these experiments, comparison with the Vaisala probe described below indicates an accuracy to within a few percent.
Immediately following mixing, gas was sampled through a 10 cm long, 0.47 cm I.D., 0.635 cm O.D. PFA Teflon tube at a rate of 250 cm3 min−1, as determined using a Tylan mass flow controller. The time required for the Teflon tube to equilibrate with the VOCs was calculated to be <50 s (Pagonis et al. Citation2017), allowing samples to be collected beginning a few minutes after the completion of VOC addition. Gas samples were collected on Tenax adsorbent cartridges for 2 min each at 2, 5, 8, 13, 23, 45, 80, 120, 180, and 300 min after the completion of VOC addition to the chamber, where each time listed is the sampling midpoint. The spacing of VOC collection was chosen to determine both the fast and slow timescales of gas-wall partitioning (Matsunaga and Ziemann Citation2010; Yeh and Ziemann Citation2015; Krechmer et al. Citation2016; Huang et al. Citation2018), which may be important for quantification depending on the length of a given chamber experiment.
VOCs were analyzed using a Hewlett Packard 6890 gas chromatograph with a flame ionization detector (GC-FID). Tenax tubes were inserted into the injector of the GC-FID, where they were desorbed at 250 °C and carried onto the column (DB-1701 Megabore 30 m × 0.530 mm, 1 µm film thickness) in a 1 mL min−1 flow of UHP helium carrier gas. The column temperature was held at 40 °C for 7 min, ramped to 280 °C at a rate of 8 °C min−1, and then held at 280 °C for 10 min. Tenax cartridges could be analyzed by GC-FID up to 3 d after gas collection with no appreciable change in signal.
In our previous gas-wall partitioning experiments conducted with GC-FID analysis (Matsunaga and Ziemann Citation2010; Yeh and Ziemann Citation2015), VOCs were added over a period of 5 min, the fan was run for 1 min, and the first sample was collected 25 min after VOC addition in order to allow sufficient time for VOC equilibration with the stainless-steel sampling line. This procedure made it difficult to accurately measure short gas-wall partitioning timescales. By instead using the new vaporizer for rapid VOC addition, and a short Teflon sampling line to achieve sub-minute VOC equilibration, it was possible to make a series of tightly spaced measurements beginning almost immediately after VOC addition and fewer measurements later in the experiment, in order to more accurately determine fast and slow timescales for gas-wall partitioning.
Particle seeding experiments
Solutions containing 0.09 to 0.28 M of bis-ethylhexyl sebacate (hereafter referred to as dioctyl sebacate, DOS) in 95:5 v/v acetonitrile:acetone were prepared to accurately add known amounts of DOS to the chamber. These solvent components were chosen in order to make the seeding procedure applicable for studies involving oxidation reactions, with the small amount of acetone required to dissolve the otherwise immiscible DOS. Neither acetonitrile nor acetone reacts with alkylperoxy or alkoxy radicals, O3, or NO3 radicals (Atkinson and Arey Citation2003), and although both can react with OH radicals (Atkinson and Arey Citation2003; Hynes and Wine Citation1991) and acetone can react with stabilized Criegee intermediates produced from ozonolysis of alkenes (Taatjes et al. Citation2012), the reactions are all very slow. For example, at 25 °C and 630 Torr and a chamber volume of 7 m3, 1 µL of solvent injected into the vaporizer yields concentrations of 75 ppb and 2 ppb of acetonitrile and acetone, which for corresponding OH radical rate constants of 2.5 × 10⁻¹⁴ (Hynes and Wine Citation1991) and 1.7 × 10⁻¹³ (Atkinson and Arey Citation2003) cm3 molec−1 s−1 results in an OH reactivity of 0.05 s−1. Since rate constants for almost all other VOCs are > 1 × 10⁻¹² cm3 molec−1 s−1 (Atkinson and Arey Citation2003), for VOC concentrations greater than a few tens of ppb reactions with acetonitrile and acetone would have a negligible effect on the chemistry. And although acetone can react with stabilized Criegee intermediates with a rate constant of 2.3 × 10⁻¹³ cm3 molec−1 s−1 (Taatjes et al. Citation2012), resulting in a reactivity of 0.01 s−1, even at a relative humidity of ∼1% the reactivity with water vapor is ∼103 s−1 (Chao et al. Citation2015).
In each particle seeding experiment, the chamber volume was accurately determined by adding a measured amount of CO2 (determined from the calibrated bulb volume and CO2 pressure measured with a Baratron pressure gauge on a vacuum manifold) to the chamber while measuring the CO2 concentration in the chamber before and after addition with a Vaisala GMT 220 CO2 probe. The probe was calibrated using CO2/zero air mixtures prepared on a vacuum manifold to achieve CO2 concentrations over the range from 0 to 1000 ppm (where 1 ppm = 2.04 × 10¹³ molecules cm−3 at ambient pressure). Based on the accuracy of <1% for the pressure gauge used to prepare the mixtures these values should be accurate to within a similar amount.
The vaporizer was then heated to 230 °C while flowing 250 cm3 min−1 of UHP N2 into the chamber. A 25 µL Hamilton syringe with a removable needle was filled with the DOS solution, first pulling air, then solution, then more air to ensure complete delivery of compound into the vaporizer. The needle was wiped with a Kimwipe to remove any DOS adsorbed to the needle and injected into the vaporizer over a period of ∼10 s. DOS seed particles were formed by homogeneous nucleation due to the rapid cooling once added to the chamber. The needle was maintained in the vaporizer for 1 min and then a Teflon-coated fan was run for 15 s to mix the chamber. In some experiments DOS particles were generated only once, whereas in others the procedure was repeated multiple times. After the final event, particles were collected on two 0.45 µm pore size Teflon filters pre-weighed on a Mettler Toledo XS3DU microbalance (±0.5 µg accuracy) at calibrated flows of ∼14 L min−1 for 30 min and then re-weighed to determine the particle mass concentration. In addition, an SMPS consisting of a long differential mobility analyzer (DMA) and TSI Model 3010 condensation particle counter (CPC) (Tobias et al. Citation2001) was used to monitor the size distribution and volume concentration of particles at a time resolution of 4 min when generating particles and during filter sampling. A custom-built thermal desorption particle beam mass spectrometer (TDPBMS) (Tobias et al. Citation2000) was also run continuously during each experiment to monitor changes in particle mass concentration in real-time at a higher time resolution than the SMPS.
Chemicals
Chemicals were used as purchased, without further purification. Purities and chemical supplier are noted in parentheses. Acetonitrile (HPLC Grade, EMD Millipore), acetone (HPLC Grade, Fisher Chemical), and DOS (>97%, Fluka) were used in particle seeding experiments. A series of 2-ketones: 2-heptanone (99%, Sigma Aldrich), 2-octanone (98%, Sigma Aldrich), 2-nonanone (>99%, Sigma Aldrich), 2-decanone (98%, Sigma Aldrich), 2-undecanone (99%, Sigma Aldrich), 2-dodecanone (98%, ChemSampCo), and 2-tridecanone (99%, Sigma Aldrich) were used for gas-wall partitioning experiments. Gases used were N2 (UHP, Airgas), He (UHP, Airgas) and CO2 (Industrial Grade, Airgas).
Results and discussion
Gas-wall partitioning
In , the gas phase concentrations of organic compound, [OC]g (amount in gas phase/chamber volume), divided by the total concentration in the chamber [OC]T (amount in gas phase and walls/chamber volume), are shown after adding C9–C13 2-ketones to the chamber and measuring for 300 min. Whereas there was no observed change in the concentration of 2-nonanone during the sampling period, the concentrations of all the larger 2-ketones decreased over time. Because 2-nonanone did not partition to the walls, as expected from previous experiments (Matsunaga and Ziemann Citation2010; Yeh and Ziemann Citation2015) and indicated by a relative standard deviation <3% for all samples, it was used as an internal standard to account for variability in the chamber volume and sampling time for each Tenax adsorbent cartridge. It could also have acted as a dilution tracer if there had been leaks in the chamber. In addition, in order to create the plot shown in , the GC-FID signal expected for each VOC in the absence of partitioning needs to be known. Since this could not be determined directly because of possible partitioning of VOCs to the chamber walls, average GC-FID signals measured for equimolar solutions were plotted against the carbon number of the 2-ketone, which yields the linear relationship shown in . This behavior is well established, with the y-intercept being determined by the identity of any functional groups (Scanlon and Willis Citation1985). Deviations from the relationship of GC-FID signal vs. carbon number, as well as the time profile shown in , are indications of gas-to-wall partitioning. Note also that as the deviation from linearity increases, the size of the error bars (which represent the standard deviation of all GC-FID measurements for a gas-wall partitioning experiment, as shown in ) increases. This observation provides further evidence that the deviation is due to gas-wall partitioning rather than thermal decomposition or reactions of larger 2-ketones, since the decrease in gas-phase concentration occurs over time instead of during addition of the 2-ketones to the chamber. By extrapolating the relationship of signal vs. carbon number, the expected GC-FID signal at t = 0 min for VOCs that are lost to the walls can be determined.
Figure 2. Typical results for a gas-wall partitioning experiment conducted using the vaporizer. Mean equilibration timescales are given for each 2-ketone (except for 2-nonanone, which does not partition to the walls), where errors are the standard deviation from replicate experiments. 2-Octanone and 2-heptanone also did not undergo noticeable partitioning, but had larger variability and so for simplicity are not plotted.
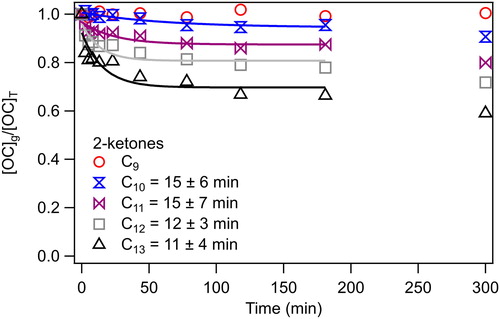
Figure 3. Determination of [OC]T at t = 0 min by plotting average GC-FID signal measured throughout the experiment vs. 2-ketone carbon number. Error bars are standard deviations of the measured GC-FID peak areas throughout a gas-wall partitioning experiment.
![Figure 3. Determination of [OC]T at t = 0 min by plotting average GC-FID signal measured throughout the experiment vs. 2-ketone carbon number. Error bars are standard deviations of the measured GC-FID peak areas throughout a gas-wall partitioning experiment.](/cms/asset/fefe5fb0-dd6f-4b2a-ac3f-6beb5df46249/uast_a_1808186_f0003_c.jpg)
The timescale for reaching gas-wall partitioning equilibrium was determined by fitting the time series of [OC]g/[OC]T measurements to the following exponential equation:
(1)
(1)
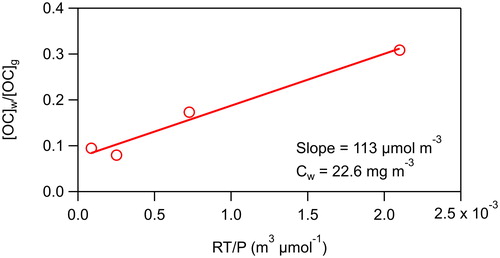
where ([OC]g/[OC]T)eq is the value at equilibrium, t is the time (min), and τgw is the time constant (min) for achieving equilibrium. The fraction partitioned to the walls at equilibrium was determined 60–90 min after VOC addition. By making 4 measurements in the first 13 min of the experiment (which was not done in the previous GC-FID experiments due to concerns about the equilibration timescale in the stainless-steel sampling line [Matsunaga and Ziemann Citation2010; Yeh and Ziemann Citation2015]), we were able to more accurately determine the time constant. Values for the time constant for the C10–C13 2-ketones were 15 ± 6, 15 ± 7, 12 ± 3, and 11 ± 4 min, for an average of 13 ± 3 min This value is in good agreement with the average value of 10 min (range 7–13 min) measured by Krechmer et al. (Citation2016) using a NO3-chemical ionization mass spectrometer (CIMS) to monitor multifunctional products formed in situ from the photo-initiated reaction of OH radicals with alcohols in the presence of NO. Following the rapid attainment of partitioning equilibrium, VOC concentrations decreased slowly (∼3% h−1) over the next 3 h of the experiment (). It has been proposed that this is due to diffusion of VOCs into a relaxing Teflon film beyond the few nanometer thick region in which partitioning equilibrium is initially established (Matsunaga and Ziemann Citation2010; Zhang et al. Citation2015; Huang et al. Citation2018). An effective absorbing organic mass concentration of the walls, Cw, of 23 mg m−3 was determined by plotting [OC]w/[OC]g vs. RT/P (), where R is the gas constant, T is the temperature, and P is the vapor pressure calculated using SIMPOL.1 (Pankow and Asher Citation2008). The slope of the resulting line was then multiplied by 200 g mol−1, the standard assumed molecular weight of the Teflon film (Matsunaga and Ziemann Citation2010), to obtain Cw. This value is similar to values of 24 and 10 mg m−3 determined in previous studies of these compounds (Matsunaga and Ziemann Citation2010; Yeh and Ziemann Citation2015).
Figure 4. Ratio of the concentrations of 2-ketones in the walls and in the gas phase vs. the vapor pressure calculated by SIMPOL.1 (Pankow and Asher Citation2008). The slope of the line is used to calculate Cw, the effective absorbing organic mass concentration of the walls.
Particle seeding
In one series of particle seeding experiments, varying amounts of DOS were vaporized into the chamber using solutions with concentrations of 120, 80, and 60 mg mL−1, which based on the measured chamber volume should have generated particle mass concentrations of 260, 223, and 182 µg m−3, respectively, for quantitative addition. Duplicate filter samples were then collected for 30 min while SMPS measurements were made for comparison and for use in correcting the measured filter mass for deposition of particles on the walls during sampling. After accounting for these losses (rates were 12–15% h−1), the average mass concentrations determined from the filter samples were 257 ± 4, 203 ± 8, and 168 ± 5 µg m−3. Predicted concentrations were thus on average within ±6% of those measured with filters, indicating that DOS was added to the chamber quantitatively.
The mass concentration determined from the filter samples was a factor of 1.66 higher than that calculated by multiplying the average volume concentration measured with the SMPS by the density of DOS (0.914 g cm−3). Since the possible error in the filter measurements is small, the results indicate that the discrepancy is due primarily to errors in the algorithm used to convert the measured particle mobility distribution to particle volume concentration, although uncertainties in flow settings can also contribute. The inversion procedure includes corrections for particle charging efficiency, diffusional losses of particles in the DMA, the DMA transfer function and diffusional broadening of the DMA transfer function, and the counting efficiency the CPC (Tobias et al. Citation2001), which have been estimated to lead to uncertainties of ±30% in the particle volume concentration output of the SMPS (Wiedensohler et al. Citation2012, Citation2018). This result indicates that the vaporizer can be used to calibrate an SMPS and other particle detection instruments that measure particle mass by providing a known particle mass concentration.
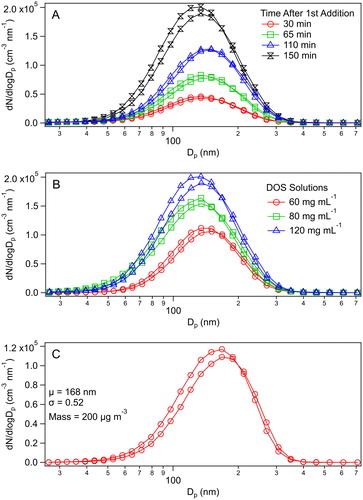
In another series of experiments, DOS particles were generated multiple times from a 40 mg mL−1 DOS solution to evaluate the linearity between the mass concentration predicted from the amount of DOS added from the syringe with the mass concentration measured with the SMPS (corrected using the factor of 1.66 determined above) over a larger set of concentrations. The TDPBMS was also used during these experiments. In each seeding event, particle generation was complete in ∼10 min, as shown in . The cumulative increase in particle mass was linear (), as was the mass increase due to each addition (), which also demonstrated that the controlled generation of a few µg m−3 of aerosol is possible. Because the main point of this experiment was to evaluate the linearity between predicted and measured DOS mass concentrations, no attempt was made to correct measurements for loss of particles to the walls or changes in the volume of the chamber. In addition, the change in SMPS mass due to each small mass addition () was calculated as the difference between two large numbers, adding to measurement uncertainty. The slopes of the plots in of 1.0 and 1.4 are therefore about as close to 1 as might be expected.
Figure 5. DOS particle generation in the environmental chamber using the vaporizer. (a) Time series of particle addition monitored by the SMPS and TDPBMS at m/z 185. (b) Cumulative mass measured with the SMPS vs. cumulative mass added. (c) Mass increase measured with the SMPS vs. mass added during each event. (d) Cumulative number measured with the SMPS vs. cumulative mass added. Values are not corrected for particle wall loss or for changes in chamber volume during the experiment.
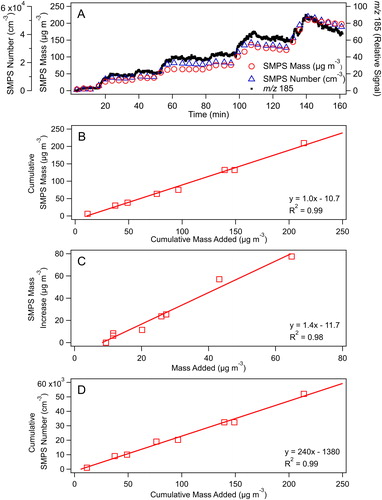
The cumulative particle number also increased linearly with multiple seed generation events ( and ), whereas the mode diameter barely changed (), indicating that the addition of DOS to a seeded chamber leads to new particle formation rather than condensational growth of preexisting particles. The vaporizer temperature and flow rate used here produce (in a single particle generation event) a particle size distribution centered at ∼150 nm () at all of the DOS solution concentrations used in these experiments, demonstrating that the size distribution is insensitive to the concentrations tested. The particles generated at the temperature and flow rate used in these experiments produced a size distribution which is comparable to that typically achieved using our home-built evaporation-condensation source ().
Figure 6. Size distribution of DOS particles produced from (a) multiple additions using the vaporizer with a 40 mg mL−1 DOS solution, where time after first addition represents the x-axis in , (b) single additions using the vaporizer with three different DOS solution concentrations, and (c) a evaporation-condensation source. SMPS curves are based on the average of up and down scans.
Conclusions
The ability to rapidly and quantitatively add VOCs and particles to an environmental chamber can be useful for measuring gas-wall partitioning timescales and equilibrium, for providing a calibration aerosol for particle instrumentation, and as a source of seed particles in SOA studies. Here we describe the design and demonstrate the performance of a vaporizer that accomplishes both of these goals. Following the addition of VOCs, gas-wall partitioning timescales and the effective absorbing organic mass concentration of the walls can be easily measured using Tenax sampling and gas chromatography, instrumentation that is available in many atmospheric chemistry laboratories. Although in some cases, measurements made using this method would ideally have available synthesized standards of reaction products, gas-wall partitioning in a particular chamber can be quite thoroughly characterized (especially using the vaporizer developed here) by conducting studies using homologous series of commercially available compounds containing one or more of the functional groups commonly found in atmospheric compounds (Matsunaga and Ziemann Citation2010; Yeh and Ziemann Citation2015). The vaporizer conveniently produces selected particle mass concentrations as low as 5 µg m−3 in a few minutes by simply injecting an appropriate amount of DOS solution into the vaporizer. Liquid DOS particles have the advantage that they are spherical at all relative humidities, which is important for a calibration aerosol (Liu et al. Citation1995) but is not the case with inorganic particles. As demonstrated here, because the mass concentration of DOS particles generated by vaporization of DOS into the chamber is known (which is not the case for other particle generation methods), SMPS measurements can be easily corrected to obtain more accurate mass concentrations. This approach can be employed in the laboratory, as well as in field studies by using a small portable Teflon chamber. In support of the latter application, we note that when one of us (JLJ) organized an inter-comparison of several SMPS instruments operated by different groups at the 2011 BEACHON-RoMBAS study, in the first round of the inter-comparison the range of reported aerosol mass concentrations was a factor of four. It is also likely that the vaporizer could be used in steady-state chamber experiments by using a syringe pump to continuously deliver the seed particle solution. Future experiments conducted with this vaporizer could investigate the effects of flow rate and temperature on the generated particle size distribution, and the generation of particles from organic materials that have previously been used successfully in an evaporation-condensation source, such as dioctyl phthalate, polyethylene glycol, oleic acid, and sucrose (Liu et al. Citation2019b), as well as more authentic SOA mixtures. And although previous studies with the 2-ketones employed here (Deming et al. Citation2019) and with large multifunctional compounds (Krechmer et al. Citation2017) have observed no effect of humidity on gas-wall partitioning, recently measured correlations between the Henry’s Law constant and CIMS response timescale for very small, water soluble compounds sampled through humidified Teflon tubes (Liu et al. Citation2019a) indicate that this vaporizer might also be used to more thoroughly study this effect in environmental chambers.
Supplemental Material
Download PDF (216.6 KB)Acknowledgments
We would like to acknowledge Donald David and Ken Smith of the CIRES Integrated Instrument Development Facility for manufacturing and helpful discussions regarding the design of the vaporizer.
Additional information
Funding
Related Research Data
References
- Atkinson, R., and J. Arey. 2003. Atmospheric degradation of volatile organic compounds. Chem. Rev. 103 (12):4605–38. doi:10.1021/cr0206420.
- Behnke, W., W. Holländer, W. Koch, F. Nolting, and C. Zetzsch. 1988. A smog chamber for studies of the photochemical degradation of chemicals in the presence of aerosols. Atmos. Environ. 22 (6):1113–20. doi:10.1016/0004-6981(88)90341-1.
- Benson, S. W., and R. Shaw. 1970. Thermochemistry of organic peroxides, hydroperoxides, polyoxides, and their radicals. In Organic peroxides, ed. D. Swern, vol. 1, 105–40. New York: John Wiley & Sons.
- Burkholder, J. B., J. P. D. Abbatt, I. Barnes, J. M. Roberts, M. L. Melamed, M. Ammann, A. K. Bertram, C. D. Cappa, A. G. Carlton, L. J. Carpenter, et al. 2017. The essential role for laboratory studies in atmospheric chemistry. Environ. Sci. Technol. 51 (5):2519–28. doi:10.1021/acs.est.6b04947.
- Chao, W., J.-T. Hsieh, C.-H. Chang, and J. J.-M. Lin. 2015. Direct kinetic measurement of the reaction of the simplest Criegee intermediate with water vapor. Science 347 (6223):751–4. doi:10.1126/science.1261549.
- Deming, B., D. Pagonis, X. Liu, D. Day, R. Talukdar, J. Krechmer, J. A. de Gouw, J. L. Jimenez, and P. J. Ziemann. 2019. Measurements of delays of gas-phase compounds in a wide variety of tubing materials due to gas-wall interactions. Atmos. Meas. Tech. 12 (6):3453–61. doi:10.5194/amt-12-3453-2019.
- Docherty, K. S., and P. J. Ziemann. 2006. Reaction of oleic acid particles with NO3 radicals : Products, mechanism, and implications for radical-initiated organic aerosol oxidation. J. Phys. Chem. A 110 (10):3567–77. doi:10.1021/jp0582383.
- Duplissy, J., M. B. Enghoff, K. L. Aplin, F. Arnold, H. Aufmhoff, M. Avngaard, U. Baltensperger, T. Bondo, R. Bingham, K. Carslaw, et al. 2010. Results from the CERN pilot CLOUD experiment. Atmos. Chem. Phys. 10 (4):1635–47. doi:10.5194/acp-10-1635-2010.
- Finlayson-Pitts, B. J., and J. N. Pitts. Jr. 2000. Chemistry of the upper and lower atmosphere: Theory, experiments and applications. San Diego, CA: Academic Press.
- Hallquist, M., J. C. Wenger, U. Baltensperger, Y. Rudich, D. Simpson, M. Claeys, J. Dommen, N. M. Donahue, C. George, A. H. Goldstein, et al. 2009. The formation, properties and impact of secondary organic aerosol: current and emerging issues. Atmos. Chem. Phys. 9 (14):5155–236. doi:10.5194/acp-9-5155-2009.
- Huang, Y., R. Zhao, S. M. Charan, C. M. Kenseth, X. Zhang, and J. H. Seinfeld. 2018. Unified theory of vapor-wall mass transport in Teflon-walled environmental chambers. Environ. Sci. Technol. 52 (4):2134–42. doi:10.1021/acs.est.7b05575.
- Hurd, C. D., and F. H. Blunck. 1938. The pyrolysis of esters. J. Am. Chem. Soc. 60 (10):2419–25. doi:10.1021/ja01277a035.
- Hynes, A. J., and P. H. Wine. 1991. Kinetics and mechanism of the reaction of hydroxyl radicals with acetonitrile under atmospheric conditions. J. Phys. Chem. 95 (3):1232–40. doi:10.1021/j100156a037.
- Krechmer, J. E., D. A. Day, P. J. Ziemann, and J.-L. Jimenez. 2017. Direct measurements of gas/particle partitioning and mass accommodation coefficients in environmental chambers. Environ. Sci. Technol. 51 (20):11867–75. doi:10.1021/acs.est.7b02144.
- Krechmer, J. E., D. Pagonis, P. J. Ziemann, and J.-L. Jimenez. 2016. Quantification of gas-wall partitioning in teflon environmental chambers using rapid bursts of low-volatility oxidized species generated in situ. Environ. Sci. Technol. 50 (11):5757–65. doi:10.1021/acs.est.6b00606.
- Liu, X., D. A. Day, J. E. Krechmer, W. Brown, Z. Peng, P. J. Ziemann, and J. L. Jimenez. 2019b. Direct measurements of semi-volatile organic compound dynamics show near-unity mass accomodation coefficients for diverse aerosols. Commun. Chem. 2 (1):98. doi:10.1038/s42004-019-0200-x.
- Liu, X., B. Deming, D. Pagonis, D. A. Day, B. B. Palm, R. Talukdar, J. M. Roberts, P. R. Veres, J. E. Krechmer, J. A. Thornton, et al. 2019a. Effects of gas–wall interactions on measurements of semivolatile compounds and small polar molecules. Atmos. Meas. Tech. 12 (6):3137–49. doi:10.5194/amt-12-3137-2019.
- Liu, P., P. J. Ziemann, D. B. Kittelson, and P. H. McMurry. 1995. Generating particle beams of controlled dimensions and divergence: II. Experimental evaluation of particle motion in aerodynamic lenses and nozzle expansions. Aerosol Sci. Technol. 22 (3):314–24. doi:10.1080/02786829408959749.
- Matsunaga, A., and P. J. Ziemann. 2010. Gas-wall partitioning of organic compounds in a Teflon film chamber and potential effects on reaction product and aerosol yield measurements. Aerosol Sci. Technol. 44 (10):881–92. doi:10.1080/02786826.2010.501044.
- May, K. R. 1973. The Collison nebulizer: Description, performance and application. J. Aerosol Sci. 4 (3):235–43. doi:10.1016/0021-8502(73)90006-2.
- Muir, D. C. F. 1965. The production of monodisperse aerosols by a La Mer - Sinclair generator. Ann. Occup. Hyg. 8:233–8. doi:10.1093/annhyg/8.3.233.
- Pagonis, D., J. E. Krechmer, J. de Gouw, J.-L. Jimenez, and P. J. Ziemann. 2017. Effects of gas-wall partitioning in Teflon tubing and instrumentation on time-resolved measurements of gas-phase organic compounds. Atmos. Meas. Tech. 10 (12):4687–96. doi:10.5194/amt-10-4687-2017.
- Pankow, J. F., and W. E. Asher. 2008. SIMPOL.1: A simple group contribution method for predicting vapor pressures and enthalpies of vaporization of multifunctional organic compounds. Atmos. Chem. Phys. 8 (10):2773–96. doi:10.5194/acp-8-2773-2008.
- Reed Harris, A. E., A. Pajunoja, M. Cazaunau, A. Gratien, E. Pangui, A. Monod, E. C. Griffith, A. Virtanen, J. F. Doussin, and V. Vaida. 2017. Multiphase photochemistry of pyruvic acid under atmospheric conditions. J. Phys. Chem. A 121 (18):3327–39. doi:10.1021/acs.jpca.7b01107.
- Robinson, E. S., R. Saleh, and N. M. Donahue. 2015. Probing the evaporation dynamics of mixed SOA/squalane particles using size-resolved composition and single-particle measurements. Environ. Sci. Technol. 49 (16):9724–32. doi:10.1021/acs.est.5b01692.
- Sage, A. M., E. A. Weitkamp, A. L. Robinson, and N. M. Donahue. 2009. Reactivity of oleic acid in organic particles: Changes in oxidant uptake and reaction stoichiometry with particle oxidation. Phys. Chem. Chem. Phys. 11 (36):7951–62. doi:10.1039/b904285g.
- Scanlon, J. T., and D. E. Willis. 1985. Calculation of flame ionization detector relative response factors using the effective carbon number concept. J. Chromatogr. Sci. 23 (8):333–40. doi:10.1093/chromsci/23.8.333.
- Steacie, E. W. R. 1933. The kinetics of the thermal decomposition of methyl ethyl ether. J. Chem. Phys. 1 (8):618–9. doi:10.1063/1.1749336.
- Taatjes, C. A., O. Welz, A. J. Eskola, J. D. Savee, D. L. Osborn, E. P. F. Lee, J. M. Dyke, D. W. K. Mok, D. E. Shallcross, and C. J. Percival. 2012. Direct measurements of Criegee intermediate (CH2OO) reactions with acetone, acetaldehyde, and hexafluoroacetone. Phys. Chem. Chem. Phys. 14 (30):10391–400. doi:10.1039/c2cp40294g.
- Tobias, H. J., D. E. Beving, P. J. Ziemann, H. Sakurai, M. Zuk, P. H. McMurry, D. Zarling, R. Waytulonis, and D. B. Kittelson. 2001. Chemical analysis of diesel engine nanoparticles using a nano-DMA/thermal desorption particle beam mass spectrometer. Environ. Sci. Technol. 35 (11):2233–43. doi:10.1021/es0016654.
- Tobias, H. J., P. M. Kooiman, K. S. Docherty, and P. J. Ziemann. 2000. Real-time chemical analysis of organic aerosols using a thermal desorption particle beam mass spectrometer. Aerosol Sci. Technol. 33 (1–2):170–90. doi:10.1080/027868200410912.
- Wang, J., J. F. Doussin, S. Perrier, E. Perraudin, Y. Katrib, E. Pangui, and B. Picquet-Varrault. 2011. Design of a new multi-phase experimental simulation chamber for atmospheric photosmog, aerosol and cloud chemistry research. Atmos. Meas. Tech. 4 (11):2465–94. doi:10.5194/amt-4-2465-2011.
- Wang, N., S. P. Jorga, J. R. Pierce, N. M. Donahue, S. N. Pandis. 2018. Particle wall-loss correction methods in smog chamber experiments. Atmos. Meas. Tech. 11:6577–88. doi:10.5194/amt-11-6577-2018.
- Wiedensohler, A., W. Birmili, A. Nowak, A. Sonntag, K. Weinhold, M. Merkel, B. Wehner, T. Tuch, S. Pfeifer, M. Fiebig, et al. 2012. Mobility particle size spectrometers: Harmonization of technical standards and data structure to facilitate high quality long-term observations of atmospheric particle number size distributions. Atmos. Meas. Tech. 5 (3):657–85. doi:10.5194/amt-5-657-2012.
- Wiedensohler, A., A. Wiesner, K. Weinhold, W. Birmili, M. Hermann, M. Merkel, T. Müller, S. Pfeifer, A. Schmidt, T. Tuch, et al. 2018. Mobility particle size spectrometers: Calibration procedures and measurement uncertainties. Aerosol Sci. Technol. 52 (2):146–64. doi:10.1080/02786826.2017.1387229.
- Yeh, G. K., and P. J. Ziemann. 2014. Alkyl nitrate formation from the reactions of C8-C14 n-alkanes with OH radicals in the presence of NO(x): Measured yields with essential corrections for gas-wall partitioning. J. Phys. Chem A 118 (37):8147–57. doi:10.1021/jp500631v.
- Yeh, G. K., and P. J. Ziemann. 2015. Gas-wall partitioning of oxygenated organic compounds: Measurements, structure-activity relationships, and correlation with gas chromatographic retention factor. Aerosol Sci. Technol. 49 (9):727–38. doi:10.1080/02786826.2015.1068427.
- Zhang, X., R. H. Schwantes, R. C. McVay, H. Lignell, M. M. Coggon, R. C. Flagan, and J. H. Seinfeld. 2015. Vapor wall deposition in Teflon chambers. Atmos. Chem. Phys. 15 (8):4197–214. doi:10.5194/acp-15-4197-2015.
- Zhao, Z., X. Yang, J. Lee, R. Tolentino, R. Mayorga, W. Zhang, H. Zhang. 2020. Diverse reactions in highly functionalized organic aerosols during thermal desorption. ACS Earth Space Chem. 4 (2):283–96. doi:10.1021/acsearthspacechem.9b00312.
- Ziemann, P. J. 2005. Aerosol products, mechanisms, and kinetics of heterogeneous reactions of ozone with oleic acid in pure and mixed particles. Faraday Discuss. 130:469–90. doi:10.1039/b417502f.