
EDITOR:
Introduction
Choir singing has been suspended in many countries during the Covid-19 pandemic due to incidental reports of disease transmission (Hamner et al. Citation2020). The mode of transmission has been attributed to exhaled droplets, but with the exception of a study on tuberculosis from 1968, there is presently almost no scientific evidence of increased particle emissions from singing (Loudon and Roberts Citation1968). A substantial number of studies have, however, investigated aerosols emitted from breathing, talking, coughing and sneezing (e.g., Asadi et al. Citation2019; Johnson et al. Citation2011). It has also been shown that just normal breathing over time can generate more viable virus aerosol than coughing, since the latter is a less frequent activity (Lindsley et al. Citation2016).
Compared to talking, singing often involves continuous voicing, higher sound pressure, higher frequencies, deeper breaths, higher peak airflows and more articulated consonants. All these factors are likely to increase exhaled emissions.
The aim of this study was to investigate aerosol and droplet emissions during singing, as compared to talking and breathing. We also examined the presence of SARS-CoV-2 in the air from breathing, talking and singing, and the efficacy of face masks to reduce emissions. In this study we defined aerosol particles as having a dry size in the range 0.5–10 µm. Although debatable from an aerosol physics point of view, a cutoff diameter between 5 and 10 µm is normally used in medicine for classification of aerosol versus droplet route of transmission. Droplets are here defined as exhaled particles, from micron size with no upper size limit, and measured directly at the mouth before complete evaporation, thus partly in liquid phase.
Methods
Twelve volunteer singers were included in the study: 7 professional opera singers (2 basses, 1 baritone, 2 altos and 2 sopranos) and 5 amateurs (3 tenors, 2 altos). The singers were sitting or standing in an upright position. Measurements on the 12 singers were carried out in a 22 m3 airtight experimental chamber at room temperature around 22 °C and maximum 40% relative humidity. The chamber was ventilated by particle-free air with an air exchange rate of 3 h−1. Both singers and researches were wearing clean air suits to minimize background particle concentrations. In addition, we analyzed SARS-CoV-2 in air samples collected close to two persons confirmed positive for Covid-19 while talking and singing.
A short consonant-rich text was repeated during eight exercises: talking normal (no set tone, 50-60 dBA measured at 1 m distance), talking loud (no set tone, 65–80 dBA), singing normal (A natural, man/woman: A3/A4, <70 dBA), singing loud (A natural, 70–90 dBA), singing loud with exaggerated diction (A natural, 70-90 dBA), singing loud at high pitch (man/woman: E4/E5) and singing loud wearing a surgical face mask (A natural). The singers had varied voice strength at the chosen pitches, and sound pressure values are thus approximate. Singing was carried out at a single pitch with a metronome set at 92 bpm to provide constant rhythm. Each exercise was performed for 2 min, which corresponded to 12 repetitions of the spoken or sung text. Particle concentrations reached a steady state after 10–15 s, after which the data were analyzed. For reference, we also detected particle emissions during normal breathing.
The size and concentration of aerosol particles in the range 0.5–10 µm were measured by an aerodynamic particle sizer (APS, Model 3321, TSI Inc.) at 5 s scan time. The aerosol was sampled from a 50 cm long horizontal anti-static metal funnel (volume 4.4 L) fitted around the face of the singers. A vacuum pump pulled a constant airflow of 15 L/min through the funnel in order to introduce fresh air for the singers, reduce deposition by limiting particle residence time, and decrease relative humidity to ensure measurement at particle dry size. It was not possible to achieve isokinetic and vertical sampling due to the varying flow rates from breathing and the preferable upright positioning of the singers. Emission rates were calculated with the assumption of zero particle losses in the funnel, and thus aerosol emissions may be somewhat underestimated. Between exercises, the aerosol particle concentration was left to decrease to background levels below 0.5 cm−3.
For five of the singers, droplet emissions (non-evaporated particles with no upper size limit) were imaged with a high-speed camera (Photron FastCAM SA-X2) with an acquisition frequency of 125 frames per second and exposure time of 250 μs. A Nikon 50 mm prime lens was used with the aperture set at f/2.8 to balance adequate depth-of-field and low-light sensitivity. Particles were visualized by means of elastic light scattering, with light provided by ten 50 W narrow spread-angle reflector halogen lamps in a configuration of two overlapping racks of five lamps, resulting in a homogenous illumination profile with a rectangular cross section of 10x50cm. This light profile was aimed in front of the participants, directed toward the camera at an angle approximately 30° off the detection axis, in order to utilize the forward scattering properties of micrometer sized particles. The detection limit of the setup was evaluated using glass beads with a MMAD of 4 µm (ρ = 2 g/cm3), which yielded high signals and clearly resolved particles. The images were analyzed with an in-house developed algorithm in Matlab to obtain the number of particles and visualize the temporal variation.
The SARS-CoV-2 virus in aerosols was investigated with a method previously validated for detection of airborne virus (Alsved et al. Citation2020). Samples were collected at a distance of 0.8 m in front of two persons with confirmed Covid-19 that were talking or singing (sitting position). Both were within two days of symptom onset. No precise quantitative information about viral loads in the airways could be obtained, but combined nasal/throat swabs analyzed for SARS-CoV-2 within 24 h of measurement had qPCR Ct values of 22–25, as reported by the hospital laboratory. Aerosols were collected into phosphate buffered saline by a cyclone (Coriolis µ, Bertin Technologies, flow rate 200 L/min) and on gelatin filters (MD8 airscan, Sartorius GmbH, flow rate 100 L/min). Sampling was performed for 10 min each for: (1) normal silent breathing, (2) reading a book loud, (3) singing, and (4) singing with a face mask. The samples were stored at 4 °C. RNA was extracted with the viral RNA mini kit (QIAGEN) according to the protocol of the manufacturer and quantitative reverse transcription polymerase chain reaction (qRT-PCR) was performed using the SuperScript ™️ III Platinum™️ One-Step qRT-PCR Kit (ThermoFisher Scientific) with primer and probes as described (Corman et al. Citation2020). Both positive (patient samples) and negative controls (blanks and sampling in virus-free environments) were made to validate the virus analysis. Approval was granted by the ethical review board in Sweden (2020-01396) for collecting air samples close to Covid-19 infected patients and for retrieving personal data about patient samples.
The Friedman test was used to evaluate if there were differences between all types of exercises and post hoc analysis with the Wilcoxons signed rank test was conducted for pairs of samples (SPSS version 26, IBM Inc.).
Results and discussion
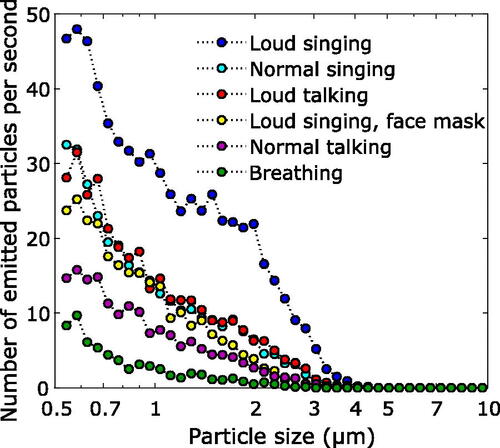
As illustrated in and , there were significant differences in particle emissions between breathing, talking and singing (Friedman test for emitted aerosol particle mass, p < 0.0001). Normal singing generated significantly more aerosol particles than normal talking (p = 0.002). Loud singing produced more particles than normal singing (p = 0.002). illustrates mass emission rates. Median (range) aerosol particle number emission rates were (): 135 (85-691) particles/s for breathing, 270 (120–1380) particles/s for normal talking, 570 (180–1760) particles/s for loud talking, 690 (320–2870) particles/s for normal singing, 980 (390–2870) particles/s for loud singing, and 1480 (500-2820) particles/s for loud singing with exaggerated diction. For loud singing with a face mask, the emission rate was 410 (200–1150) particles/s. Hence, a simple face mask reduced the amount of generated aerosol particles from singing to a level similar to normal talking (no significant difference, p = 0.08).
Figure 1. Aerosol particle mass emission rates during different exercises (dark blue, left y-axis), and the average number of droplets per frame (from image analysis, see ) in the exhaled air during the same exercises (red, right y-axis). Particle mass was measured in the range 0.5–10 µm. Each blue box represent data for 12 singers for aerosol particles and 5 singers for droplets. Two high values for loud singing not shown.
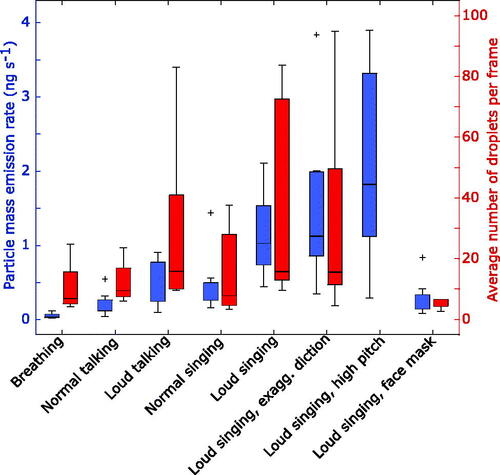
Figure 2. Median number of emitted particles in the size range 0.54–10 µm per second for the 12 singers.
There was a trend toward increased aerosol emissions with higher pitched singing, but this could also be an effect of increased sound pressures achieved at especially high pitches. The professional singers in this study generated 2–3 times more aerosol particle mass when singing loud at high E compared to A natural. The professional singers produced about a factor two more aerosol particles than the amateur singers at perceived normal sound pressure (Mann-Whitney, p = 0.03).
From the high-speed camera droplet analysis we found that some consonants, for example ‘p’, ‘b’, ‘r’ and ‘t’, generated a high number of small to large droplets (, see also the videos provided in the online supplementary information). The singing of vowels does not provide high airflows for the dispersal of particles, but as shown in the video files, the articulation of consonants expels droplets with considerable forward velocity. Nevertheless, many of the largest droplets travel a limited distance (<0.5 m) before their movement become vertical due to sedimentation.
Figure 3. The number of droplets per picture frame generated during loud singing with exaggerated consonants by the professional opera singers. During the 20 s the same phrase is repeated twice. Videos are available in the online supplementary information.
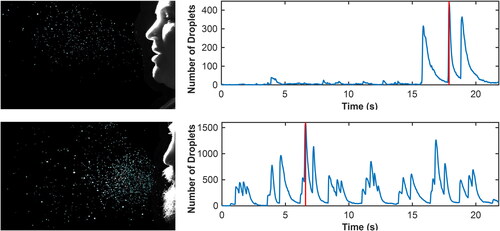
There were substantial differences in emissions of droplets between singing and talking, but statistical significance could not be verified due to the limited group size for the video recordings ( and ). Mean (±SEM) droplet numbers per frame were 12 ± 3 for normal talking, 29 ± 14 for loud talking, 16 ± 7 for normal singing, 38 ± 16 for loud singing, and 5 ± 1 for loud singing with a face mask. Thus, for the droplet analysis a common face mask also appears to be very efficient in reducing emissions. Although not measured systematically, we noted that subject-reported sense of accumulation of saliva in the mouth coincided with increased droplet generation from articulation, which resulted in high variation also within the data from the same singer (, top diagram). When singing loud with a surgical mask, almost no droplets were detected with the camera. A warm-up exercise where one lets the lips vibrate during exhalation (without activating the vocal cords) generated immense amounts of droplets (data not shown).
SARS-CoV-2 could not be detected in the air samples collected while confirmed Covid-19 patients were singing and talking. This can be due to the low concentrations of viruses in the air, but could also be attributed to individual differences in viral loads in the parts of the respiratory tract where the droplets are produced, as well as dilution steps in the sample preparation method.
Singing generated more respiratory aerosol particles and droplets than talking. Exhaled aerosol particles and droplets increased with song loudness. The data also indicated that emissions might increase at high pitch. Wearing an ordinary surgical face mask reduced the amount of measured exhaled aerosol particles and droplets to levels comparable with normal talking. However, as surgical masks have a loose fit, some particles may have exited on the sides where we did not measure. Based on these results, singing in groups is likely to be an activity at risk of transmitting infection if not appropriate control and prevention measures are applied, such as distancing, hygiene, ventilation and shielding.
Supplemental Material
Download Zip (12.5 MB)Acknowledgments
We want to express our gratitude to the singers who kindly and enthusiastically contributed with song for the aerosol detectors: foremost from Malmö Opera Choir but also from Malmö Limelight Chorus, Svanholm Singers, Lunds Student Singers and last, but not least, the two people who sang while having Covid-19.
Additional information
Funding
Related Research Data
References
- Alsved, M., C. J. Fraenkel, M. Bohgard, A. Widell, A. Soderlund-Strand, P. Lanbeck, T. Holmdahl, C. Isaxon, A. Gudmundsson, P. Medstrand, et al. 2020. Sources of airborne norovirus in hospital outbreaks. Clin. Infect. Dis. 70 (10):2023–2028. doi: 10.1093/cid/ciz584.
- Asadi, S., A. S. Wexler, C. D. Cappa, S. Barreda, N. M. Bouvier, and W. D. Ristenpart. 2019. Aerosol emission and superemission during human speech increase with voice loudness. Sci. Rep. 9 (1):2348. doi: 10.1038/s41598-019-38808-z.
- Corman, Victor M., Olfert Landt, Marco Kaiser, Richard Molenkamp, Adam Meijer, Daniel KW Chu, Tobias Bleicker et al. 2020. “Detection of 2019 novel coronavirus (2019-nCoV) by real-time RT-PCR.” Eurosurveillance 25 (3): 2000045.
- Hamner, L., P. Dubbel, I. Capron, A. Ross, A. Jordan, J. Lee, J. Lynn, A. Ball, S. Narwal, S. Russell, et al. 2020. High sars-cov-2 attack rate following exposure at a choir practice—skagit county, washington, march 2020. Mmwr. Morb. Mortal. Wkly. Rep. 69 (19):606–10., doi. doi: 10.15585/mmwr.mm6919e6.
- Johnson, G. R., L. Morawska, Z. D. Ristovski, M. Hargreaves, K. Mengersen, C. Y. H. Chao, M. P. Wan, Y. Li, X. Xie, D. Katoshevski, et al. 2011. Modality of human expired aerosol size distributions. J. Aerosol Sci. 42 (12):839–51. doi: 10.1016/j.jaerosci.2011.07.009.
- Lindsley, W. G., F. M. Blachere, D. H. Beezhold, R. E. Thewlis, B. Noorbakhsh, S. Othumpangat, W. T. Goldsmith, C. M. McMillen, M. E. Andrew, C. N. Burrell, et al. 2016. Viable influenza a virus in airborne particles expelled during coughs versus exhalations. Influenza Other Respir Viruses 10 (5):404–13. doi: 10.1111/irv.12390.
- Loudon, R. G., and R. M. Roberts. 1968. Singing and the dissemination of tuberculosis. Am. Rev. Respir. Dis. 98 (2):297–300. doi: 10.1164/arrd.1968.98.2.297.