
 ?Mathematical formulae have been encoded as MathML and are displayed in this HTML version using MathJax in order to improve their display. Uncheck the box to turn MathJax off. This feature requires Javascript. Click on a formula to zoom.
Abstract
The importance of bioaerosols to human and ecosystem health is evident as we tackle the on-going coronavirus pandemic. Understanding the airborne migration of pathogens and the consequent transmission of diseases such as COVID-19 requires an ability to monitor bioaerosols at high spatio-temporal resolution. For such monitoring, there is an immediate need for bioaerosol samplers that are easy to deploy and optimized for downstream analysis. In this study, we introduce a small, inexpensive, low-power, and a low-pressure drop device, called TracB, that integrates low-cost aerosol sensing with bioaerosol sampling using electrostatic precipitation technique. The device was designed for an efficient collection of particles in the size range of 0.01–10 µm, making it suitable for a wide range of downstream microbial analysis. A low-cost particle charger has been integrated with the device to improve the collection efficiency of the sampled particles. The performance of the device was tested with Bacillus thuringiensis var. kurtsaki (Btk) as the biological test organism for different operating conditions. The ability of the device to efficiently collect bio-particles when the charger was oriented parallel to the particle flow was confirmed with computational fluid dynamics simulations. Over 50% of biological and nonbiological test particles were collected in the device when operated with an ionizer and a precipitation electric field of 8 kV/cm. Our results demonstrate the potential of the device to be used as an autonomous unit suitable for long-term air sampling at diverse indoor and outdoor locations.
Copyright © 2020 American Association for Aerosol Research
EDITOR:
1. Introduction
Exposure to biological aerosols can be detrimental to human health as they could cause infectious diseases, acute or chronic toxic reactions, and allergies (Douwes et al. Citation2003; Crawford et al. Citation2015; Bloomfield and Riley Citation2016; Priyamvada et al. Citation2017). The role of infectious bioaerosols in disease transmission has been widely acknowledged yet remains poorly understood. Recent disease outbreaks caused by emerging fungi and viruses, such as Candida auris (Fisher et al. Citation2012; Casadevall Citation2019; Friedman and Schwartz Citation2019), severe acute respiratory syndrome coronavirus (SARS-CoV), and middle east respiratory syndrome coronavirus (MERS-CoV), and severe acute respiratory syndrome coronavirus 2 (SARS-CoV-2) highlight the importance of bioaerosols in public health (Herfst et al. Citation2017; Allen and Marr Citation2020; Kampf et al. Citation2020; Santarpia et al. Citation2020). As humans spend over 90% of their times indoor, there is a particular need to understand the generation, dispersion, and fate of infectious agents in built environment. Modeling disease transmission in indoor spaces requires an understanding of airborne movement of particles and their deposition onto different surfaces. To predict the transport characteristics and fate of various aerosolized pathogens, bioaerosol samplers that can be widely deployed, are required (Edmonds Citation2009). In addition, bioaerosol monitoring is essential for controlling the overall air quality, assessment of health risks due to microbial exposure, identification of emission sources, and estimating the efficiency of ventilation and other air cleaning interventions (Park et al. Citation2014; Ding, Fronczek, and Yoon Citation2015; Raberalam et al. Citation2017). Bioaerosol studies in hospitals are also becoming increasingly important to address the problem of healthcare-associated infections (HAIs), a growing global public-health issue (Allegranzi et al. Citation2011; Lax et al. Citation2017; Haque et al. Citation2018). Many HAI pathogens, e.g., Mycobacterium tuberculosis and many viruses such as influenza virus, norovirus, and the recent corona virus (SARS-CoV-1 and SARS-CoV-2), are predominantly transmitted through air and cause outbreaks in hospitals and other built environments (Prussin, Marr, and Bibby Citation2014; Duchaine Citation2016; Nazaroff Citation2016; Sattar Citation2016; Yan et al. Citation2018; Allen and Marr Citation2020; Stadnytskyi et al. Citation2020; Zhang et al. Citation2020).
Impingement, impaction, and filtration are the widely used techniques for collection of bioaerosols in both indoor and outdoor environments (Mainelis et al. Citation1999; Han and Mainelis Citation2008; Hoisington et al. Citation2014; Park et al. Citation2014; Wang et al. Citation2015). The inertial and filtration-based sampling techniques are labor intensive, time consuming, and power-intensive. Also, the widely applied inertial and filtration-based techniques have been proven to be inefficient for capturing smaller pathogens such as virus (≤100 nm) (Prussin, Marr, and Bibby Citation2014). Due to such difficulties, the ability to conduct bioaerosol sampling in critical environments such as hospitals, day care centers, and other built environments remains limited. Over the past few decades, different electrostatic-based air samplers have been developed and applied for environmental and personal sampling (Mainelis et al. Citation2002; Han and Mainelis Citation2008; Ranjan and Dhaniyala Citation2009; Ma et al. Citation2016; Han, Thomas, and Mainelis Citation2017). Electrostatic samplers are advantageous over other techniques as they have lower power requirements, lower impaction stress, and lower pressure drop, thus enabling its application for long-term aerosol particle measurements (Mainelis et al. Citation2002; Han, Thomas, and Mainelis Citation2017).
Here, we build on past progress (Ranjan and Dhaniyala Citation2007, Citation2008, Citation2009) on electrostatic collection to develop a low-cost, low-power, and portable bioaerosol sampler, suitable for a wide range of bioaerosol monitoring in the indoor and outdoor environments. In this article, we present the concept, design, and performance of our bioaerosol sampler called TracB (Trace Aerosol sensor and Collector for Bio-particles) which can be utilized for autonomous and long-term bioaerosol monitoring in diverse indoor and outdoor locations. By combining low-cost aerosol sensing technology with electrostatic particle collection in a single hand-held, portable, and a 3 D printed device, TracB allows for routine, large-scale air quality monitoring and bioaerosol sampling. The current design enables the collection of aerosol particles of a wide size range (0.01–10 µm), and is, thus, appropriate for monitoring the best known bioaerosols, such as bacteria, fungi, pollens, and also the less and recently known species of virus, algae, archaea, and viridiplantae.
In TracB, aerosol particles are electrically charged and then collected onto a substrate by electrostatic force. As the air flow in the device is driven by a small, noiseless, low-cost, 12 V DC fan, the device is pump-less, small (21 × 8.5 × 11 cm), light, and, hence suitable for a wide-range of field applications. The device includes an optimized implementation of a new, commercially available miniature air ionizer, as a low-cost alternative for particle charging and for electrostatic precipitation. computational fluid dynamics (CFD) simulations were performed to understand the particle flow and collection behavior with respect to design aspects such as the ionizer orientation and length of the precipitator region. Various experiments were performed with the spores and cells of Bacillus thuringiensis var. kurstaki (Btk) and Arizona road dust to determine the collection efficiency of the device as a function of high voltage, particle ionization, particle concentration, and ionizer’s orientation.
2. Design of the sampler
For large-scale bioaerosol sampling, the ideal device will be low-cost, easy to fabricate, and simple to operate. For ease of fabrication, the device must be designed such that it can be manufactured by low-cost manufacturing options such as injection molding or with new fabrication techniques such as 3 D printing that are widely accessible. For ease of operation, the unit should be fully self-contained, compact, and use low power. Also, the unit must not need any working fluid or regular maintenance and must be autonomously operable. Further, to ensure low-cost, the overall size of the unit must be small, and the components placed inside the unit must be off-the-shelf. Using the above criteria, we designed a compact, portable device, called the TracB, that can (i) measure airborne particle concentrations using a low-cost sensor and, (ii) collect aerosol particles using a low-cost miniature electrostatic precipitator for off-line analyses.
2.1. Device body and electronic component design
To satisfy the need for easy manufacturability and low-cost, the body of the device was designed to be 3 D printable. The devices were built using polycarbonate–acrylonitrile butadiene styrene (PC-ABS) as the thermoplastic material in a “fused deposition modeling” (FDM)-based 3 D printing platform. PC-ABS filaments with a diameter of 1.75 mm were used to print each of the parts in the device at 0.25 mm layer resolution with a double dense (∼40%) infill. The device body was designed to accommodate the dual role of the unit, measuring the concentration of aerosol particles larger than 300 nm and collecting particles by electrostatic precipitation for biological analyses (). Both sections share common power lines and control units.
Figure 1. Pictorial depiction of TracB device. (a) Side view of the device (L-21 cm, H-8.5 cm, W-11 cm) with aerosol sensing component at the top and electrostatic precipitator at the bottom, (b) the aerosol sensing components include, 1 – two cooling fans (25 × 25 × 10 mm), 2 – air ionizer modules used as a HV source and as a particle ionizer in the electrostatic precipitator, 3 – power board that splits the input DC voltage to the air quality sensor and other electronic components, 4 – plantower air quality sensor, 5 – a circuit board that regulates the operation of a temperature sensor, RH sensor, Wi-Fi chip, real time clock chip, SD card slot, and a plantower power chip, (c) isometric view of the device shown with the fan side of the face, and a 12 V DC input socket can be seen present at the upper right hand side of the device, and (d) schematic representation of the side view of the electrostatic precipitator situated at the bottom of the device. The mixture of biological particles entering the device gets ionized with positive charges at the ionization region followed by their precipitation on the ground plate under an electric field of 8 kV/cm.
Aerosol concentration measurements were made with a low-cost, commercially available particle sensor, Plantower PMS5003, which provides the number and mass concentration of aerosol in the size range of 0.3–10 μm (He, Kuerbanjiang, and Dhaniyala Citation2020). The particle sensor data was recorded on a SD card and made available via Wi-Fi by integrating the sensor with an Arduino Mega 2560 microcontroller through a custom designed printed circuit board (PCB). The circuit board includes, (i) temperature and humidity sensor (HTU21D-F, Adafruit), (ii) real time clock (RTC) chip (DS3231, Adafruit), (iii) Wi-Fi chip for the data transmission (ESP8266, Sparkfun), (iv) SD card breakout board (Adafruit), and (v) Plantower power chip bridged to the Arduino board. The device operates with 12 V DC as the power input and a custom designed power splitter board to distribute power to all the components of the device. Two miniature (55 × 31 mm), low-cost, high-voltage (HV) air ionizer modules (MHM400; muRata Manufacturing Ltd) were placed alongside the sensor, of which, one was used as HV source and the other for charging sampled particles with positive ions in the precipitator region. To understand the effect of the ionizer orientation on particle collection, independent set of experiments were performed by placing the ionizers parallel and perpendicular to the flow field ().
Figure 2. Schematic representation of the position of air ionizer in the device. Perpendicular (indicated as Y; a, b) and parallel (indicated as X; c, d) orientation of the ionizer in the precipitator region is shown. Red arrows in (b) and (d) indicate the respective ionizer’s orientation.
For ease of operation and to keep the unit size small, a 50 mm, 12 V DC fan is used to draw flow in the electrostatic precipitator. The precipitator geometry was designed to have a low pressure drop such that a high sample flow of 10 lit/min (see the online supplementary information [SI] Text S1) was possible with a small fan. Further, the collection efficiency of the device was also tested as a function of flow rate (SI Text S1, Figure S1 and S2). The electrostatic precipitator consists of a HV plate (L-104 mm, W- 63 mm) and a ground plate (L-114 mm, W- 64 mm) placed parallel to each other at a distance of 4 mm. For ease of fabrication, both the precipitator plates were made out of PCBs. Additionally, PCBs also provide the potential to integrate with downstream circuitry for electrical current compared two methods for efficient measurements. The HV plate was maintained at a voltage of 5 kV and the resulting electric field strength of the device was 8 kV/cm. The collection plate was set to ground potential using a spring-loaded pogo pin (Mouser electronics; SI Figure S4). This arrangement allows the collection plate to be easily removed and loaded, without requiring any explicit electrical connection. To ensure that the collection plate can be replaced quickly, it is fastened magnetically to the main body of the device. The collection plate and its holder were adhered to the device housing through evenly spaced magnets (SI Figure S4). The device also has a limit switch which automatically shuts down the device when the collection/ground plate is pulled off, thus making the device safe to handle (SI Figure S4). In this article, the performance of the device is described only with respect to particle collection by electrostatic means. The air quality sensing data from our ongoing field deployment will be published in follow-up studies.
3. Experimental set up and performance evaluation procedure
The operating principle of the device in regard to the particle collection is as follows. Airflow in the device, driven by the fan, is first passed through the ionization region where sampled particles mix with the positive ions and get charged (). The positively charged particles then enter the precipitator region and electrostatically precipitate onto the grounded collection plate. The performance of the instrument as characterized by its collection efficiency of biological and nonbiological particles, can be experimentally determined and compared with CFD predictions. Additionally, for the use of the device as a bioaerosol sampler, the performance of the device is also established in the context of the fate of collected biological particles, and the ability to extract biological samples for analysis from the collection plate. The details of the experimental characterization approach are given below.
3.1. Biological test organism
The biological particle collection of the device was tested by performing independent set of experiments with the cells and spores of Btk, a BSL level 1 bacterial species. The protocol for the Btk spore revival, cultivation, sporulation, and harvesting was based on published literature (Schaeffer and Fulton Citation1933; Hageman et al. Citation1984; Tavares et al. Citation2013). The steps pertaining to the sporulation and purification were optimized to obtain high yields of spores with >95% purity. The bacterial stock was obtained from “Bacillus genetic stock center” (BGSC, Columbus, Ohio) as dormant spores fixed on a filter article. The bacterial stock was revived from dormancy by inoculating the filter in a Luria-Bertani (LB; Difco™) agar plate and incubated for 48 h at 30 °C. Few colonies were picked from the “parent stock” plate to initiate the spore formation by inoculating in the Schaeffer’s sporulation media at 30 °C for 7 days. The harvested spores were purified and washed three times with purified deionized water to eliminate the free remaining Btk cells. Spore solutions were prepared at three concentrations of 103, 106, and, 108 spores/mL. The performance of the device in terms of collecting the cells of Btk was also tested and the steps involved in culturing the Btk cells are as follows. The cells of Btk were obtained by inoculating 100 µL of 106 spores/mL of Btk spore solution in 100 mL of sterilized Luria-Bertani (LB; Difco™) broth. The culture media inoculated with the spores was incubated at 30 °C in a shaking incubator at 200 rpm for 12 h. The cultivated cells from the growth media was separated by centrifuging (4500 rpm, 10 min) the aliquots of cell suspension followed by washing the cell pellets with ultrapure water, three times. The cells were then resuspended in 10 mL ultrapure water and the aliquot tubes were stored at 4 °C until the aerosolization experiments. The corresponding airborne concentrations (cm−3 of air) of the cell/spore suspensions were determined from measurements with an aerodynamic particle sizer (APS 3321; TSI Inc., USA).
3.2. Experimental set up for performance evaluation – lab test
The experimental set up shown in consisted of a particle generator, Kr-85 (3077 A; TSI, Inc.) neutralizer, a diffusion dryer, a 75 lit drum as a test chamber, wherein the device was placed, a dilution flow line for compressed air, and APS for tracking the particle concentration throughout the experiment. The steady pressure in the drum was maintained by a flow line connected to the ambient through a HEPA filter.
Figure 3. Experimental setup for evaluating the aerosol collection by TracB device. A nebulizer (a) and a dust feeder (b) were used to generate aerosol of bacteria and dust particles, respectively. A neutralizer was introduced for charge conditioning, along with a diffusion dryer for the removal of excess water droplets from the bacterial aerosol particles. TracB device situated inside the drum was operated with a 12 V DC power supply. The particle concentration inside the drum was continuously monitored by an APS, and an additional dilution air flow to the drum allowed the particles to attain faster equilibrium prior to the start of the experiment. Exemplary images depicting the Btk spores (dashed red box; c) and the particle collection in the precipitator region of the device (d) is shown on the right-hand side of the diagram.
Performance of the TracB for its collection efficiency was tested with both biological and nonbiological particles in triplicates. A 50 mm tall nebulizer (A&P instruments, Hong Kong) was used to aerosolize the bacterial spores from the aqueous suspension. From the nebulizer, the bacterial spores reached the dryer at a flow rate of QN = 2.5 lit/min. For testing the collection of nonbiological particles, Arizona test dust with a nominal size range of 1–10 µm was used. The dust particles were dispersed using a dust feeder (Solid Aerosol Generator, SAG 410; Topas GmbH). The collection efficiency of the device was determined for both the charge-unconditioned and charge-conditioned particles. For charge conditioning, a Kr-85 (3077 A; TSI, Inc.) neutralizer was introduced in the set up to bring the charges carried by the aerosolized particles to near steady-state charge condition (He, Dhaniyala, and Wagner Citation2016; Yang, Dhaniyala, and He Citation2018). The charge conditioned or unconditioned particles were then routed to the test chamber housing the TracB. The particle concentration (dN/dlog dp/cm3) in the chamber was monitored continuously with an APS. Using just the flow from the nebulizer, the spore concentration inside the chamber achieved an equilibrium in 1 h. An additional dilution flow of 12.5 lit/min reduced the time for attaining the equilibrium to 10 min. Once the particle concentration in the chamber reached an equilibrium, the device was turned on remotely and operated for ∼30 min to collect sufficient amount of sample for the downstream analyses.
The collection characteristics of the device was tested for the following conditions: (i) influence of turbulence on particle collection, (ii) contribution of high voltage in the precipitator section, (iii) effect of ionization on particle collection, (iv) effect of spore and cell concentrations (1–103/cm3), and (v) the orientation of particle ionizer (parallel/perpendicular to the flow). The collection efficiency was determined by comparing the particle number concentrations from APS, before and after turning on the device under every test condition. The bacterial inactivation i.e. the loss of viability under a given electrostatic precipitation condition was tested for the spores/cells collected by the device at two different electric field strengths of 3 and 8 kV/cm. The viability tests were done using a cultivation-based technique reported in the literature (Mainelis et al. Citation2002; Yao, Mainelis, and An Citation2005; Zukeran et al. Citation2018) and by the live/dead staining methods (Murata and Zhang Citation2013; Emerson et al. Citation2017). The viable states of the Btk cells/spores recovered (using sterile swab) from the precipitator region was determined by counting the number of colony forming units (CFUs) grown on the trypticase soy agar (TSA) plates and comparing this number with the number of viable Btk spores/cells entering the device. After testing the fraction of viable cells/spores, we only used suspensions with viability >95% for nebulization. Viability of the spores/cells collected by the device was then calculated as:
(1)
(1)
where, CFUs are the number of colonies grown on the TSA plates, CAPS is the number of particles entering the device as measured by the APS, t is the sampling time (2 min for the electrostatic precipitation), Q is the sampling flow rate (lit/min), and VF is the fraction of viable Btk cells/spores in the initial nebulizer suspension.
The live/dead staining was conducted by using acridine orange (AO) and propidium iodide (PI). AO permeates through the intact cell membrane and labels live cells with green fluorescence, while PI can only permeate through compromised membrane and stains dead cells with red fluorescence. Staining was performed by incubating the samples for 15 min in a solution containing 20 µg/mL of AO and 50 µg/mL of PI. Images of the stained samples were captured using an inverted fluorescent microscope (Zeiss, USA) at 20X objective magnification. Live and dead cell numbers were quantified from the fluorescent images using ImageJ software and viability was calculated by dividing the number of viable Btk spores with the total spores. The inactivation is defined as the fraction of cells/spores that are not viable relative to the total number of collected cells/spores and expressed as percentage. The ozone emissions from the device was measured using the model 49i ozone analyzer (Thermo Fisher Scientific).
3.3. Particle recovery optimization
The devices that were built in the lab and deployed in the field (Clarkson University and a hospital) had PCBs as the ground/collection plate. The analysis of the PCB plate surface characteristics with atomic force microscopy (XE-300P, Park systems) revealed a surface roughness of ∼200 nm (SI ). We compared two methods for efficient recovery of samples from this surface – (i) washing the plates with 1X PBS, followed by filtering out the spores using a glass fiber filter, and (ii) swabbing the plates with a 6” sterile cotton swab (Puritan, USA) soaked in 1X PBS. The second method was adopted since it produced 10 times higher DNA yield, and also prevented electrochemical corrosion of the plate surface.
3.4. CFD modeling
CFD simulations were performed to understand the importance of design choices such as, collection region dimensions, flowrate, and ionizer orientation on particle collection. The CFD calculations were made using the software FLUENT 18.1 (ANSYS Inc.). Since the flow region in the precipitator section has a much larger width (5 cm) than the height (4 mm), the geometry was considered to be two-dimensional. The flow was considered incompressible and laminar (Reynolds number − 950). The simulations were performed for grid sizes of 0.05 and 0.025 cm and the flow fields were determined to be grid independent. The total number of elements for 0.05 cm mesh model were 377,496 and the convergence criteria was set to 1e − 05.
The critical boundary condition for flow simulations was the inlet velocity, which was selected to match the experimentally determined flow rate of 10 lit/min. For electric field simulation, the top and bottom plates were set to the applied potentials and other boundaries were set to zero flux. The semi-implicit method for pressure-linked equations (SIMPLE) algorithm was used to specify pressure-velocity coupled with the equations of continuity and momentum. To determine the fate of particles in TracB, trajectories of particles of different sizes were calculated by solving the particle force balance equation:
(2)
(2)
where
is particle diameter,
is the particle density,
and
are fluid and particle flow velocity,
is Coulomb’s force exerted on a charged particle, and
is slip correction that accounts for non-continuum effects calculated as:
(3)
(3)
where
is Knudsen number, calculated as the ratio of mean free path and particle radius. The coulomb force,
is calculated as the product of the applied electric field between the HV and ground plate (E; kV/cm), and the electrical charge (
on a particle. The electrical charge of particles depends on the number of charges (
and the unit charge (e = 1.60 × 10⁻¹⁹ coulombs). The trajectory calculations were made using FLUENT’s discrete phase model with a user defined function (UDF) to consider non-continuum effects on particle drag and the applied electrical field.
4. Results and discussion
4.1. Effect of particle ionization
We first tested the performance of the device in collecting biological and nonbiological particles. Any collection in the absence of the precipitator electric field and external particle ionization can be attributed to turbulence. Under these conditions, we observed only 1–5% of the atomized Btk spores to be collected in the device. Next, the effect of electric field and particle ionizer on collection efficiency was characterized (). Though the collection efficiency was estimated for Btk aerosol ranging from 0.5 to 3 µm, for an easy comprehension, the collection efficiency of 1 µm particles will be represented as CE1 and compared for the various test conditions, throughout the manuscript. With both the electric field and ionizer turned “on,” the CE1 was 46 ± 9%, however, the efficiency reduced to 16 ± 8% when the ionizer was turned “off.”
Figure 4. Effect of external ionization on the biological (Btk) and nonbiological (dust) particle collection in the device. Collection efficiency was tested for two operating conditions of “ionizer on” and “ionizer off.” The experiments were performed at a fixed flow rate of 10 lit/min and for a collection voltage of 5 kV. Each data point in the figure is an average from the triplicate experimental dataset and the error bars represent standard deviations.
The contribution of ionizer for efficient collection was further confirmed by reversing the polarity of the HV and ground plates and collecting the spores under same ionization conditions (on and off). The spores of 1 µm were collected with an efficiency of 45 ± 10% in the presence of the ionizer. To further investigate the influence of charge on the collection efficiency, spores after charge-conditioning by 85Kr source were tested. When the spores were neutralized by charge-conditioning and were collected in the absence of external ionization, the CE1 was found to be ∼6%. In the presence of the ionization, the CE1 of charge-neutralized spores increased to 47 ± 6%.
The device collected dust particles with an average CE1 of 83 ± 8% when they were ionized, while non-ionized dust particles were collected with an efficiency of 38 ± 5% (). The higher CE1 of nonbiological particles compared to the biological particles (∼50%) can be attributed to the different methods of particle generation employed in this study, and their influence on imparting electric charges to the generated aerosol particles (Forsyth, Liu, and Romay Citation1998; Mainelis et al. Citation2001). While the dust aerosol was generated by dispersing and deagglomerating the bulk dust material, the bacterial aerosol was generated by spray atomizing the spores/cells suspended in deionized water. We believe the dust dispersion imparts high electrical charges to the particles as they get separated from the bulk material, thus leading to their higher collection in the device. Further, the electric charges carried by the bacterial aerosol, as reported earlier (Mainelis et al. Citation2001), is a combination of their natural charge and the charge induced by the generation process. In our study, we believe the liquid disrupting forces utilized for the bacterial aerosol generation were weaker than those in the dust aerosol generator. We would also like to mention that estimating the charges carried by the aerosol particles based on their generation method may not be the most accurate way as the charges carried by any bacterial aerosol depend on a variety of physical factors, mechanisms of their preparation, and their subsequent aerosol generation (Mainelis et al. Citation2001). Considering all of these factors, we believe that the aerosolized bacteria in our experiments would have carried fewer charges compared to the dust particles dispersed by the dust feeder, leading to a relatively decreased collection by the device.
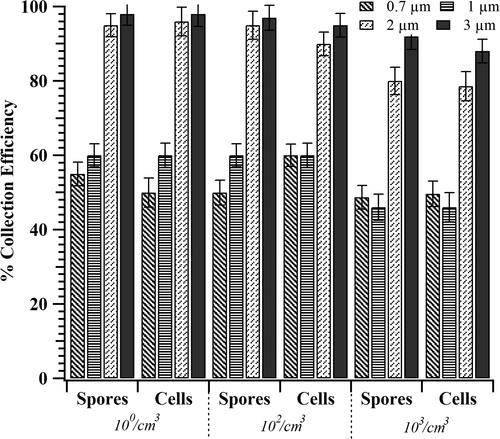
4.2. Effect of particle concentration
To test the effect of aerosol concentration on collection efficiency, the concentration of Btk spores were varied from 10 to 103 cm−3 (). The collection efficiency (CE1 = 46 ± 5) was ∼15% higher at lower concentrations (≤102/cm3) than at the higher aerosol concentrations (103/cm3) studied. This finding suggests that increasing ionization by adding additional ionizers might be helpful in increasing collection of biological particles. To check if the device performance varied between bacterial spores and cells, we repeated the collection experiments with Btk cells. The collection efficiencies were similar for both cells and spores.
Figure 5. Collection efficiency of TracB determined as a function of Btk aerosol concentration. Independent set of experiments were performed with Btk spore and cell suspension, each varying in concentration as 103, 106, and 108/mL. Upon nebulization, the corresponding aerosol concentration,10°, 102, and 103 #/cm3 was achieved. The device was operated at a flow rate of 10 lit/min, a precipitation voltage of 5 kV, and with the low-cost ionizer positioned perpendicular to the particle flow. The error bars represent the standard deviation for three repeats.
4.3. Effect of ionizer orientation
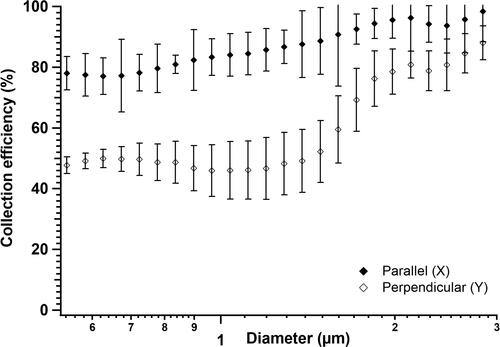
The ionization efficiency of the sampled particles in the TracB depends on the interaction of flow with the ions generated by the charger. We investigated the effect of ionization on collection efficiency by varying their orientation as parallel (orientation X) and perpendicular (orientation Y) to the particle flow field. With ionizer parallel to the flow field, TracB had 55% higher CE1 than when the ionizer was placed perpendicular (). When the charger was oriented perpendicular to the flow, the ionizing needle faces away from the incoming flow, reducing the interaction of ions with particles and eventually decreasing the collection efficiency. This effect of orientation was further investigated with the CFD simulations.
Figure 6. Collection efficiency of spores when the ionizers were placed parallel (X), and perpendicular (Y) to the air flow. The experiments were performed with the spores at a concentration of 102/cm3 at a fixed flow rate of 10 lit/min and at a precipitation voltage of 5 kV. Data represents the average of three replicates with the error bars representing the standard deviation.
The variation in the velocity of the particle flow fields was studied as a function of air ionizer orientation, as it would influence the trajectories of particles as they drift toward the collection plate. With the ionizer placed perpendicular to the flow field, a high velocity region was created around the ionizer as the flow moved around this obstruction (). The perpendicular orientation of the ionizer also resulted in a recirculation region behind the ionizer where the generated ions might be trapped. The combined effect of high velocity of particles passing around the ionizer and the low probability of interaction between particles and ions in the recirculating region are likely to affect particle charging efficiency in the perpendicular orientation. Additionally, the simulations suggest that particle collection in the perpendicular orientation () will be nonuniform, with higher collection on either side of the ionizer away from the recirculation region. These predictions match the visual observations of our collection plates where we observed greater particle loading along either side of the collection plate compared to the central region.
Figure 7. (a) Schematic showing side view of the TracB and the top view of velocity distribution in the bottom plane of the device simulated when the ionizer was placed, (b) perpendicular, and (c) parallel to the flow field. The color scale for (b) and (c) indicates the velocity values ranging from 0 to 0.6 m/s. The corresponding particle collection trajectories of 1 µm particles for perpendicular and parallel orientations are represented as side view (d) and (e), respectively. Top view of the particle collection shown in (f) and (g) corresponds to the planes of d and e as indicated by dashed arrows. Black rectangular areas in the figures represent the ionizer. The point where the particle lines end indicates the location where the particles are collected on the ground plate.
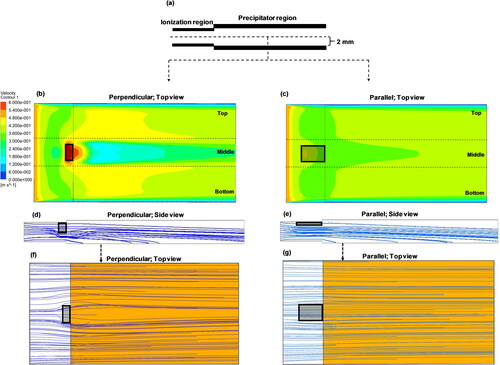
In the parallel orientation, as expected, a more spatially uniform velocity profile and particle trajectories were seen in the precipitator region (). The CFD-calculated collection efficiencies of 1 µm particles (carrying 10 elementary charges) for the perpendicular and parallel orientations of the charger were 32% and 33%, respectively. The difference in the collection efficiency values between the simulations and the experiments was because the efficiency of ionization not captured with the CFD simulations. By comparing the experimental results with simulations, it can be concluded that in the parallel orientation, the particles were charged ∼1.75 times higher than in the perpendicular orientation.
4.4. Bacterial inactivation in electrostatic precipitation
In addition to measuring the collection efficiency, the viability of Btk cells and spores collected by the electrostatic precipitation was tested. Prior to performing the viability experiments, the fraction of the live and dead spores in the stock solution was estimated. The percentage of viable spores in all our stock solutions varied from 95% to 97%. The effect of electric field strength on bacterial viability was studied by conducting experiments at 8 and 3 kV/cm. For the cells and spores at a concentration of 102/cm3, even a low electric field strength of 3 kV/cm caused inactivation. A threshold time for inactivation was found to be 5 min, beyond which little variation in inactivation was observed. From the live/dead staining experiments, the inactivation was found to be 95% after a 10 min exposure to 8 kV/cm of electric field (). The cultivation-based results for both the Btk cells and spores when exposed to 8 and 3 kV/cm electric field strengths corroborated with the results obtained from the staining tests. As shown in , the inactivation rates for both the cells and spores ranged from 95% to 99%, with the inactivation rates being slightly higher for the cells.
Figure 8. Electrostatic-precipitation-induced inactivation of the Btk spores and cells. The device was operated at 10 lit/min and the effect of two precipitation electric fields, 8 and 3 kV/cm, was tested for bacterial inactivation (%). Live-dead staining was performed with the Btk spores collected on the ground plate (102/cm3) using acridine orange (green, stains live cells) and propidium iodide (red, stains dead cells). Representative images depict (a) the live bacteria (stained green) and (b) the dead bacteria (stained red) from the 8 kV/cm electric field exposure. (c) Box and whisker plot depict the quantification of cell and spore inactivation (%) as a function of electric field, estimated from independent staining and the culturing experiments. The black rectangle in the box plot represents the interquartile range, the red line indicates the median inactivation %, and the 10th and 90th percentile values are indicated by the whiskers.
The reasons for the inactivation of the bacterial cells and spores are likely a combination of (i) electroporation of the cells/spores upon exposure to electric field (Garcia et al. Citation2016; Pillet et al. Citation2016) and (ii) ozone or reactive oxygen species formation in the ionizer through corona discharge, leading to cell inactivation (Han, Thomas, and Mainelis Citation2017; Zukeran et al. Citation2018). Previous studies have shown that when a pulsed electric field was applied to a bacterial suspension, cell death resulted from disruption of plasma membrane due to increased trans-membrane voltage (TMV). When the TMV crossed a critical threshold, the cell membrane was seen to be violently punctured, followed by the exudation of cell’s contents (Garcia et al. Citation2016; Pillet et al. Citation2016). The critical electric field threshold for electroporation was found to be highly species dependent – ranging from 3.6 to 6 kV/cm for three different bacterial cells studied (Garcia et al. Citation2016). A similar species-dependence of critical threshold electric field is expected for the airborne and fomite bacterial inactivation. As the dielectric strength of air (3 kV/cm) is 20 times lower than distilled water (65–75 kV/cm), the effective electric field for bacterial inactivation will be higher in air compared to any aqueous medium.
Airborne ozone at a concentration of 0.1 ppm has been reported to disinfect microorganisms in the indoor environment (Han, Thomas, and Mainelis Citation2017; Zukeran et al. Citation2018). The ozone generated in our device was found to be 0.4 ± 0.05 ppm/min. Hence, the bacterial inactivation that was observed is potentially due to the combined effect of electric field and ozone exposure. It should also be noted that the ozone generated will be diluted as soon as it leaves the device. The concentration even a few inches outside the unit will be much less than 70 ppb and well below the health-based standards. Further, the bacterial inactivation fraction can, however, be reduced by lowering the electric field strengths (<3 kV/cm) without compromising the collection efficiency of the device. This can be achieved with the design modifications such as increasing the height between the HV and ground plates from 4 mm to 1 cm for an operating voltage of ±3 kV. This will ensure a high flow rate with a reduced electric field strength of 1.2 kV/cm. Often, however, inactivation of collected biological particles is desired, as this simplifies safe handling of the device and samples. Such inactivation will not impose difficulties for downstream analyses, which will be conducted using molecular biological techniques.
5. Conclusions
A compact, portable, low-cost electrostatic bioaerosol sampler was designed, developed, and tested for collection of aerosolized biological and nonbiological particles. The sampler design is optimized for long-term, large-scale deployment of the units. The performance of the unit was evaluated for its collection efficiency and viability of the collected samples, and the design was optimized based on the results. Using a low-pressure design, the device can sample a high flowrate of 10 lit/min with a low-power fan. The device was seen to collect dust particles with an efficiency of >80%. With an ionizer placed upstream of the precipitator, and its orientation optimized for charging performance, the collection efficiency of the device in collecting biological particles of 1 µm was as high as 84 ± 7%.
The fate of bacterial cells and spores collected by the device in the presence of electric field and external ionization was investigated. The combined effect of electric field and the ozone generated in the device were seen to inactivate the bacteria collected by 95%. While efficient inactivation of collected samples would reduce the chances of accidental disease transmission during device handling, it does not affect the ability to perform gene-based assays such as quantitative polymerase chain reaction (qPCR) and next-generation sequencing (NGS) to make quantitative estimates of microbial abundance and diversity. Considering the device’s low-power requirement, absence of any need for a working fluid, low-cost, completely integrated in a single unit, it is suitable for long-term field sampling in diverse indoor and outdoor locations. TracB is currently being tested under field conditions. As future work, design modifications are planned to reduce the size of the device and increase its sampling flowrate.
Supplemental Material
Download MS Word (3.9 MB)Additional information
Funding
References
- Allegranzi, B., S. B. Nejad, C. Combescure, W. Graafmans, H. Attar, L. Donaldson, and D. Pittet. 2011. Burden of endemic health-care-associated infection in developing countries: Systematic review and meta-analysis. Lancet 377 (9761):228–41. doi:https://doi.org/10.1016/S0140-6736(10)61458-4.
- Allen, J. G., and L. C. Marr. 2020. Re-thinking the potential for airborne transmission of SARS-CoV-2. Preprints 1–4. doi:https://doi.org/10.20944/preprints202005.0126.v1.
- Bloomfield, L. E., and T. V. Riley. 2016. Epidemiology and risk factors for community-associated clostridium difficile infection: a narrative review. Infect. Dis. Ther. 5 (3):231–51. doi:https://doi.org/10.1007/s40121-016-0117-y.
- Casadevall, A. 2019. Global catastrophic threats from the fungal kingdom: fungal catastrophic threats. Curr. Top. Microbiol. Immunol. 424:21–32.
- Crawford, J. A., P. F. Rosenbaum, S. E. Anagnost, A. Hunt, and J. L. Abraham. 2015. Indicators of airborne fungal concentrations in urban homes: understanding the conditions that affect indoor fungal exposures. Sci. Total Environ. 517:113–124.
- Ding, X., C. F. Fronczek, and J. Y. Yoon. 2015. Biosensors for monitoring airborne pathogens. J. Lab. Autom. 20 (4):390–410. doi:https://doi.org/10.1177/2211068215580935.
- Douwes, J., P. Thorne, N. Pearce, and D. Heederik. 2003. Bioaerosol health effects and exposure assessment: progress and prospects. Ann. Occup. Hyg. 47 (3):187–200. doi:https://doi.org/10.1093/annhyg/meg032.
- Duchaine, C. 2016. Assessing microbial decontamination of indoor air with particular focus on human pathogenic viruses. Am. J. Infect. Control. 44 (9 Suppl):S121–S126. doi:https://doi.org/10.1016/j.ajic.2016.06.009.
- Edmonds, J. M. 2009. Efficient methods for large-area surface sampling of sites contaminated with pathogenic microorganisms and other hazardous agents: current state, needs, and perspectives. Appl. Microbiol. Biotechnol. 84 (5):811–6. doi:https://doi.org/10.1007/s00253-009-2136-z.
- Emerson, J. B., R. I. Adams, C. M. B. Román, B. Brooks, D. A. Coil, K. Dahlhausen, H. H. Ganz, E. M. Hartmann, T. Hsu, N. B. Justice, et al. 2017. Schrödinger's microbes: tools for distinguishing the living from the dead in microbial ecosystems. Microbiome 5 (1):86. doi:https://doi.org/10.1186/s40168-017-0285-3.
- Fisher, M. C., D. a Henk, C. J. Briggs, J. S. Brownstein, L. C. Madoff, S. L. McCraw, and S. J. Gurr. 2012. Emerging fungal threats to animal, plant and ecosystem health. Nature 484 (7393):186–94. doi:https://doi.org/10.1038/nature10947.
- Forsyth, B., B. Y. H. Liu, and F. J. Romay. 1998. Particle Charge Distribution Measurement for Commonly Generated Laboratory Aerosols. Aerosol Sci. Technol 28 (6):489–501. doi:https://doi.org/10.1080/02786829808965540.
- Friedman, D. Z. P., and I. S. Schwartz. 2019. Emerging fungal infections: new patients, new patterns, and new pathogens. J. Fungi 5 (3):67.
- Garcia, P. A., Z. Ge, J. L. Moran, and C. R. Buie. 2016. Microfluidic screening of electric fields for electroporation. Sci. Rep. 6 (February):1–11.
- Hageman, J. H., G. W. Shankweiler, P. R. Wall, K. Franich, G. W. McCowan, S. M. Cauble, J. Grajeda, and C. Quinones. 1984. Single, chemically defined sporulation medium for Bacillus subtilis: growth, sporulation, and extracellular protease production. J. Bacteriol. 160 (1):438–41. doi:https://doi.org/10.1128/JB.160.1.438-441.1984.
- Han, T., and G. Mainelis. 2008. Design and development of an electrostatic sampler for bioaerosols with high concentration rate. J. Aerosol. Sci. 39 (12):1066–78. doi:https://doi.org/10.1016/j.jaerosci.2008.07.009.
- Han, T. T., N. M. Thomas, and G. Mainelis. 2017. Design and development of a self-contained personal electrostatic bioaerosol sampler (PEBS) with a wire-to-wire charger. Aerosol. Sci. Technol. 51 (8):903–15. doi:https://doi.org/10.1080/02786826.2017.1329516.
- Haque, M., M. Sartelli, J. McKimm, and M. A. Bakar. 2018. Health care-associated infections – an overview. Infect. Drug Resist. 11:2321–33. doi:https://doi.org/10.2147/IDR.S177247.
- He, M., S. Dhaniyala, and M. Wagner. 2016. Characterization of filter performance under low-pressure operation. Aerosol. Sci. Technol. 50 (5):417–28. doi:https://doi.org/10.1080/02786826.2016.1162902.
- He, M., N. Kuerbanjiang, and S. Dhaniyala. 2020. Performance characteristics of the low-cost Plantower PMS optical sensor. Aerosol. Sci. Technol. 54 (2):232–41. doi:https://doi.org/10.1080/02786826.2019.1696015.
- Herfst, S., M. Böhringer, B. Karo, P. Lawrence, N. S. Lewis, M. J. Mina, C. J. Russell, J. Steel, R. L. de Swart, and C. Menge. 2017. Drivers of airborne human-to-human pathogen transmission. Curr. Opin. Virol. 22:22–9. doi:https://doi.org/10.1016/j.coviro.2016.11.006.
- Hoisington, A. J., J. P. Maestre, M. D. King, J. A. Siegel, and K. A. Kinney. 2014. Impact of sampler selection on the characterization of the indoor microbiome via high-throughput sequencing. Build. Environ. 80:247–282.
- Kampf, G., D. Todt, S. Pfaender, and E. Steinmann. 2020. Persistence of coronaviruses on inanimate surfaces and their inactivation with biocidal agents. J. Hosp. Infect. 104 (3):246–51. doi:https://doi.org/10.1016/j.jhin.2020.01.022.
- Lax, S., N. Sangwan, D. Smith, P. Larsen, K. M. Handley, M. Richardson, K. Guyton, M. Krezalek, B. D. Shogan, J. Defazio, et al. 2017. Bacterial colonization and succession in a newly opened hospital. Sci. Transl. Med. 9 (391):eaah6500. doi:https://doi.org/10.1126/scitranslmed.aah6500.
- Ma, Z., Y. Zheng, Y. Cheng, S. Xie, X. Ye, and M. Yao. 2016. Development of an integrated microfluidic electrostatic sampler for bioaerosol. J. Aerosol. Sci. 95:84–94. doi:https://doi.org/10.1016/j.jaerosci.2016.01.003.
- Mainelis, G., A. Adhikari, K. Willeke, S. A. Lee, T. Reponen, and S. A. Grinshpun. 2002. Collection of airborne microorganisms by a new electrostatic precipitator. J. Aerosol. Sci. 33 (10):1417–32. doi:https://doi.org/10.1016/S0021-8502(02)00091-5.
- Mainelis, G., S. A. Grinshpun, K. Willeke, T. Reponen, V. Ulevicius, and P. J. Hintz. 1999. Collection of airborne microorganisms by electrostatic precipitation. Aerosol. Sci. Technol. 30 (2):127–44. doi:https://doi.org/10.1080/027868299304732.
- Mainelis, G., K. Willeke, P. Baron, T. Reponen, S. A. Grinshpun, R. L. Górny, and S. Trakumas. 2001. Electrical charges on airborne microorganisms. J. Aerosol. Sci. 32 (9):1087–110. doi:https://doi.org/10.1016/S0021-8502(01)00039-8.
- Murata, K., and D. Zhang. 2013. Applicability of LIVE/DEAD baclight stain with glutaraldehyde fixation for the measurement of bacterial cell concentration and viability in the air. Aerosol. Air Qual. Res. 13 (6):1755–67. doi:https://doi.org/10.4209/aaqr.2012.10.0293.
- Nazaroff, W. W. 2016. Indoor bioaerosol dynamics. Indoor Air. 26 (1):61–78. doi:https://doi.org/10.1111/ina.12174.
- Park, C. W., J. W. Park, S. H. Lee, and J. Hwang. 2014. Real-time monitoring of bioaerosols via cell-lysis by air ion and ATP bioluminescence detection. Biosens. Bioelectron. 52: 379–383.
- Pillet, F., C. Formosa-Dague, H. Baaziz, E. Dague, and M. P. Rols. 2016. Cell wall as a target for bacteria inactivation by pulsed electric fields. Sci. Rep. 6(September 2015):1–8.
- Priyamvada, H., R. K. Singh, M. Akila, R. Ravikrishna, R. S. Verma, and S. S. Gunthe. 2017. Seasonal variation of the dominant allergenic fungal aerosols – one year study from southern Indian region. Sci. Rep. 7 (1):11171.
- Prussin, A. J., L. C. Marr, and K. J. Bibby. 2014. Challenges of studying viral aerosol metagenomics and communities in comparison with bacterial and fungal aerosols. FEMS Microbiol. Lett. 357 (1):1–9. doi:https://doi.org/10.1111/1574-6968.12487.
- Raberalam, T., M. Balde, S. Hantova, A. Vena, H. Marchandin, and B. Sorli. 2017. Feasibility of capacitive aptasensor on paper to detect pathogenic bacteria responsible for nosocomial infection. Proc. Technol. 27:295–8. doi:https://doi.org/10.1016/j.protcy.2017.04.122.
- Ranjan, M., and S. Dhaniyala. 2009. A novel electrical-mobility-based instrument for total number concentration measurements of ultrafine particles. J. Aerosol Sci. 40 (5):439–50. doi:https://doi.org/10.1016/j.jaerosci.2009.01.007.
- Ranjan, M., and S. Dhaniyala. 2008. A new miniature electrical aerosol spectrometer (MEAS): experimental characterization. J. Aerosol Sci. 39 (8):710–22. doi:https://doi.org/10.1016/j.jaerosci.2008.04.005.
- Ranjan, M., and S. Dhaniyala. 2007. Theory and design of a new miniature electrical-mobility aerosol spectrometer. J. Aerosol Sci. 38 (9):950–63. doi:https://doi.org/10.1016/j.jaerosci.2007.07.005.
- Santarpia, J. L., D. N. Rivera, V. Herrera, M. J. Morwitzer, H. Creager, G. W. Santarpia, K. K. Crown, D. Brett-Major, E. Schnaubelt, M. J. Broadhurst, et al. 2020. Transmission potential of SARS-CoV-2 in viral shedding observed at the university of Nebraska medical center. medRxiv doi:10.2020.03.23.20039446.
- Sattar, S. A. 2016. Indoor air as a vehicle for human pathogens: introduction, objectives, and expectation of outcome. Am. J. Infect. Control. 44 (9 suppl):S95–S101. doi:https://doi.org/10.1016/j.ajic.2016.06.010.
- Schaeffer, A. B., and M. D. Fulton. 1933. A simplified method of staining endospores. Science (80)., 77 (1990):194. doi:https://doi.org/10.1126/science.77.1990.194.
- Stadnytskyi, V., C. E. Bax, A. Bax, and P. Anfinrud. 2020. The airborne lifetime of small speech droplets and their potential importance in SARS-CoV-2 transmission. Proc. Natl. Acad. Sci. U. S. A 117 (22):11875–11877.
- Tavares, M. B., R. D. Souza, W. B. Luiz, R. C. M. Cavalcante, C. Casaroli, E. G. Martins, R. C. C. Ferreira, and L. C. S. Ferreira. 2013. Bacillus subtilis endospores at high purity and recovery yields: Optimization of growth conditions and purification method. Curr. Microbiol. 66 (3):279–285. doi:https://doi.org/10.1007/s00284-012-0269-2.
- Wang, C. H., B. T. Chen, B. C. Han, A. C. Y. Liu, P. C. Hung, C. Y. Chen, and H. J. Chao. 2015. Field evaluation of personal sampling methods for multiple bioaerosols. PLoS One. 10 (3):e0120308. doi:https://doi.org/10.1371/journal.pone.0120308.
- Yan, J., M. Grantham, J. Pantelic, P. J. B. De Mesquita, B. Albert, F. Liu, S. Ehrman, and D. K. Milton. 2018. Infectious virus in exhaled breath of symptomatic seasonal influenza cases from a college community. Proc. Natl. Acad. Sci. U. S. A 115 (5):1081–1086.
- Yang, H., S. Dhaniyala, and M. He. 2018. Performance of bipolar diffusion chargers: experiments with particles in the size range of 100 to 900 nm. Aerosol Sci. Technol. 52 (2):182–191. doi:https://doi.org/10.1080/02786826.2017.1387641.
- Yao, M., G. Mainelis, and H. R. An. 2005. Inactivation of microorganisms using electrostatic fields. Environ. Sci. Technol. 39 (9):3338–3344. doi:https://doi.org/10.1021/es048808x.
- Zhang, R., Y. Li, A. L. Zhang, Y. Wang, and M. J. Molina. 2020. Identifying airborne transmission as the dominant route for the spread of COVID-19. Proc. Natl. Acad. Sci. U. S. A. 117 (26):14857–14863. doi:https://doi.org/10.1073/pnas.2009637117.
- Zukeran, A., H. Sawano, K. Ito, R. Oi, I. Kobayashi, R. Wada, and J. Sawai. 2018. Investigation of inactivation process for microorganism collected in an electrostatic precipitator. J. Electrostat. 93:70–77. doi:https://doi.org/10.1016/j.elstat.2018.04.002.