
 ?Mathematical formulae have been encoded as MathML and are displayed in this HTML version using MathJax in order to improve their display. Uncheck the box to turn MathJax off. This feature requires Javascript. Click on a formula to zoom.
Abstract
As a consequence of the COVID-19 pandemic caused by the SARS-CoV-2 virus, the widespread daily use of face masks is promoted worldwide. Particle-size dependent filtration efficiencies (FE; dp = 30 nm–10 µm), applying a particle counting approach, and additionally pressure drops (Δp) were determined for 44 samples of household materials and several medical masks. Huge FE differences were found between sample materials and for different particle sizes, spanning from <10% up to almost 100%. Minimum FE were determined for dp = 50–500 nm particles with significantly larger values for dp = 30 nm particles and especially for those with dp > 2.5 µm. Measurements at different numbers of layers showed that stacks of textiles can be treated as separate filters and total FE and Δp can readily be estimated from the features of the individual layers, leaving laborious measurements of individual combinations obsolete. For many materials, electrostatic attraction contributes strongly to overall FE for particles up to 100 nm diameter. Measurements with defined leaks showed that already a small fractional leak area of 1–2% can strongly deteriorate total FE. This is especially the case for particles smaller than 5 µm diameter, where FE dropped by 50% or even two thirds. Our measurements show that by stacking an adequate number of layers of many fabrics, decent filtration efficiencies can be reached for homemade face masks over large particle size ranges with acceptable pressure drop across the material. Very important, however, is good fit of the masks to minimize leak flows and selection of non-hazardous mask material.
EDITOR:
1. Introduction
Within months, the current coronavirus disease 2019 (COVID-19) pandemic has spread over the whole planet. As a consequence of this massive outbreak, social and economic life is severely affected in many countries (Leopoldina – German National Academy of Sciences Citation2020) due to a combination of widespread lockdowns as well as physical and social distancing measures, recommended or enforced by national health authorities and politics (Zhang et al. Citation2020).
COVID-19 spreads via transmission of the severe acute respiratory syndrome coronavirus 2 (SARS-CoV-2), involving virus-containing respiratory fluids and saliva (WHO Citation2020a). The World Health Organization (WHO) has suggested that the primary transmission modes of SARS-CoV-2 are person-to-person transmission (i.e., droplet transmission) and contact with contaminated surfaces (WHO Citation2020a, Citation2020c). The rapid spread of the virus as well as various studies, e.g., showing transmission over distances >1–2 m (Li et al. Citation2020), however, suggest that also other routes of transmission such as airborne transmission may play an important role (Hadei et al. Citation2020; van Doremalen et al. Citation2020; Morawska and Milton Citation2020; Zhang et al. Citation2020). The corresponding details, however, are not completely known yet (Morawska and Milton Citation2020; Zhang et al. Citation2020; Hadei et al. Citation2020; Klompas, Baker, and Rhee Citation2020).
Droplet transmission is based on respiratory droplets, which, according to WHO convention (Gralton et al. Citation2011; WHO Citation2014; Kutter et al. Citation2018), have a diameter (dp) of 5 µm and larger. Contact (or fomite) transmission can occur via deposition of virus-containing respiratory fluids on surfaces when they are touched by a person who subsequently touches the own nose, mouth, or eyes (WHO Citation2014). In airborne (or aerosol) transmission, the virus is transported via droplet nuclei or smaller aerosol particles (dp ≤ 5 µm) suspended in air (WHO Citation2014), which can stay suspended in air over extended periods of time (Hinds Citation1999). Airborne transmission requires that the virus remains infectious in droplet nuclei over extended time periods. This is known to be the case for pathogens causing pulmonary tuberculosis, measles, or chickenpox (WHO Citation2014), however, also for SARS-CoV-2 viability in aerosol particles over more than an hour has been demonstrated (van Doremalen et al. Citation2020).
Exhaled respiratory particles cover a particle size range from dp = 0.01 µm up to 1000 µm (Gralton et al. Citation2011; Bake et al. Citation2019 and references therein), generated by coughing and sneezing, but also during speaking and regular breathing (Chao et al. Citation2009; Morawska et al. Citation2009; Johnson et al. Citation2011; Bake et al. Citation2019). Breathing generates the smallest particles (typically dp < 4 µm) with a mode diameter around 0.8 µm, caused by fluid film burst during airway reopening (Bake et al. Citation2019; Johnson et al. Citation2011), with particle concentrations increasing with exhalation depth (Bake et al. Citation2019). Slightly larger particles were observed from whispering and speaking, with more particles being generated from voiced activities than from whispered (Morawska et al. Citation2009). These particles as well as those from coughing are generated by vocal cord vibrations and aerosolization in the laryngeal region; their count mode diameters were found to be around dp = 1 µm (Johnson et al. Citation2011) or 6 µm (Chao et al. Citation2009). Their concentrations were found to be an order of magnitude higher than those from breathing (Morawska et al. Citation2009), increasing with speech loudness (Asadi et al. Citation2019). Much larger droplets are generated in the upper respiratory tract during speaking, coughing, and sneezing with dp around 200 µm (Johnson et al. Citation2011).
The fate and hazardousness of potentially virus-containing droplets after exhalation strongly depends on their size. Small droplets, smaller than several tens of µm, evaporate within seconds (Morawska et al. Citation2009; Gralton et al. Citation2011; Parienta et al. Citation2011; Chaudhuri et al. Citation2020), leaving droplet nuclei of 30–50% of their initial diameter, depending on the amount of dissolved material. Droplet nuclei with dp < 10 µm can remain airborne over extended periods of time and can be inhaled, with smaller particles reaching deeper regions of the respiratory system (Oberdörster, Oberdörster, and Oberdörster Citation2005). Very large droplets, dp > 100 µm, sediment quickly and are mostly deposited on a surface before they evaporate (Chaudhuri et al. Citation2020). The number of virions within a single respiratory particle depends on the virus titer in the source region and increases with the cube of the particle diameter. With SARS-CoV-2 viral loads of 4.6·105 copies per mL of nasopharyngeal sample (Bae et al. Citation2020), about 20% of exhaled 100 µm diameter droplets would contain a virion; for 10 µm droplets only 2 out of 10,000 particles would contain a virion and for dp = 1 µm droplets this fraction would be another 1000 times smaller.
To prevent transmission of COVID-19, the wearing of face masks in addition to thorough hand hygiene and physical distancing is advised (e.g., WHO Citation2020b; Leopoldina – German National Academy of Sciences Citation2020). Health workers are recommended to wear a surgical mask, certified according to a set of test methods like European standard EN 14683, or filtering facepiece respirators (FFR), certified for filtration efficiency and seal leakage rate according to test procedures like European standard EN 149 (e.g., FFP2), which protect the wearer (Lee, Grinshpun, and Reponen Citation2008; Oberg and Brosseau Citation2008). Under conditions of severe medical mask supply shortage, the use of cloth masks is recommended for the general public only (WHO Citation2020b).
The massive demand for medical masks during the first months of the pandemic caused shortage of supply of such devices in many countries. Therefore, numerous people make their own cloth masks using various kinds of available fabrics. In addition, new suppliers of simple cloth masks mushroom, frequently offering masks of questionable filtration efficiency and quality. Furthermore, in many countries suffering from poor air quality, people wear simple cloth masks to protect themselves from particulate air pollution (Shakya et al. Citation2017; Neupane et al. Citation2019), known to cause various adverse health effects (Jacobson Citation2012; WHO Citation2016).
Particle removal from an airstream is caused by five physical mechanisms: interception, inertial impaction, gravitational settling, diffusion, and electrostatic attraction (Hinds Citation1999). While the first three mechanisms increase in efficiency with increasing particle size, the latter two are more efficient for smaller particles. This results in typical filtration efficiency curves with a minimum for particles of around 0.05 µm to 0.5 µm diameter (most penetrating particle size, Hinds Citation1999). Larger face velocities cause an increase of deposition by impaction, however, gravitational settling, diffusion, and electrostatic attraction become less efficient under such conditions.
Both applications of cloth masks, protection from respiratory disease transmission and from particulate air pollution, require the removal of particles within a large size range. Exhaled respiratory particles range in diameter from 0.01 µm to 1000 µm (Bake et al. Citation2019) with particles smaller than ∼10 µm in diameter being respirable. Urban air pollution contains ultrafine particles (dp < 100 nm), e.g., diesel soot particles, fine particles (dp < 1 µm) with secondary pollutants, as well as coarse particles (dp > 1 µm), often consisting of mineral dust and sea salt (e.g., Jacobson Citation2012 and references therein).
Several studies on filtration efficiency of simple cloth masks or fabrics which can be used to make such masks can be found in the literature (Rengasamy, Eimer, and Shaffer Citation2010; Davies et al. Citation2013; Shakya et al. Citation2017; Neupane et al. Citation2019; Konda et al. Citation2020; Lustig et al. Citation2020). These studies present results only for a very limited variety of materials with no or only little systematic investigation of factors influencing particle filtration efficiency. Therefore, in order to support the selection of adequate materials for making cloth face masks and to better understand which factors affect mask efficacy, we performed systematic measurements of particle size-resolved (dp = 30 nm–10 µm) filtration efficiency and of pressure drop for 44 typical household materials and several medical masks under different experimental conditions, including different face velocities, number of sample layers, and leaks.
2. Methods and materials
Filtration efficiency of sample materials was determined by measuring particle transmission through the respective samples, applying different particle counting methods: the CPC setup (Condensation Particle Counter setup) for measurement of electrically charged and neutralized aerosol particles in the diameter range from 30 nm up to 500 nm; and the SMPS/OPC setup (Scanning Mobility Particle Sizer/Optical Particle Counter setup) using ambient aerosol particles (dp = 30 nm–10 µm).
2.1. Design of the CPC setup
The CPC setup is presented schematically in . NaCl aerosol is generated using a nebulizer (model 3076, TSI, Inc.) and a silica gel diffusion dryer. A differential mobility analyzer (DMA, model 3081, with X-ray aerosol neutralizer model 3088, both TSI, Inc.) is used to generate monodisperse aerosol of the desired dp. Note that this provides mobility particle diameter (i.e., dp = dmob), which is used throughout this article. The resulting aerosol is either directly used (“charged aerosol”) or it is directed through an additional aerosol neutralizer (model 5522-A, Grimm Aerosoltechnik) to bring the aerosol into the natural charge equilibrium again (“neutralized aerosol”). After dilution with particle-free air and turbulent mixing of sample and dilution flow in a 15 cm long piece of ¼” tubing the aerosol passes the sample (i.e., the mask or cloth material), fixed in a sample holder (ID = 65 mm). The flow through the sample is maintained using a vacuum pump (model V-VTE-10, Rietschle) and an adjustable valve and measured using a thermal mass flow meter (model 4043, TSI, Inc.). In front of and behind the sample holder, partial flows of the aerosol are diverted to two water-based CPCs (model 3787, TSI, Inc.) in order to measure respective particle number concentrations. The pressure difference across the sample is measured using a differential pressure sensor (model testo 440 dP, Testo SE & Co. KGaA).
Figure 1. Experimental setups: (a) CPC setup, (b) SMPS/OPC setup.
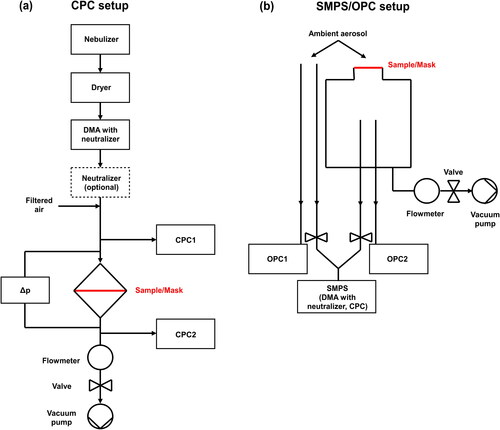
2.2. Design of the SMPS/OPC setup
For measurement of filtration efficiencies for particles up to dp = 10 µm, the SMPS/OPC setup () was adopted, using ambient aerosol, which entered the room through an open gate. The aerosol was drawn through the sample, which was fixed onto a flange (ID = 70 mm) on the top of a 20-liter flow chamber. The flow was maintained using a vacuum pump (model SH-110, Varian, Inc.) connected to the bottom of the flow chamber in combination with an adjustable valve and a thermal mass flow meter (model 4043, TSI, Inc.). Particle size distributions in the diameter range from 250 nm up to more than 10 µm were measured simultaneously with two OPCs (model 1.109, Grimm Aerosoltechnik). The two instruments used vertical inlet lines (l = 50 cm) with inlet openings in the center of the flow chamber and next to the flow chamber inlet in ambient air, respectively. In addition, particle size distributions (dp = 20 nm–450 nm) were measured using a single SMPS system, alternating between two inlet lines with openings in and next to the flow chamber. The SMPS consisted of an X-ray aerosol neutralizer (model 3088, TSI, Inc.), an electrostatic classifier (model 3082, TSI, Inc.) with a differential mobility analyzer (model 3081A, TSI, Inc.), and a nano water-based CPC (model 3788, TSI, Inc.).
2.3. Sample materials
A total of 48 different sample materials were investigated:
twelve pure cotton fabrics, including woven textiles with different thread counts as well as jersey and velvet cotton,
five fabrics containing cotton mixed with synthetics, including flannel, French terry, and velour,
eleven synthetic fiber samples including woven and jersey materials,
four paper-like materials (paper towels, coffee filter, paper tissue),
four natural fiber materials (linen, wool, silk),
eight synthetic household materials such as vacuum cleaner bags, a vacuum cleaner bag backup filter, anti-allergic mattress and linen encasements, and polyurethane (PU) foams,
three commercially available surgical masks (EN 14683) and one FFP2 mask (EN 149); a separate surgical mask (EN 14683) was used for the measurements of the influence of leaks on filtration efficiency.
A list of all sample materials with details like thread count, material area density, and composition is provided in the supplementary information (SI, Table S1). As customary in the textile industry, for woven materials, thread count was determined as the sum of warp and filling threads in one square inch of the textile. For knitted materials, we determined an estimate of the thread count by counting the number of stitches along the base and the height of the same square and multiplication by three to account for the number of threads confining each stitch. Material area density (in g m−2) was determined by weighing a 20 mm diameter punch of the material and expanding this value to the mass per square meter. For the analysis, both numbers were multiplied with the numbers of layers of the material used for the measurements. When mounting stretchable fabrics in the sample holder, special care was taken not to expand them.
3. Test procedure and analysis
3.1. Measurements and data analysis for the CPC setup
One CPC measured upstream and one downstream the sample for 30 s (1-s time resolution), then the CPCs were swapped for another 30 s measurement to account for potential instrumental differences. The transmission T was calculated as the geometric mean of the ratio of measured downstream to upstream concentrations of both measurements, and corrected for setup-inherent particle losses by multiplying with an experimentally determined correction factor of 0.99. Each measurement was divided into three subsets and repeated three times with freshly mounted sample material, resulting in a total of nine measurements of which the average and as measurement uncertainty the 1-sigma standard deviation of the average were calculated. All measurements were performed with particles of 30 nm, 50 nm, 100 nm, 250 nm, and 500 nm diameter, for both charged and neutralized aerosol, at two flow rates which correspond to face velocities at the filter of 5.3 cm s−1 and 12.9 cm s−1, respectively. For more details, see SI (Section S1).
Pressure drop Δp across the sample was measured threefold after stabilization of the reading and corrected for the flow resistance of the tubes between the pressure gauge connections, determined at the same flow with no sample installed. Uncertainty of Δp was typically 1 Pa.
3.2. Measurement and data analysis for the SMPS/OPC setup
After 5 min equilibration time, SMPS and OPC measurements were performed in parallel: while the two OPCs sampled for ∼20 min at 6-s time resolution filtered and ambient air, respectively, providing three subsets of ∼7 min each, the SMPS was switched between the two air flows after each 150 s scan, resulting in three ambient/filtered air sample pairs per measurement. This measurement was repeated three times with a newly mounted sample, providing nine individual values of filtration efficiency in total. Size-resolved filtration efficiencies FE (defined as FE[%] = 100 · (1 – T), with transmission T the ratio of average particle number concentration at a given diameter measured in filtered to that in ambient air) were calculated individually from the SMPS and OPC measurements. Afterwards they were merged to a single filtration efficiency curve. From this curve, FE for the chosen particle diameters (30 nm, 50 nm, 100 nm, 250 nm, 500 nm, 1 µm, 2.5 µm, 5 µm, and 10 µm) were obtained. Instrumental differences between the OPCs were accounted for by applying an experimentally determined size-dependent correction factor. All measurements were performed at the two face velocities also used in the CPC setup. More details are provided in the SI (Section S2).
In addition to the standard deviation of the average, also the uncertainty due to counting statistics (dominating uncertainty at low particle number concentrations) was calculated for each particle size. Provided in the results section are always the larger of the two uncertainty values.
4. Results
4.1. Overview of filtration efficiencies of masks and potential mask materials
Exemplary filtration efficiency curves for both face velocities are shown in for jersey (2 layers), velvet polyester, vacuum cleaner bag (#2), and silk (thin). Filtration efficiency curves for all materials are shown in the SI (Figures S1–S7). As expected from filtration theory (see Section 1; Hinds Citation1999), a minimum in FE is found between 50 nm and 500 nm for all samples. More efficient diffusion and electrostatic attraction for smaller particles, and interception, impaction, and gravitational settling for larger particles result in larger FE toward both ends of the probed size range. The absolute level of filtration efficiencies for particles of individual diameters as well as the diameter of minimum efficiency depend on the respective efficiencies of the various deposition mechanisms. For increased face velocity, diffusion and electrostatic attraction (mainly affecting very small particles) are less effective while impaction (mainly affecting large particles) is more effective. This causes a shift of the diameter of minimum FE toward smaller particles, reduced FE values for very small particles, and increased FE for the larger particles for higher face velocity ( and SI Figures S1–S7).
Figure 2. Filtration efficiency as a function of particle diameter measured using ambient aerosol (SMPS/OPC setup) at low (5.3 cm s−1, dashed lines) and high (12.9 cm s−1, solid lines) face velocity for cotton jersey (2 layers), thin silk, vacuum cleaner bag #2, and velvet polyester.
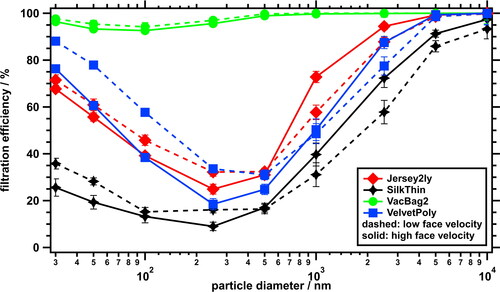
A very large spread in filtration efficiencies was observed for all particle sizes between the various materials and even between the different surgical masks (SI Figure S7). For many samples, high filtration efficiency for large particles was found: more than 30 of the samples have FE > 80% for particles with dp ≥ 5 µm. In contrast, only few samples showed good filtration efficiency for very small particles: only six samples at the lower and even fewer at the higher face velocity filtered >80% of 30 nm diameter particles. In the filtration minimum, only seven samples were able to filter >50% of the particles at the higher face velocity; all these materials were nonwoven materials like medical masks, mattress encasement, vacuum cleaner bags, and backup filter.
For direct comparison of all sample materials, FE bar charts for each particle size are presented in the SI (Figures S9–S22). As particle deposition for particles with sizes below or above the filtration minimum is dominated by different mechanisms, we calculated average filtration efficiencies for both particle size ranges (small particles: dp = 30 nm–250 nm; large particles: dp = 500 nm–10 µm) for simpler comparison of potential mask materials ( and SI Figure S8 for low and high face velocity, respectively). The pressure drop across the sample material was determined for standard flow conditions (i.e., 8 L min−1 flow rate through a sample of 25 mm diameter) as defined for certification of surgical face masks in the European standard EN14683 (Citation2019). According to this standard, these pressure drops are calculated by dividing the measured pressure drop by the sample area (4.9 cm2) and are provided in units of Pa cm−2 ().
Figure 3. Filtration efficiencies measured at low face velocity (5.3 cm s−1) for (a) small particles (dp = 30 to 250 nm) in neutralized, charged (both CPC setup), and ambient (SMPS/OPC setup) aerosol, and for (b) large particles (dp = 500 nm to 10 µm) in ambient aerosol (SMPS/OPC setup). Values are sorted according to filtration efficiency averaged over all particle sizes. (c) shows the standard pressure drop across the samples, sorted for decreasing values.
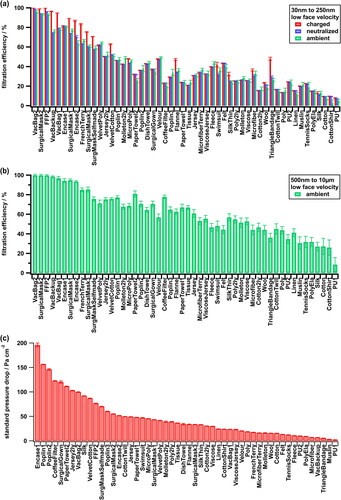
FE for small particles ( and SI Figure S8) are presented for completely charged, neutralized, and ambient aerosol. For materials with charged fibers, electrostatic attraction can enhance FE for particles in this size range. Therefore, enhanced FE for the charged aerosol is a good indication that the respective sample material contains either permanently or temporarily (e.g., due to the handling of the material) electrostatic charges on its fibers. Almost all materials which show such behavior consist completely or largely of synthetic components. The only exceptions to this are velvet cotton and thin silk, which are made of pure cotton and silk, respectively, and show slightly higher filtration efficiency for charged aerosol, compared to incompletely charged aerosol.
The largest FE were mostly found for samples with a strong electrostatic deposition component. However, a strong electrostatic deposition component is not a guarantee for good filtration efficiency. Several samples like flannel, thin silk, swimsuit, or the triangle bandage show enhanced filtration efficiency for charged particles, albeit at rather low overall FE level (). Generally, filtration efficiency for ambient, i.e., incompletely charged, aerosol is relatively low for small particles with only four samples (vacuum cleaner bag #2, encasement #1, FFP2, and surgical mask #2) exceeding 80% FE on average. Extremely low filtration efficiencies (polyester, polyester with elastane, woven cotton, cotton shirt, silk, linen, polyurethane foam samples) are associated with either thin or rather open material structures, i.e., with materials with high porosity.
Filtration efficiencies for large particles () are typically larger than those for small particles (). Especially for the largest particles used in this study (dp = 5 µm and 10 µm) FE approaching 100% were found for many samples (SI Figures S21 and S22). Unsurprisingly, the largest filtration efficiencies were mostly found for materials which were specifically designed for the purpose of filtering particles, like vacuum cleaner bags or medical masks. However, also many other materials show substantial filtration capability (FE ≥ 50%) for the large particle size range. Therefore, these could be useful in masks if it is intended to remove larger respiratory droplets from the air flow.
The best filtration efficiency is not very helpful for making a cloth mask if it is too hard to breathe through the respective material. Even though all samples were selected as potential candidates for making cloth masks, e.g., from the point of view of material strength or sample material thickness, very significant differences were found in the measured pressure drop values (). Three self-made masks made of mattress encasement and of poplin combinations showed the largest pressure drop values of ca. 150 to 200 Pa cm−2. Many of the other samples ranged between 20 and 50 Pa cm−2, where also the surgical masks can be found. A few samples like muslin, a microfiber cloth, vacuum cleaner bag backup filter, triangle bandage, polyester with elastane, and PU foam were very easy to breathe through with pressure drop values below 10 Pa cm−2.
4.2. Dependence of filtration efficiency and pressure drop on face velocity and number of layers
To determine the relationships between face velocity, number of layers of the material, pressure drop, and filtration efficiency, we performed a number of systematic measurements. For a selection of four materials (cotton jersey, cotton woven, molleton, and polyester) we measured FE and Δp for samples with different number of layers (one to five) with low and high face velocity and, for one and two layers, with different face velocities (2.8, 5.3, 9.1, 12.9, 25.4 cm s−1). These materials were selected because they showed sufficiently low FE and Δp for a single layer that also allows reasonable measurements at samples of five layers. In addition, they covered both, woven and non-woven materials, and several of them are of general relevance for self-made face masks.
As expected, with increasing face velocity, we observed an increase in pressure drop across the sample (). This reflects that it is harder to breathe through the material of the face mask when the respiratory flow is larger. As the measured pressure drop values for single layered samples were consistently half the values of the double layered samples, we only present results for the latter ones, which have smaller relative uncertainty due to higher Δp levels. A power law function
(1)
(1)
was fitted, with Δp(vf) the pressure drop in Pascal at face velocity vf (in cm s−1), AΔp (in Pa) the magnitude of the pressure drop increase with increasing vf, and s the exponent describing the shape of the increase (see SI Table S2 for the individual fitting coefficients). For cotton jersey, the pressure drop curve flattens (s = 0.80) probably due to widening of the stitch openings at higher flow rates. For the other materials, s is above unity.
Figure 4. Dependence of (a) pressure drop and (b–d) filtration efficiencies at different particle sizes (30 nm, 500 nm, both neutralized aerosol, CPC setup; 2.5 µm, ambient aerosol, SMPS/OPC setup) on face velocity for polyester, cotton woven, cotton jersey, and molleton (2 layers each). For the fitting coefficients, see Tables S2–S4 (supplementary information).
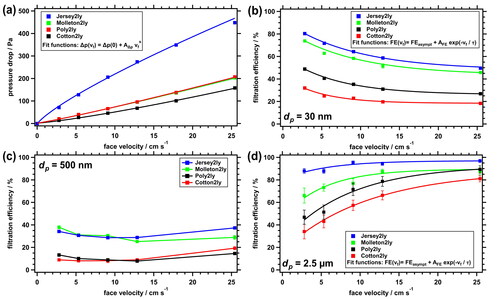
For small particles (dp ≤ 250 nm), FE decreases with increasing face velocity ( for dp = 30 nm), reflecting reduced particle deposition by diffusion and electrostatic attraction, due to reduced residence times within the filter material. Conversely, for large particles (dp ≥ 2.5 µm) FE increases with increasing face velocity ( for dp = 2.5 µm), due to enhanced impaction deposition at larger particle velocities. For both particle size ranges, FE dependence on face velocity vf follows an exponential function reasonably well:
(2)
(2)
with FEasympt the asymptotic filtration efficiency (in %) for very large vf (given in cm s−1), AFE (in %) the magnitude and τ (in cm s−1) the vf sensitivity of the filtration efficiency dependence. For the smaller particles (dp ≤ 250 nm, SI Table S3), AFE is positive and FE decreases with increasing vf, approaching the asymptotic filtration efficiency. Generally, in this particle size range, FEasympt decreases with increasing particle size (range: 20%–50% for dp=30 nm opposed to 7%–22% for dp = 250 nm). For the larger particles (dp ≥ 2.5 µm, SI Table S4), AFE is negative and FE increases with increasing face velocity. For almost all samples, FEasympt approaches 100%, especially for the larger particles (i.e., dp = 5 µm and 10 µm). This suggests improved filtration efficiencies for such particles under conditions where large face velocities occur, such as during coughing, sneezing, or heavy breathing, for the fraction of the air flow that passes through the mask material.
For an intermediate particle size range ( for dp = 500 nm), a transition occurs from decreasing FE with increasing face velocity in the lower vf range to an increase in FE with face velocity in the upper vf range. With increasing particle diameter, we observe a decrease in the face velocity where this transition occurs, in agreement with classical filtration theory (Hinds Citation1999).
Pressure drop dependences on the number of layers of sample material show a tight linear relationship ( for vf = 5.3 cm s−1; see SI Table S5 for fitting coefficients). For zero layers one would expect Δp = 0 Pa. This was observed for cotton woven and molleton. For polyester and cotton jersey, however, a significant, albeit small, residual Δp was calculated equivalent of ¼ to 1/7 layer of the material. Generally, however, in good approximation the observed pressure drop across the complete sample is proportional to the number of layers of the material.
Figure 5. Dependence of (a) pressure drop and (b) transmission efficiency for 1 µm particles on number of layers of the respective material (polyester, cotton woven, cotton jersey, and molleton), measured at low face velocity in ambient aerosol (SMPS/OPC setup). Fit coefficients can be found in Tables S5a and S6b (supplementary information).
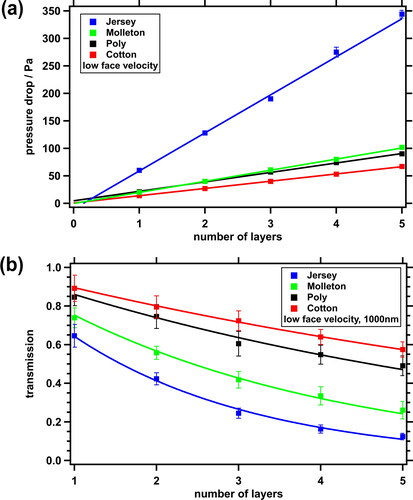
Filtration efficiency increases with the number of sample material layers. To test whether this dependence is in agreement with classical filtration theory (Hinds Citation1999), we used particle transmission (T = 1 – FE[%]/100). Particle transmission T dependence on number of layers n for all four material samples (see for dp = 1 µm and vf = 5.3 cm s−1) can reasonably well be fitted according to the following simple relationship:
(3)
(3)
with T(1) the transmission for a single layer of material. A comparison of measured and fitted values for the single-layered material is provided in Table S6 (SI) for all four materials, all measured particle sizes as well as the lower and the higher face velocity.
We conclude that in good approximation the individual layers can be treated as separate filters which are connected in series and which do not interfere with each other strongly, e.g., due to alignment of layers. Therefore, the total pressure drop across the whole sample can be calculated by adding the pressure drops of the individual layers (EquationEquation (4)(4)
(4) ), and the total transmission efficiency can be calculated by multiplying the transmission efficiencies of the individual layers (EquationEquation (5)
(5)
(5) ). This enables to calculate total pressure drop Δptotal and total filtration efficiency FEtotal for cloth masks made of an arbitrary combination of layers Li of textiles from the features of the individual components:
(4)
(4)
(5)
(5)
This approach supersedes performing laborious measurements of filtration efficiency for combinations of materials in order to determine their suitability as basis for self-made face masks.
4.3. Which materials make a good filter – filter quality factor
As discussed above (Section 4.1), the selected sample materials showed not only a large variety of measured filtration efficiencies, but also of pressure drops. While some of the samples were already hard to breathe through, others showed such small pressure drops that for a face mask several layers of this material could well be used to increase the overall filtration efficiency. The dependency of pressure drop and filtration efficiency on number of material layers (Section 4.2) allows a more comprehensive comparison of the capabilities of potential filter materials using the filter quality factor qf (Hinds Citation1999; Huang et al. Citation2013):
(6)
(6)
where T is the fractional transmission and Δp (in Pa) the pressure drop. Filter quality factors for the lower face velocity (vf = 5.3 cm s−1) are summarized for small (dp = 30 nm–250 nm) and large (dp = 500 nm–10 µm) particles separately in ; those for the larger face velocity (vf = 12.9 cm s−1) are shown in the SI in Figure S23a.
Figure 6. a) Filter quality factor qf determined for small (dp=30 nm to 250 nm) and large (dp=500 nm to 10 µm) particles in ambient aerosol (SMPS/OPC setup) at low face velocity. Values are sorted according to qf averaged over all particle sizes. (b) Calculated filtration efficiency for small and large particles (ambient aerosol, SMPS/OPC setup, low face velocity, sorted as in (a)) for “reference pressure drop” cloth stacks. Above the bars the number of layers of this material is given which is needed to reach the reference pressure drop.
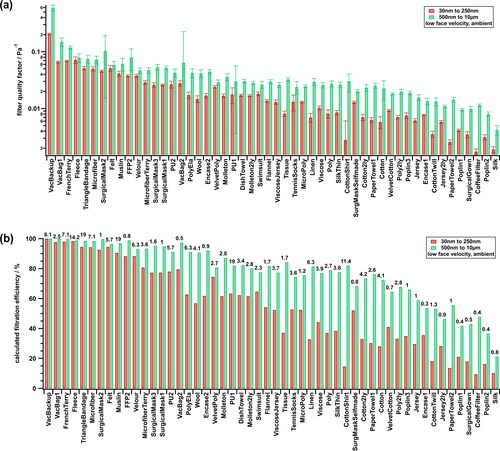
Combining FE and Δp does not make the samples more similar: variability of filter quality factors is not smaller than that of FE. However, the order in which the various samples appear within the quality factor chart (reflecting the relative quality compared to other samples) has changed considerably compared to that of FE (). Especially several materials with very low pressure drop have moved towards the left end (“better” filtration characteristics) of the chart and replaced others with high FE, but also high Δp. As a consequence, in this chart also a number of regular household materials and fluffy textiles like French terry, fleece, microfiber cloth, felt, muslin, or velour moved to the front end of the ranking, while several rather firm materials like poplin, surgical gown, or silk, but also one of the paper towel samples and the coffee filter moved towards the right end of the chart (i.e., “worse” filtration characteristics).
Filter quality factor is a rather abstract quantity. To present a more practical number which allows direct comparison of potential cloth mask materials, we use EquationEquations (4)(4)
(4) and Equation(5)
(5)
(5) to calculate the hypothetical FE for each sample material for a cloth stack which would have the same pressure drop as surgical mask #1 as (arbitrarily selected) reference. In , we present these calculated filtration efficiencies for the smaller face velocity together with the hypothetical number of layers applied (SI Figure S23b for the larger vf).
Filtration efficiencies for these hypothetical “reference pressure drop” masks reach high values for many sample materials, especially for the large particle size range, where about two thirds of all masks would have filtration efficiencies >80%. Depending on Δp at the individual layer, this would involve masks with often 4–7 layers and in some cases around 20 layers of material. Especially for materials with extremely low pressure drop at the single layer and very large thickness of the layer, this would result in very thick masks; e.g., the PU foam “reference pressure drop” mask would have 19 layers with a total thickness of more than 10 cm, which is quite impractical. Nevertheless, this comparison shows that using multiple layers of fabric would enable to produce cloth masks from many materials with reasonable filtration efficiency.
4.4. Influence of material density on filtration efficiency
For individual pairs of materials we find larger filtration efficiency for the material with larger thread count than for the material with the smaller one, similar to the findings of Konda et al. (Citation2020); however, this is not a general feature. When correlating FE with thread count (SI Figure S25), we do not find a general relationship between these two variables, even when limiting the correlation to only a sub-group of materials (e.g., only cotton materials). This is probably because larger thread count is typically also related to thinner threads, which in turn reduces material thickness with negative impact on FE. Also when correlating filter quality factor with thread count (SI Figure S27), we do not find a strong dependency between these two variables, if at all a slight decrease in qf with increasing thread count.
Filtration efficiency plotted versus material area density is presented in Figures S24a and b (SI) for small and large particles, respectively. For small particles, no general trend was found for all samples. However, restricting the correlation to regular textiles, we find a general trend of increasing FE with increasing material area density. This increase is probably associated with increasing material thickness along these lines, associated with longer particle residence time within the filter material. For the large particles or for qf (SI Figure S26), however, we do not find such a relationship.
4.5. Deposition by electrostatic attraction
Dedicated filtration materials as those used in respirators, surgical masks, or vacuum cleaner bags typically consist of non-woven fibers (Shimasaki et al. Citation2018) which carry permanent electrostatic charges to improve deposition of very small particles (Huang et al. Citation2013). To investigate the contribution of electrostatic attraction to overall particle removal, which likely caused enhanced FE for small, charged particles ( and Section 4.1), we use the measured filtration efficiency for the charged aerosol FEmeas,charged and of the neutralized aerosol FEmeas,neutr. With the fraction of charged particles Xch(dp) in charge equilibrium for the respective particle size dp (Wiedensohler Citation1988) we calculate the filtration efficiency due to diffusion FEdiff and that due to electrostatic attraction (FEES) according to:
(7)
(7)
(8)
(8)
As a measure of the contribution of electrostatic attraction to overall FE, we calculate the ratio of FEES to FEdiff for each sample material, averaged for dp = 30 nm–100 nm, where we expect and observe enhanced FE for the charged aerosol. In , the electrostatic attraction-to-diffusion contribution ratio is presented for all samples, obtained at the lower face velocity (vf = 5.3 cm s−1; measurements at the higher face velocity show a similar trend, however, are affected by stronger noise), sorted along decreasing FEES/FEdiff ratios.
Figure 7. Ratio of filtration efficiencies due to electrostatic attraction (FEES) to filtration efficiencies due to diffusion (FEdiff) obtained at low face velocity for dp ≤ 100 nm with the CPC setup, sorted for decreasing ratios.
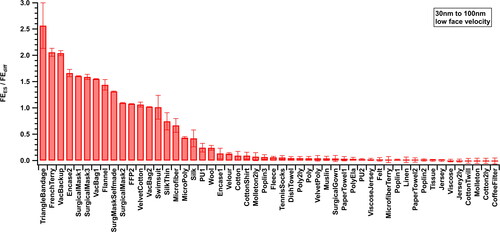
For fourteen of the samples, mainly materials designed for filtration of particles like medical masks or vacuum cleaner bags, but also for triangle bandage, swimsuit material, French terry, flannel or velvet cotton, the contribution of electrostatic attraction to overall deposition is at least as large as the contribution by diffusion. Several other materials, mostly synthetic ones, also show significant electrostatic deposition, although at a lower level. Velvet cotton, silk, and wool are some of the few non-synthetic materials for which we could identify substantial electrostatic contribution to overall deposition. Likely, electrostatic charge in these samples is not permanent but generated during handling of the material. For most samples consisting of natural fibers, we found only very small or negligible contributions to small-particle deposition by electrostatic attraction.
4.6. How strongly do leaks affect filtration efficiency?
Surgical masks as well as cloth masks never have a perfect fit on the face. Leaks between the mask material and the skin allow air to pass through without being filtered by the mask material. This is one of the main reasons why in studies investigating filter efficiencies of masks under real life conditions for surgical masks significantly lower filtration rates have been found compared to, e.g., N95 (similar to FFP2 or KN95) respirators (Grinshpun et al. Citation2009; Chu et al. Citation2020).
To obtain an estimate on the influence of leaks on overall filtration efficiency of the mask material we performed dedicated measurements with two sample materials with defined leaks. These materials, a surgical mask (surgical mask #4, not investigated in the previous sections) and the velvet cotton sample, were selected due to their relatively high filtration efficiency and good mechanical stability (to avoid unraveling of the leaks during the measurements) but with different pressure drops. Four samples were probed at vf = 5.3 cm s−1: a completely intact sample, and samples with 0.5%, 1%, and 2% of the sample area being punched out, in each case distributed over three holes across the sample. In addition, we measured FE of the “leaking” samples using a flow rate that generated the same pressure drop at the sample as the one observed for the measurement at vf = 5.3 cm s−1 for the leak-free sample. Under these conditions, we assume that the face velocity through the filter material is the same in both cases and that the additional flow through the leaking sample passes through the holes.
Filtration efficiencies, normalized to those measured at the leak-free sample, plotted versus the relative leak area () directly provide the relative reduction of the filtration efficiency due to the leaks. For particles with dp ≤ 2.5 µm (solid lines in ) FE decreases by 50% for a leak of 1% of the sample area and by about two thirds for a 2%-leak. The decrease is slightly higher for the velvet cotton sample (red traces), compared to the surgical mask sample (blue traces). This is because Δp at the velvet cotton sample is larger than at the surgical mask and consequently a larger fraction of the total flow passes through the holes instead of the sample material. For 10 µm particles (dashed lines in ) the observed decrease in filtration efficiency is smaller compared to that for smaller particles. This suggests that the larger particles do not follow the flow streamlines into the holes as well as the smaller particles do, and more of them have to pass through the filter material. Estimates of the “separation efficiency” of the leaks (see Section S3 and Figure S28 in the SI) suggest that this is the case for particles with dp ≥ 5 µm, with increasing efficiency as particle size increases.
Figure 8. Filtration efficiency for velvet cotton (red) and surgical mask (blue) samples for dp ≤ 2.5 µm (solid line) and dp = 10 µm (dashed line) versus relative leak area, normalized to the leak-free sample. Here, measurements of neutralized (CPC setup) and ambient aerosol (SMPS/OPC setup) were averaged, where available.
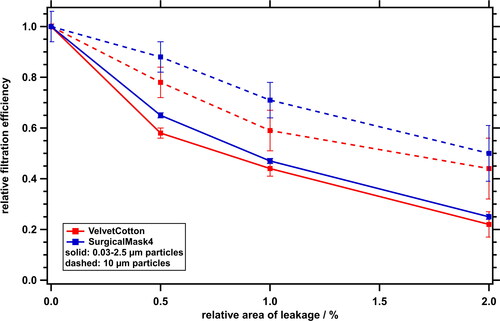
These measurements cannot be much more than a qualitative description of the effects of leaks on the overall filtration efficiency of face masks. The fractional flow through a leak and the leak separation efficiency depend not only on the relative leak area and pressure drop of the mask material, but also on other variables like shape and position of the leaks. Nevertheless, these measurements showed that already very small leaks in the order of one percent of the total sample area can substantially reduce the overall filtration efficiency of a mask down to half or even less compared with the value of the material itself. Therefore, it is critical that the leak area is kept at a minimum. However, impaction of large particles on the mask surface will reduce the leak-related transmission of the largest droplets, e.g., from speaking, coughing, or sneezing, at least to a certain degree. The relatively large droplet velocities of several meters per second (Chao et al. Citation2009) occurring in such processes will further support impaction losses within the leaking mask. To obtain more quantitative results on the influence of leaks, more dedicated and detailed experiments need to be performed.
5. Discussion
Several studies found in the literature focusing on efficacy or filtration performance of cloth face masks come to very different conclusions. Several authors observe that some of the cloth masks filter fine or ultrafine particles with similar or even better efficiency, compared to KN95 or N95 (both similar to FFP2) masks (Lustig et al. Citation2020; Konda et al. Citation2020). Contrary, others find that cloth masks provide only very low or at least significantly lower filtration efficiency compared to N95 or surgical masks (Shakya et al. Citation2017; Rengasamy, Eimer, and Shaffer Citation2010; Bae et al. Citation2020; Davies et al. Citation2013).
Cloth mask filtration efficiencies larger than those found for N95 masks are not in agreement with our results, at least not for numbers of fabric layers as typically used in masks. We suspect that large filtration efficiencies for “virus-like nanoparticles” which were reported by Lustig et al. (Citation2020) are mainly caused by the fact that these nanoparticles were applied to the filtration media suspended in droplets with typical sizes of 10–20 µm. Therefore, filtration efficiency was not measured for nanoparticles but for relatively large droplets. Also results by Konda et al. (Citation2020), who found better filtration efficiencies for combinations of cotton with silk, chiffon, and flannel than for a N95 mask over a large particle size range are hard to understand. According to filtration theory and to our measurements filtration efficiency for very small particles should increase as particle size decreases, whereas Konda et al. (Citation2020) reported the opposite behavior for dp < 80 nm for the N95 mask. Their results for several other cloth materials, however, are in good agreement with our findings, including the observation that multiple layers of cloth material result in significantly enhanced filtration efficiencies.
Rengasamy, Eimer, and Shaffer (Citation2010) found filtration efficiencies for various cloth masks and materials in the order of 10%–60% for polydisperse aerosols (dp = 20 nm–1000 nm), which agrees well with our findings. Shakya et al. (Citation2017) observed filtration efficiencies between 40% and 80% with a filtration minimum around dp = 500 nm for several cloth masks using monodisperse particles (dp = 30 nm–2.5 µm), similar to our results. These authors, as well as Davies et al. (Citation2013), found significantly larger filtration efficiency for surgical masks, compared to homemade masks, also in good agreement with our findings.
We found considerable differences in filtration efficiency for particles of different sizes but also between the individual samples. In addition, we observed large differences in pressure drop across the sample. For many materials, this allows stacking of several layers without reaching excessive pressure drop levels, with significantly improved filtration capability of the resulting cloth stack. Calculated filtration efficiencies for textile stacks with the same pressure drop as observed for a surgical mask reached very high values for large particles, i.e., dp ≥ 500 nm, and still decent levels for the smaller particles for many sample materials, mainly for those which were designed to filter particles and for fluffy textiles like, e.g., French terry, fleece, felt, or velour.
Measurements with defined leaks in the samples revealed that leaks of only a few percent of the mask area will substantially degrade the overall mask filtration efficiency. Leaks next to the nose can be minimized using nose clips. However, leaks at the remaining circumference of the mask strongly depend on the shape of the mask. Cup-shaped or fold-up masks have the potential to fit better onto the face with less leak area than pleated masks like surgical masks, however for this purpose they need to have the right size.
The measurements of this study provide information on filtration efficiency and pressure drop at various face masks and potential mask materials under the conditions of the measurements. We did not apply a breathing cycle with up- and down-swelling flow rate. This would likely influence the absolute values of filtration efficiencies; however, we do not expect that this will strongly affect the intercomparison between different sample materials. We also did not humidify the air flow. Large relative humidity of the flow through the mask materials will likely cause a wetting of the material. This could alter the transmission of particles through the material, e.g., as a consequence of swelling of fibers when they get wet. We also did not investigate the effects of cleaning (e.g., washing) the sample materials on both, filtration efficiency and pressure drop. Neupane et al. (Citation2019) have shown that filtration efficiency of cloth masks dropped by 20% after the fourth washing and drying cycle as a consequence of changed pore size and shape. Since homemade masks typically are washed and re-used many times, this effect as well as the influence of humidity should be more thoroughly studied in future experiments. Extreme flow situations, like coughing or sneezing which produce jets of particles moving at high velocities (Chao et al. Citation2009; Han, Weng, and Huang Citation2013; Liu and Novoselac Citation2014), have also not been studied here. We hypothesize that under such conditions, leaks of the masks will open further, reducing the overall filtration efficiency – at least for the smaller particles which do not impact on the inner surface of the mask.
6. Summary
Filtration efficiencies (FE) of face masks and potential mask materials were determined for particles ranging from dp = 30 nm–10 µm. For this purpose, size-resolved particle number concentrations upstream and downstream the sample material were determined in two different setups while it was passed by the aerosol-laden air. In addition, the pressure drop (Δp) across the samples was measured and the dependency of FE on face velocity, particle charge and number of sample layers was investigated.
A total of 48 different sample materials were tested. This included three regular surgical masks and an FFP2 respirator for comparison, several pure cotton and cotton mixed with synthetics textiles, synthetic cloths, but also a large variety of other materials which can be found in a regular household like PU foams, triangle bandage, paper towels, or a coffee filter.
Generally, a large variety of filtration efficiencies was found and a filtration minimum was observed for particles between 50 nm and 500 nm diameter with typically larger filtration efficiency found for large particles (dp > 2.5 µm), compared to small ones (dp < 100 nm). With increasing face velocity, we found a decrease in FE for small particles (dp ≤ 250 nm) and an increase in FE for large particles (dp ≥ 2.5 µm) due to the different loss mechanisms involved.
Filtration efficiency and pressure drop measured for different numbers of material layers showed that each layer can be treated as individual filter. Total FE of the whole stack can readily be estimated by multiplying the individual transmission efficiencies (T = 1-FE), while total pressure drop (Δp) is the sum of the individual pressure drops. This allows the use of the filter quality factor, which considers both, FE and Δp for comparison of stacked cloth materials. Calculations for hypothetical cloth stacks with similar pressure drop as observed for a surgical mask revealed that by stacking adequate numbers of layers of the various sample materials it is possible to obtain decent filtration efficiency using cloth materials.
From measurements of completely charged aerosols and aerosols in charge equilibrium we estimated the contribution of electrostatic attraction to overall deposition for the individual sample materials for small particles (dp ≤ 100 nm). Fourteen of the sample materials, mainly synthetic materials but also one cotton and two cotton mixed with synthetic samples, showed an electrostatic deposition contribution which was at least as large as deposition by diffusion.
Measurements using samples with defined leaks covering 0.5%–2% of the sample area showed substantial reduction in total filtration efficiency by 50% to two thirds of the value obtained with the leak-free sample. Particles of dp ≥ 5 µm tend not to follow the leak flow completely and are deposited on the samples to a certain degree.
Our measurements show that face masks made of cloth materials can reach decent filtration efficiency over a large particle size range, when stacked to an adequate number of layers, especially if materials designed to filter aerosol particles or fluffy textiles like, e.g., French terry, fleece, felt, or velour are used. Total filtration efficiency and pressure drop can be estimated readily from the respective values for the individual layers, leaving labor-intensive measurements of textile combinations unnecessary. Besides these features, selection of cloths for homemade face masks must always consider that no harmful substances are released by the material, which was not part of this study. This might exclude some chemically treated household materials for this usage, like vacuum cleaner bags with antibacterial treatment. However, even the best filtration efficiency is easily degraded if the mask does not have a good fit and a significant fraction of the respiratory air is permitted to pass through leaks between mask and face.
Supplemental Material
Download MS Word (8.3 MB)Acknowledgments
We thank T. Böttger, S. Best, F. Kunz, B. Meckel, and H. Musshoff for technical support and O. Appel, O. Eppers, F. Köllner, C. Schulz, and J. Schneider (all at MPIC) for measurement support. Numerous colleagues and readers of our press release about first results contributed fruitful discussions and suggested additional sample materials.
Additional information
Funding
References
- Asadi, S., A. S. Wexler, C. D. Cappa, S. Barreda, N. M. Bouvier, and W. D. Ristenpart. 2019. Aerosol emission and superemission during human speech increase with voice loudness. Sci. Rep. 9 (1):2348. doi:https://doi.org/10.1038/s41598-019-38808-z.
- Bae, S., M. C. Kim, J. Y. Kim, H. H. Cha, J. S. Lim, J. Jung, M. J. Kim, D. K. Oh, M. K. Lee, S. H. Choi, et al. 2020. Effectiveness of surgical and cotton masks in blocking SARS-CoV-2: A controlled comparison in 4 patients. Ann. Intern. Med. 173 (1):W22–W23. doi:https://doi.org/10.7326/M20-1342.
- Bake, B., P. Larsson, G. Ljungkvist, E. Ljungström, and A.-C. Olin. 2019. Exhaled particles and small airways. Respir. Res. 20 (1):8. doi:https://doi.org/10.1186/s12931-019-0970-9.
- Chao, C. Y. H., M. P. Wan, L. Morawska, G. R. Johnson, Z. D. Ristovski, M. Hargreaves, K. Mengersen, S. Corbett, Y. Li, X. Xie, et al. 2009. Characterization of expiration air jets and droplet size distributions immediately at the mouth opening. J. Aerosol Sci. 40 (2):122–33. doi:https://doi.org/10.1016/j.jaerosci.2008.10.003.
- Chaudhuri, S., S. Basu, P. Kabi, V. R. Unni, and A. Saha. 2020. Modeling the role of respiratory droplets in Covid-19 type pandemics. Phys. Fluids. 32 (6):063309. doi:https://doi.org/10.1063/5.0015984.
- Chu, D. K., E. A. Akl, S. Duda, K. Solo, S. Yaacoub, H. J. Schünemann, D. K. Chu, E. A. Akl, A. El-Harakeh, A. Bognanni, et al. 2020. Physical distancing, face masks, and eye protection to prevent person-to-person transmission of SARS-CoV-2 and COVID-19: a systematic review and meta-analysis. Lancet 395 (10242):1973–87. doi:https://doi.org/10.1016/S0140-6736(20)31142-9.
- Davies, A., K.-A. Thompson, K. Giri, G. Kafatos, J. Walker, and A. Bennett. 2013. Testing the efficacy of homemade masks: Would they protect in an influenza pandemic?. Disaster Med. Public Health Prep. 7 (4):413–8. doi:https://doi.org/10.1017/dmp.2013.43.
- EN14683. 2019. Medical face masks – Requirements and test methods. German version EN 14683:2019 + AC:2019. DIN Deutsches Institut für Normung e.V. Berlin: Beuth Verlag GmbH.
- Gralton, J., E. Tovey, M.-L. McLaws, and W. D. Rawlinson. 2011. The role of particle size in aerosolised pathogen transmission: A review. J. Infect. 62 (1):1–13. doi:https://doi.org/10.1016/j.jinf.2010.11.010.
- Grinshpun, S. A., H. Haruta, R. M. Eninger, T. Reponen, R. T. McKay, and S.-A. Lee. 2009. Performance of an N95 filtering facepiece particulate respirator and a surgical mask during human breathing: Two pathways for particle penetration. J Occup. Environ. Hyg. 6 (10):593–603. doi:https://doi.org/10.1080/15459620903120086.
- Hadei, M., P. K. Hopke, A. Jonidi, and A. Shahsavani. 2020. A letter about the airborne transmission of SARS-CoV-2 based on the current evidence. Aerosol Air Qual. Res. 20 (5):911–4. doi:https://doi.org/10.4209/aaqr.2020.04.0158.
- Han, Z. Y., W. G. Weng, and Q. Y. Huang. 2013. Characterizations of particle size distribution of the droplets exhaled by sneeze. J. R. Soc. Interface 10 (88):20130560. doi:https://doi.org/10.1098/rsif.2013.0560.
- Hinds, W. C. 1999. Aerosol technology – Properties, behavior, and measurement of airborne particles. 2nd ed. New York: Wiley Interscience, John Wiley & Sons.
- Huang, S. H., C. W. Chen, Y. M. Kuo, C. Y. Lai, R. McKay, and C. C. Chen. 2013. Factors affecting penetration and quality factor of particulate respirators. Aerosol Air Qual. Res. 13 (1):162–71. doi:https://doi.org/10.4209/aaqr.2012.07.0179.
- Jacobson, M. Z. 2012. Air pollution and global warming: History, science, and solutions. New York: Cambridge University Press.
- Johnson, G. R., L. Morawska, Z. D. Ristovski, M. Hargreaves, K. Mengersen, C. Y. H. Chao, M. P. Wan, Y. Li, X. Xie, D. Katoshevski, et al. 2011. Modality of human expired aerosol size distributions. J. Aerosol Sci. 42 (12):839–51. doi:https://doi.org/10.1016/j.jaerosci.2011.07.009.
- Klompas, M., M. A. Baker, and C. Rhee. 2020. Airborne transmission of SARS-CoV-2: Theoretical considerations and available evidence. J. Am. Med. Assoc. 324 (5):441–442. doi:https://doi.org/10.1001/jama.2020.12458.
- Konda, A., A. Prakash, G. A. Moss, M. Schmoldt, G. D. Grant, and S. Guha. 2020. Aerosol filtration efficiency of common fabrics used in respiratory cloth masks. ACS Nano 14 (5):6339–47. doi:https://doi.org/10.1021/acsnano.0c03252.
- Kutter, J. S., M. I. Spronken, P. L. Fraaij, R. A. M. Fouchier, and S. Herfst. 2018. Transmission routes of respiratory viruses among humans. Curr. Opin. Virol. 28:142–51. doi:https://doi.org/10.1016/j.coviro.2018.01.001.
- Lee, S.-A., S. A. Grinshpun, and T. Reponen. 2008. Respiratory performance offered by N95 respirators and surgical masks: Human subject evaluation with NaCl aerosol representing bacterial and viral particle size range. Ann. Occup. Hyg. 52 (3):177–85. doi:https://doi.org/10.1093/annhyg/men005.
- Leopoldina – German National Academy of Sciences. 2020. Coronavirus pandemic – Measures relevant to health. 2nd Ad-hoc-Statement. Halle, Germany: German National Academy of Sciences Leopoldina. Accessed July 27, 2020 https://www.leopoldina.org/en/publications/detailview/publication/coronavirus-pandemie-gesundheitsrelevante-massnahmen-3-april-2020/.
- Li, Y., H. Qian, J. Hang, X. Chen, L. Hong, P. Liang, J. Li, S. Xiao, J. Wei, L. Liu, et al. 2020. Evidence for probable aerosol transmission of SARS-CoV-2 in a poorly ventilated restaurant. MedRxiv. doi:https://doi.org/10.1101/2020.04.16.20067728. Forthcoming.
- Liu, S., and A. Novoselac. 2014. Transport of airborne particles from an unobstructed cough jet. Aerosol Sci. Technol. 48 (11):1183–94. doi:https://doi.org/10.1080/02786826.2014.968655.
- Lustig, S. R., J. J. H. Biswakarma, D. Rana, S. H. Tilford, W. Hu, M. Su, and M. S. Rosenblatt. 2020. Effectiveness of common fabrics to block aqueous aerosols of virus-like nanoparticles. ACS Nano 14 (6):7651–8. doi:https://doi.org/10.1021/acsnano.0c03972.
- Morawska, L., G. R. Johnson, Z. D. Ristovski, M. Hargreaves, K. Mengersen, S. Corbett, C. Y. H. Chao, Y. Li, and D. Katoshevski. 2009. Size distribution and sites of origin of droplets expelled from the human respiratory tract during expiratory activities. J. Aerosol Sci. 40 (3):256–69. doi:https://doi.org/10.1016/j.jaerosci.2008.11.002.
- Morawska, L., and D. K. Milton. 2020. It is time to address airborne transmission of COVID-19. Clin. Infect. Dis. doi:https://doi.org/10.1093/cid/ciaa939. Forthcoming.
- Neupane, B. B., S. Mainali, A. Sharma, and B. Giri. 2019. Optical microscopic study of surface morphology and filtering efficiency of face masks. PeerJ 7:e7142. doi:https://doi.org/10.7717/peerj.7142.
- Oberdörster, G., E. Oberdörster, and J. Oberdörster. 2005. Nanotoxicology: An emerging discipline evolving from studies of ultrafine particles. Environ. Health Perspect. 113 (7):823–39. doi:https://doi.org/10.1289/ehp.7339.
- Oberg, T., and L. M. Brosseau. 2008. Surgical mask filter and fit performance. Am. J. Infect. Control 36 (4):276–82. doi:https://doi.org/10.1016/j.ajic.2007.07.008.
- Parienta, D., L. Morawska, G. R. Johnson, Z. D. Ristovski, M. Hargreaves, K. Mengersen, S. Corbett, C. Y. H. Chao, Y. Li, and D. Katoshevski. 2011. Theoretical analysis of the motion and evaporation of exhaled respiratory droplets of mixed composition. J. Aerosol Sci. 42 (1):1–10. doi:https://doi.org/10.1016/j.jaerosci.2010.10.005.
- Rengasamy, S., B. Eimer, and R. E. Shaffer. 2010. Simple respiratory protection – Evaluation of the filtration performance of cloth masks and common fabric materials against 20-1000 nm size particles. Ann. Occup. Hyg. 54 (7):789–98. doi:https://doi.org/10.1093/annhyg/meq044.
- Shakya, K. M., A. Noyes, R. Kallin, and R. E. Peltier. 2017. Evaluating the efficacy of cloth facemasks in reducing particulate matter exposure. J. Expo. Sci. Environ. Epidemiol. 27 (3):352–7. doi:https://doi.org/10.1038/jes.2016.42.
- Shimasaki, N., A. Okaue, R. Kikuno, and K. Shinohara. 2018. Comparison of the filter efficiency of medical nonwoven fabrics against three different microbe aerosols. Biocontrol Sci. 23 (2):61–9. doi:https://doi.org/10.4265/bio.23.61.
- van Doremalen, N., T. Bushmaker, D. H. Morris, M. G. Holbrook, A. Gamble, B. N. Williamson, A. Tamin, J. L. Harcourt, N. J. Thornburg, S. I. Gerber, et al. 2020. Aerosol and surface stability of SARS-CoV-2 as compared with SARS-CoV-1. N. Engl. J. Med 382 (16):1564–7. doi:https://doi.org/10.1056/NEJMc2004973.
- WHO (World Health Organization). 2014. Infection prevention and control of epidemic- and pandemic-prone acute respiratory infections in health care. Geneva, Switzerland: World Health Organization. Accessed July 03, 2020. https://www.who.int/csr/bioriskreduction/infection_control/publication/en/.
- WHO (World Health Organization). 2016. Ambient air pollution: a global assessment of exposure and burden of disease. Geneva, Switzerland: World Health Organization. Accessed July 03, 2020. https://www.who.int/phe/publications/air-pollution-global-assessment/en/.
- WHO (World Health Organization). 2020a. Country & technical guidance – Coronavirus disease (COVID-19). Geneva, Switzerland: World Health Organization. Accessed July 03, 2020. https://www.who.int/emergencies/diseases/novel-coronavirus-2019/technical-guidance-publications.
- WHO (World Health Organization). 2020b. Advice on the use of masks in the context of COVID-19. Interim guidance. Geneva, Switzerland: World Health Organization. Accessed July 03, 2020. https://www.who.int/publications/i/item/advice-on-the-use-of-masks-in-the-community-during-home-care-and-in-healthcare-settings-in-the-context-of-the-novel-coronavirus-(2019-ncov)-outbreak.
- WHO (World Health Organization). 2020c. Coronavirus disease 2019 (COVID-19): Situation Report – 66, March 26, 2020. Geneva, Switzerland: World Health Organization. Accessed July 10, 2020. https://www.who.int/docs/default-source/coronaviruse/situation-reports/20200326-sitrep-66-covid-19.pdf.
- Wiedensohler, A. 1988. An approximation of the bipolar charge distribution for particles in the submicron size range. J. Aerosol Sci. 19 (3):387–9. doi:https://doi.org/10.1016/0021-8502(88)90278-9.
- Zhang, R., Y. Li, A. L. Zhang, Y. Wang, and M. J. Molina. 2020. Identifying airborne transmission as the dominant route for the spread of COVID-19. Proc. Natl. Acad. Sci. USA. 117 (26):14857–63. doi:https://doi.org/10.1073/pnas.2009637117.