
 ?Mathematical formulae have been encoded as MathML and are displayed in this HTML version using MathJax in order to improve their display. Uncheck the box to turn MathJax off. This feature requires Javascript. Click on a formula to zoom.
Abstract
Fibrous filters are effective for the removal of ultrafine particles and have been widely used. According to filtration theory, diffusion and interception are the main particle collection mechanisms for removing ultrafine particles, and these are greatly affected by fiber diameter. Particle collection efficiency by diffusion and interception increases as the fiber diameter decreases. Most of the previous studies conducted by researchers have focused on the effect of fiber diameter on filtration performance; however, they used filter media with different physical properties. Therefore, it is important to clearly understand the influence of fiber diameter alone on filtration performance in filters with the same physical properties (e.g., packing density, filter thickness, and fiber weight per unit area). In this study, PVA nanofiber filters with different fiber diameters (100, 201, and 306 nm) were prepared with other physical properties the same, using electrospinning. In addition, the effect of fiber diameter on filtration performance was examined by experimental and theoretical investigation. Filtration performance as determined by pressure drop and particle collection efficiency, increased with decreasing fiber diameter, as expected according to filtration theory. Furthermore, the filter quality factor (representing filtration performance), increased with decreasing fiber diameter.
Copyright © 2020 American Association for Aerosol Research
EDITOR:
1. Introduction
Ultrafine airborne particulate matter causes heart and lung disease and is harmful to human health when the body is exposed to it and penetration occurs (Wang, Chen, and Pui Citation2007; Leung and Chau Citation2019; Tien et al. Citation2020). Therefore, it is important to control and remove those ultrafine particles to protect human health. Typical methods widely used to remove ultrafine particles include electrostatic precipitators and collection by filtration (Feng, Long, and Mo Citation2016; Feng et al. Citation2018). Among these control methods, the use of a fibrous filter is very effective when compared with other methods (Thomas et al. Citation2019).
Fibrous filters have been used in filtration systems for decades because of their high dust collection efficiency despite their high pressure drop (Lee and Liu Citation1982; Thomas et al. Citation2001; Hung and Leung Citation2011; Tien et al. Citation2020). Filters composed of nanofibers have higher filtration performance than conventional commercial fibrous filters (Wang, Kim, and Pui Citation2008). Furthermore, they have a very large specific surface area and can effectively capture nanoparticles with a dominant effect on diffusion and interception (Podgorski, Balazy, and Grado Citation2006). However, unlike particle collection efficiency, a large pressure drop occurs with nanofiber filtration because the pressure drop is inversely proportional to the square of the fiber diameter (Davies Citation1953; Jackiewicz and Werner Citation2015; Chang et al. Citation2019; Kim et al. Citation2019).
According to filtration theory, fibers capture particulate matter by mechanical collection mechanisms such as diffusion, interception, inertia, and gravity settling. Diffusion and interception are predominant collection mechanisms, whereas inertia and gravity settling are negligible for ultrafine particles. In particular, the fiber diameter affects the Peclet number (Pe = udf/D) and interception parameters (R = dp/df), which determine the particle collection efficiency of diffusion and interception. As the fiber diameter decreases, diffusion and interception increase with decrease in the Peclet number and with increase in the interception parameter (Hinds Citation1998; Kim et al. Citation2019). Therefore, the smaller the diameter of the fibers constituting the filter, the higher its mechanical collection efficiency. In addition, the filter quality factor (which indicates the filtration performance) increases with increasing particle collection efficiency and with decreasing fiber diameter (Huang et al. Citation2013; Matulevicius et al. 2016; Lee et al. Citation2020). Accordingly, it is important to fabricate a filter with fibers of small diameter. The electrospinning used to prepare the nanofibers constituting the filter has the advantage that it can be used to make nanofibers easily using various polymers, and the process is simple (Deitzel et al. Citation2001; Hajra, Mehta, and Chase Citation2003; Lee et al. Citation2004; Barhate, Loong, and Ramakrishna Citation2006; Choi et al. Citation2014). Furthermore, using this method, the process parameters can easily be used to control the fiber diameter and morphology, and to determine the weight and thickness of the filter. Many researchers have evaluated the filtration performance of fibrous filters produced by electrospinning. However, it was not possible to determine the effect of the fiber diameter alone on filtration performance, because the test filters had different filter thickness, basis weight, and packing density, all of which influence the filtration performance (Yun et al. Citation2007; Leung, Hung, and Yuen Citation2010; Zhang et al. Citation2010; Matulevicius et al. 2016). The fabrication parameters from the above-mentioned studies are summarized in .
Table 1. Summary of fabrication parameters in previous studies.
Theoretically, the single fiber collection efficiency of the filter is affected not only by the fiber diameter, but also by the packing density (Kirsch and Stechkina Citation1978; Lee and Liu Citation1982; Hinds Citation1998; Choi et al. Citation2014; Kim et al. Citation2019; Lee et al. Citation2020). Therefore, in terms of filtration performance, and in order to consider only the influence of fiber diameter, it is very important to prepare filters with different fiber diameters while have the same physical properties. However, until now, it has been too difficult to manufacture filters with those characteristics.
In this study, filters with the same physical properties but different fiber diameters were produced by controlling the process parameters (such as solution concentration, molecular weight, and an electric field) of an electrospinning process. Filtration performance as determined by pressure drop and particle collection efficiency was investigated to determine the effect of fiber diameter on filter quality factor. Then, the experimental results were compared with the theoretical ones.
2. Experimental method
2.1. Preparation of spinning solution used for electrospinning
PVA polymers (molecular weight, Mw = 31,000-50,000/85,000-124,000/146,000-186,000, 87-89% hydrolyzed, Sigma-Aldrich), and distilled water were used to prepare the spinning solution. Different molecular weights of PVA were dissolved by stirring for at least 3 h in distilled water at 80 °C to prepare spinning solutions with concentrations from 5 to 15 wt%. The prepared spinning solutions were used in the experiment after lowering the temperature of the solution to room temperature before using it for electrospinning. The viscosity of the spinning solution was measured using a viscometer (DV-II + PRO, Brookfield).
2.2. Operating parameters for electrospinning
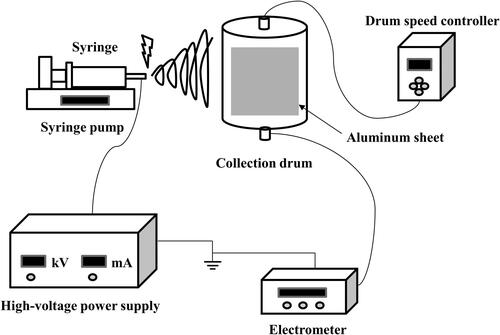
shows the experimental setup of electrospinning to fabricate PVA nanofibers using a spinning solution. The prepared PVA solution was ejected using a syringe through a nozzle coupled with an adapter. The ejected solution was electrospun due to the electric field created between a grounded collector drum and a nozzle to which high voltage was applied. The collector drum was covered with an aluminum sheet to collect the electrospun fibers. In addition, it rotated at a constant speed of 90 rpm while moving axially by a set value. The PVA nanofibers fabricated on the aluminum sheet were detached from the collector drum and placed in a desiccator for 24 h to dry. Afterward, a filter sample was prepared by sandwiching a nanofiber layer between the aluminum sheet and coarse polyester mesh, and then transferring the nanofiber layer to the coarse polyester mesh.
Figure 1. Schematic diagram of the electrospinning equipment.
Electrospun PVA nanofibers were fabricated using molecular weights in the range 31,000-186,000, with solution concentration of 5-15 wt%, applied voltage of 10-20 kV, feed rate of 1 mL/h, and tip-to-collector distance (TCD) of 10 cm. Spinning time was controlled according to the target value by measuring the weight of fibers collected per minute in the unit area. In addition, the filter thickness and fiber weight, which are physical properties of the filter, were applied differently to the calculated spinning time for each condition, even if the fiber diameters were different. The strength of the electric field was adjusted by controlling a high voltage power supply (Korea Switching, Republic of Korea) at a fixed TCD value. In addition, a series of experiments were performed inside a chamber with constant temperature and relative humidity. Filters with different fiber diameters were selected based on the morphology of the PVA nanofibers prepared under various electrospinning conditions. lists the conditions controlled during electrospinning.
Table 2. Experimental conditions for test filters produced by electrospinning.
2.3. Characterization of the fabricated filters
The morphology of the electrospun filters were measured using a field emission scanning electron microscope (FE-SEM, JSM-6701F, JEOL). The average fiber diameters and distributions were obtained by measuring more than 100 fibers from FE-SEM images. The filter thickness was measured using a micrometer. Coarse polyester mesh from which nanofibers had been collected was placed between a set of 10 A4 article sheets. The thickness was determined by subtracting the thickness of the A4 papers and coarse polyester mesh from the overall thickness. In addition, to minimize the discrepancy, the measurement was repeated five times, and averaged. Electrospun filters usually retain electrostatic charge that collects particles by electrostatic capture mechanisms, as well as by mechanical collection mechanisms. Therefore, it was necessary to simplify the collection mechanisms by neutralizing the electrostatic charges. There are many previous studies in which the electrostatic charges were neutralized by exposure to organic solvent (Lee et al. Citation2002; Jasper et al. Citation2007; Choi et al. Citation2014; Kim et al. Citation2019). Following the previous studies, the electrospun PVA filters were soaked with a non-polar ethylbenzene solution and then dried.
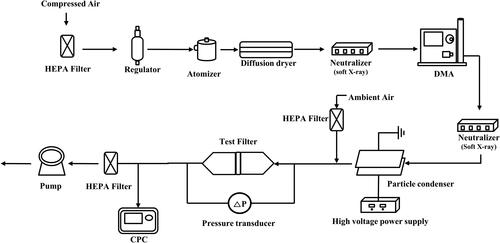
shows the experimental system used to measure the filtration performance of the test filters for collecting uncharged ultrafine particles. A test filter 47 mm in diameter was installed in a commercial filter holder manufactured by PALL Corporation, which included a stainless-steel mesh with fine pores to support a test filter and an O-ring to prevent air leaking. The detail dimension of the filter holder was 35 mm in height and 47 mm in inner diameter. However, the effective filter diameter was 37 mm, which resulted in filtration area of 10.75 cm2. Compressed air flowed into a HEPA filter, then entered an atomizer containing a 0.2 wt% NaCl aqueous solution to generate polydisperse NaCl test particles. Generated NaCl droplets were passed through a diffusion dryer to remove the moisture they contained. Then, the dried particles were neutralized using a soft X-ray neutralizer (XRC-05, HCT Co., Ltd) to bring them into an equilibrium charge state. A differential mobility analyzer (3081, TSI Inc.) was used to produce monodisperse NaCl particles, which were then passed through the soft X-ray neutralizer once more. Uncharged particles were prepared by removing charged particles with a charged particle condenser. The size of the test particles generated to evaluate the collection efficiency of the ultrafine particles ranged from 0.03 to 0.3 µm. The particle collection efficiency was determined by measuring particle concentrations upstream and downstream of the filter with a condensation particle counter (3775, TSI Inc.). The filtration velocity in the experiments was constant at 1.67 cm/s. Pressure drop is as important as the particle collection efficiency for filtration performance, so it was measured using a differential pressure manometer (Testo 510, Testo AG) at filtration velocities of 1, 1.67, 2, 3, 4, and 5 cm/s.
Figure 2. Experimental set-up for measuring filtration performance.
3. Results and discussion
3.1. Effect of process parameters for electrospinning on PVA nanofiber morphology
Electrospinning using polymers determines the morphology and diameter of the fiber produced under various conditions (Buchko et al. Citation1999; Deitzel et al. Citation2001; Demir et al. Citation2002; Lee et al. Citation2004; Kim et al. Citation2019). In this study, the feed rate and TCD were fixed under various parameters and the characteristics of the fiber were controlled by changing only the molecular weight, solution concentration, and electric field. In addition, these conditions were intended to produce filters that differed only in fiber diameter while having the same physical properties.
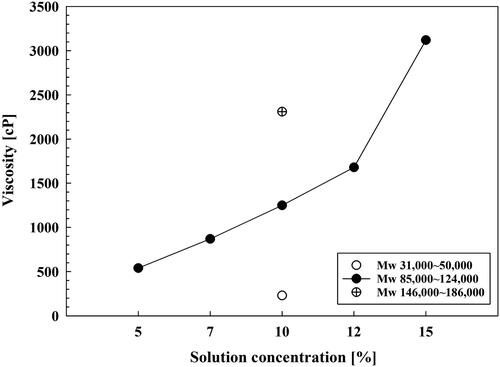
shows viscosity as a function of molecular weight and solution concentration. In general, the solution concentration and molecular weight during electrospinning directly affect the viscosity of the spinning solution. In addition, the correlation between molecular weight and the viscosity is proportional (Koski, Yim, and Shivkumar Citation2004; Lee et al. Citation2004). The solutions prepared for use in electrospinning also showed the same trends in concentration, molecular weight, and viscosity, as in the results of previous researchers on electrospinning. The viscosity of the PVA solution increased to 3120 cP at the concentration of 15 wt% and increased to 2310 cP at 10 wt% with molecular weight in the range 146,000-186,000.
Figure 3. Viscosity of the PVA solution at different concentrations and molecular weights.
and show the FE-SEM images, morphologies, and fiber size distributions of the electrospun fibers under several conditions. The effect of the polymer concentration and electric field on the fiber size distribution is shown in . The fiber diameter increased with increasing solution concentration due to increased viscosity when electrospinning was performed at concentrations of 5, 7, 10, 12, and 15 wt%. The fibers electrospun at a concentration of 5 wt% showed a non-uniform and incomplete morphology. In addition, they were not electrospun at a concentration of 15 wt% due to high viscosity. The average fiber diameters produced, ranged from 85 to 242 nm in the changing polymer concentrations. All of the fibers prepared at the experimental concentrations (except for those at 5 wt%) exhibited uniform fiber diameter. Among the concentrations tested, 10 wt% was selected to consider the effect on the molecular weight because it had the most uniform fiber diameter. Furthermore, the fiber diameters fabricated under advanced conditions all tended to decrease with increasing electric field strength. As with other parameters, the electric field that occurs during electrospinning has a significant influence on the fiber diameter. According to the results of other researchers who studied the effects of electric fields, this field increases the amount of charge retained in the solution, so the strong electrostatic repulsion produced by the high charge-density reduces the fiber diameter (Li and Xia Citation2003; Oh et al. Citation2012; Kim et al. Citation2019). In the results for the concentration, the difference in diameter between the fibers required the production of thick fibers to widen the gap to 160 nm. In order to fabricate thicker fibers, it was necessary to control the molecular weight because high viscosity was necessary in a possible electrospinning state. shows the effect of molecular weight on the fiber diameter at the selected 10 wt% concentration. As with the concentration results, as the molecular weight range increased from 31,000-50,000 to 146,000-186,000 the fiber diameter increased due to the viscosity increase, as mentioned above. However, at a molecular weight of 31,000-50,000, the low viscosity of the solution resulted in no fibers being prepared or beads formed. The molecular weight range 146,000-186,000, which resulted in the highest viscosity under the molecular weight conditions, produced fibers with uniform morphology and thick diameter because it had conditions sufficient for electrospinning. The average fiber diameter fabricated under these conditions ranged from 134 to 306 nm. In addition, this molecular weight range also showed a tendency for the fiber diameter to decrease as the electric field became stronger, as with the results for the solution concentration. Three test samples in which the fiber diameter differed by at least 100 nm (using average fiber diameter) obtained in these experimental results, were selected for use in preparing filters with the same physical properties (except fiber diameter). Three filters were made under controlled conditions with the same physical characteristics, except that they had fiber diameters of 100, 201, and 306 nm. These were used to evaluate the effect of fiber diameter on filtration performance. The nanofibers (100 nm) were prepared under the following conditions (molecular weight: 85,000-124,000, solution concentration: 7 wt%, applied voltage: 20 kV). Other nanofibers (201 nm) were fabricated under the following conditions (molecular weight: 85,000-124,000, solution concentration: 12 wt%, applied voltage: 15 kV). Finally, nanofibers of 306 nm were produced under the specific conditions of molecular weight: 146,000-186,000, solution concentration: 10 wt%, and applied voltage: 10 kV. shows the selected filters after fabrication using several controlled electrospinning processes. They had average fiber diameters of 100, 201, and 306, respectively, and the spinning time was adjusted to match the filter thickness and fiber weight per unit area to achieve the same physical properties. These fibers were all electrospun to have a loaded-fiber weight of 0.4 g/m2 and a thickness of approximately 5.1 µm. The packing density, calculated from the fiber weight per unit volume, was 0.052 for all three filters. shows the physical properties of the three filters used in the experiment.
Figure 4. FE-SEM images and fiber diameter distributions of electrospun filter media at various solution concentrations ((a) solution concentration: 5 wt%, (b) solution concentration: 7 wt%, (c) solution concentration: 10 wt%, (d) solution concentration: 12 wt%).
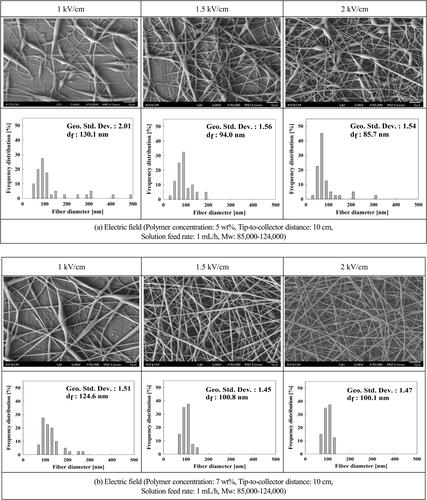
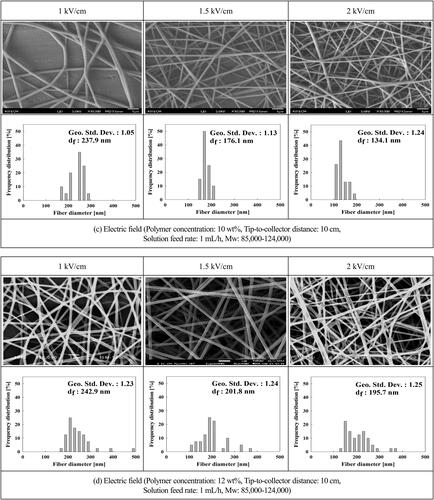
Figure 5. FE-SEM images and fiber diameter distributions of electrospun filter media at various molecular weights ((a) Mw: 31,000-50,000, (b) Mw: 85,000-1240,000, (c) Mw: 146,000-186,000).
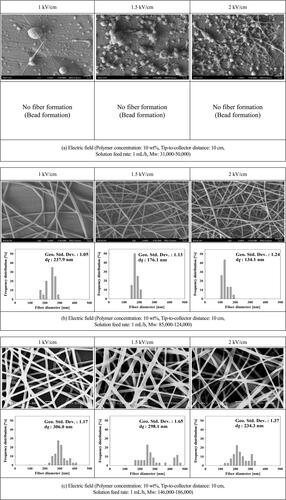
Figure 6. FE-SEM images of electrospun filter media with same physical properties aside from different fiber diameters.
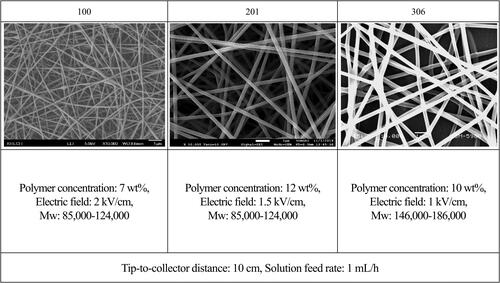
Table 3. Physical properties of the test filters’.
3.2. Effect of fiber diameter on filtration performance
Many researchers have used the boundary layer approach to solve the convective diffusion equation and obtain the theoretical efficiency due to diffusion (Friedlander Citation1958; Fuchs and Stechkina Citation1963; Pich Citation1965; Stechkina Citation1966; Kirsch and Stechkina Citation1978; Lee and Liu Citation1982). Lee and Liu (Citation1982) simplified semi-empirically, the single fiber collection efficiency due to diffusion and interception by considering the interference of neighboring fibers on a fibrous filter. In addition, the validity of the theory was confirmed by comparing the derived equation with the experimental data. They proposed a prediction equation of total single fiber collection efficiency, which has a negative interaction between Brownian diffusion and interception. The total single fiber collection efficiency of a fibrous filter is given by the following equation.
(1)
(1)
where Pe is the Peclet number given by EquationEquation (2)
(2)
(2) , R is the dimensionless interception parameter defined by EquationEquation (3)
(3)
(3) , and k is the hydrodynamic factor of a filter, as calculated using EquationEquation (4)
(4)
(4) .
(2)
(2)
(3)
(3)
(4)
(4)
where df is the mean fiber diameter, dp is the particle diameter, u is the filtration velocity, D is the diffusivity of particles, and α is the packing density.
The mean fiber diameter df, was calculated using EquationEquation (5)(5)
(5) , using the geometric standard deviation σg, and the geometric mean fiber diameter dfg, obtained from the fiber diameter distribution. The variance of the fiber diameter σ, is defined by EquationEquation (6)
(6)
(6) when the fiber size distribution follows a lognormal distribution.
(5)
(5)
(6)
(6)
Here, is defined by EquationEquation (7)
(7)
(7) , in which W is the fiber weight per unit area,
is the fiber density, A is the filtration area, and L is the thickness of the filter. The pressure drop of the filter
is determined by EquationEquation (8)
(8)
(8) (Kirsch and Stechkina Citation1978) and
is the measured pressure drop of the filter.
is the inhomogeneity factor of the filter, as calculated using EquationEquation (9)
(9)
(9) .
(7)
(7)
(8)
(8)
(9)
(9)
where Kn is Knudsen number. The filtration efficiency E, is given by EquationEquation (10)
(10)
(10) , where P is the particle penetration. The filter quality factor qF, is used to evaluate the filtration performance of filter media and is calculated using EquationEquation (11)
(11)
(11) .
(10)
(10)
(11)
(11)
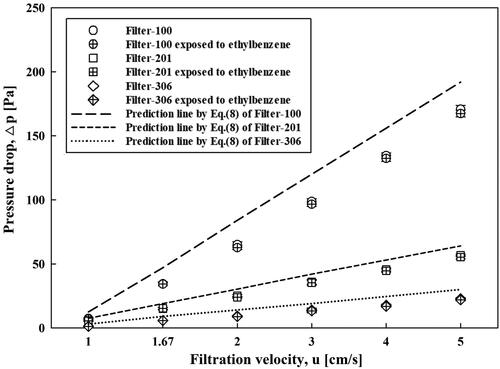
The same physical properties of the filters used in all the experiments were packing density (α = 0.052), filter thickness (L = 5.1 µm), and fiber weight per unit area (W = 0.4 g/m2). Among the physical characteristics of the filter, inhomogeneity factor () affects the filter performance as much as other factors. Therefore, except for this, the effect of only the fiber diameter on the filter performance cannot be clearly revealed. However, in reality, it is very difficult to make the physical properties of all filters the same when only the fiber diameters are different. Accordingly, it is necessary to understand the effect of the inhomogeneity factor on the filter performance. The filtration performances of the original electrospun PVA nanofiber filters (Filter-100, -201, and -306) were measured and compared with those of ethylbenzene-exposed filters. shows the pressure drops of the electrospun PVA nanofiber filters as a function of filtration velocity. According to EquationEquation (8)
(8)
(8) , because the fiber diameter of the filter and the pressure drop are in inverse proportion, the pressure drop increases as the fiber diameter decreases. The pressure drops of the electrospun PVA nanofiber filters increased with increasing filtration velocity and decreasing fiber diameter, as expected (Leung, Hung, and Yuen Citation2009; Hung and Leung Citation2011; Leung and Hung Citation2012; Kim et al. Citation2019). In addition, exposure of Filter-100, Filter-201, and Filter-306 to ethylbenzene resulted in no difference in the pressure drop. This confirmed that the internal structure of the filter had not changed. As a result of drawing the prediction line according to EquationEquation (8)
(8)
(8) , the prediction line shows some difference from the experimental data. It is conceivable that this difference is due to the inhomogeneity factor of the filter.
Figure 7. Pressure drops of the PVA nanofiber filters and comparison of experimental data with results predicted by the proposed equation.
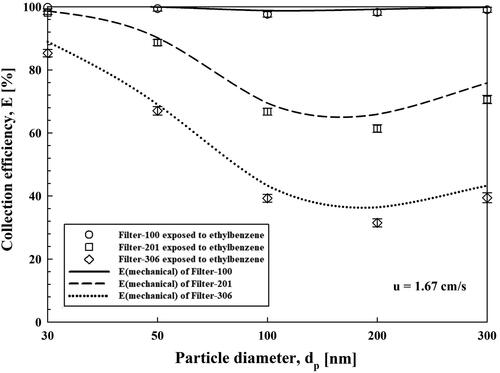
The experimental particle collection efficiencies of ethylbenzene-treated PVA nanofiber filters at a filtration velocity of 1.67 cm/s were plotted and are compared with theoretical ones in . Filter-100 showed a collection efficiency higher than 99.99% in a particle diameter range from 30 to 300 nm. Filter-201 showed collection efficiency higher than 88% and Filter-306 had collection efficiency higher than 64% over the same range of particle diameters. In addition, there was good agreement between experimental and theoretical collection efficiency. Particle collection efficiency increased with decreasing fiber diameter, when the other physical properties were the same. The reason can be attributed to the fact that diffusion and interception were the predominant collection mechanisms in nanofiber filtration. Both collection mechanisms are stronger with decreasing fiber diameter. Furthermore, the most penetrating particle sizes (MPPS) appeared in the size range 100-300 nm. This implies that the electrostatic charges of an electrospun filter were removed by ethylbenzene exposure.
Figure 8. Collection efficiencies of PVA nanofiber filters and comparison of experimental data with results predicted by the proposed equation.
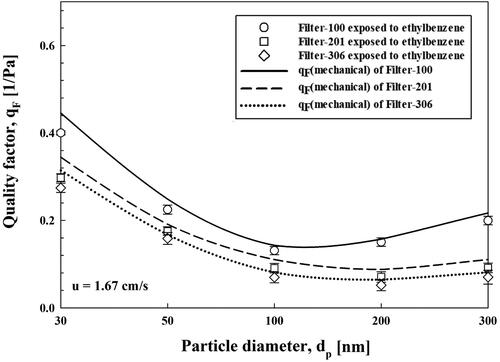
To evaluate the filtration performance, the filter quality factor (qF) was determined using EquationEquation (11)(11)
(11) . shows the experimental and theoretical qF values of ethylbenzene-treated filters. The experimental results are in good agreement with the theoretical ones. The qF of Filter-100 was higher than those of Filter-201 and Filter-306, even though it had a higher pressure drop than the others. The reason can be attributed to the fact that qF is defined as the ratio of the negative logarithm of penetration, to the pressure drop.
Figure 9. Filter quality factors of the PVA nanofiber filters and comparison of experimental data with results predicted by the proposed equations.
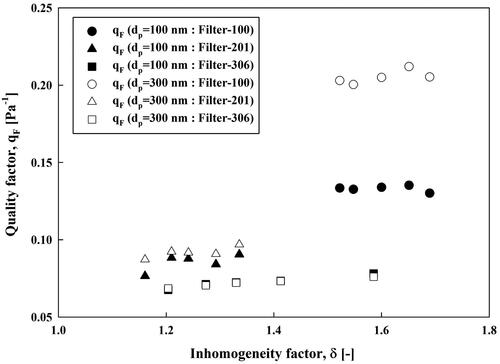
shows the filter quality factor as a function of inhomogeneity factor of the filter. We have shown that the test filters had the same filter thickness, packing density, and fiber weight per unit area. However, we could not guarantee that the test filters differed only in fiber diameter. Even if we made an effort to prepare uniform filters, we could not make homogeneous filters. The inhomogeneity factors of the test filters were relatively small and ranged from 1.1 to 1.7. However, the filter quality factor was almost constant regardless of the inhomogeneity factor. Therefore, we could also conclude that the filter quality factor is independent of the inhomogeneity factor, as Omori et al. (Citation2019) mentioned earlier.
Figure 10. The relationship between inhomogeneity factor of the filters and filter quality factors.
A feasibility study about the qF value is required to elucidate whether pressure drop or particle collection efficiency is the more critical parameter for determining filtration performance. However, in this study, we focused on performing an accurate investigation only on the effect of the fiber diameter. This specifically excluded other physical properties (filter thickness, packing density) that significantly affect filtration performance. As a result of this study, we found that particle collection efficiency and the filter quality factor increased with decreasing fiber diameter.
4. Conclusions
PVA nanofiber filters with the same physical properties aside from different fiber diameters, were successfully prepared by electrospinning. They were used in this study to accurately investigate the effect of fiber diameter on filtration performance. The fiber diameter of an electrospun filter increased with increasing molecular weight and solution concentration, and with decreasing electric field. The identical physical properties (packing density, fiber weight per unit area, and filter thickness) were obtained by controlling the spinning time differently. Three filters with different fiber diameters (100 nm, 201 nm, and 306 nm) were prepared in order to clearly understand the effect of the fiber diameter on nanofiber filtration. The filtration performance was measured experimentally and then compared with theoretical performance. The particle collection efficiency and pressure drop evaluated in the filtration performance, increased with decreasing fiber diameter, as expected according to filtration theory. The filter quality factor, which is used to compare filters with different characteristics, increased with decreasing fiber diameter. We found that the inhomogeneity factor was < 2, which implies a relatively homogeneous filter. In addition, the filter quality factor was not significantly influenced by the inhomogeneity factor. This study clearly verified the advantages of nanofiber filters, and suggested a future perspective for developing high-performance fibrous filters.
Additional information
Funding
References
- Barhate, R. S., C. K. Loong, and S. Ramakrishna. 2006. Preparation and characterization of nanofibrous filtering media. J. Membr. Sci. 283 (1–2):209–18. doi:https://doi.org/10.1016/j.memsci.2006.06.030.
- Buchko, C. J., L. C. Chen, Y. Shen, and D. C. Martin. 1999. Processing and microstructural characterization of porous biocompatible protein polymer thin films. Polymer 40 (26):7397–407. doi:https://doi.org/10.1016/S0032-3861(98)00866-0.
- Chang, D. Q., C. Y. Tien, C. Y. Peng, M. Tang, and S. C. Chen. 2019. Development of composite filters with high efficiency, low pressure drop, and high holding capacity PM2.5 filtration. Sep. Purif. Technol. 212:699–708. doi:https://doi.org/10.1016/j.seppur.2018.11.068.
- Choi, H. J., S. B. Kim, S. H. Kim, and M. H. Lee. 2014. Preparation of electrospun polyurethane filter media and their collection mechanisms for ultrafine particles. J. Air Waste Manage. Assoc. 64 (3):322–9. doi:https://doi.org/10.1080/10962247.2013.858652.
- Davies, C. N. 1953. The separation of airborne dust and particle. Proc. Inst. Mech. Eng. 167 (1B):185–99. doi:https://doi.org/10.1177/002034835316701b13.
- Deitzel, J. M., J. D. Kleinmeyer, J. K. Hirvonen, and N. C. B. Tan. 2001. Controlled deposition of electrospun poly(ethylene oxide) fibers. Polymer 42 (19):8163–817. doi:https://doi.org/10.1016/S0032-3861(01)00336-6.
- Demir, M. M., I. Yilgor, E. Yilgor, and B. Erman. 2002. Electrospinning of polyurethane fibers. Polymer 43 (11):3303–9. doi:https://doi.org/10.1016/S0032-3861(02)00136-2.
- Feng, Z., W. Pan, H. Zhang, X. Cheng, Z. Long, and J. Mo. 2018. Evaluation of the performance of an electrostatic enhanced air filter (EEAF) by a numerical method. Powder Technol. 327:201–14. doi:https://doi.org/10.1016/j.powtec.2017.12.054.
- Feng, Z., Z. Long, and J. Mo. 2016. Experimental and theoretical study of a novel electrostatic enhanced air filter (EEAF) for fine particles. J. Aerosol Sci. 102:41–54. doi:https://doi.org/10.1016/j.jaerosci.2016.08.012.
- Friedlander, S. K. 1958. Theory of aerosol filtration. Ind. Eng. Chem. 50 (8):1161–4. doi:https://doi.org/10.1021/ie50584a036.
- Fuchs, N. A., and I. B. Stechkina. 1963. A note on the theory of fibrous aerosol filters. Ann. Occup. Hyg. 6:27–30. doi:https://doi.org/10.1093/annhyg/6.1.27.
- Hajra, M. G., K. Mehta, and G. G. Chase. 2003. Effects of humidity, temperature, and nanofibers on drop coalescence in glass fiber media. Sep. Purif. Technol. 30 (1):79–88. doi:https://doi.org/10.1016/S1383-5866(02)00134-X.
- Hinds, W. C. 1998. Aerosol technology. 2nd ed. New York: Wiley-Interscience.
- Huang, S. H., C. W. Chen, Y. M. Kuo, C. Y. Lai, R. McKay, and C. C. Chen. 2013. Factors affecting filter penetration and quality factor of particulate respirators. Aerosol Air Qual. Res. 13 (1):162–71. doi:https://doi.org/10.4209/aaqr.2012.07.0179.
- Hung, C. H., and W. W. F. Leung. 2011. Filtration of nano-aerosol using nanofiber filter under low peclet number and transitional flow regime. Sep. Purif. Technol. 79 (1):34–42. doi:https://doi.org/10.1016/j.seppur.2011.03.008.
- Jackiewicz, A., and L. Werner. 2015. Separation of nanoparticles from air using melt-blown filtering media. Aerosol Air Qual. Res. 15 (6):2422–35. doi:https://doi.org/10.4209/aaqr.2015.04.0236.
- Jasper, W. J., A. Mohan, J. Hinestroza, and R. Barker. 2007. Degradation processes in corona-charged electret filter-media with exposure to ethyl benzene. J. Eng. Fiber Fabr. 2 (4):19–24. doi:https://doi.org/10.1177/155892500700200401.
- Kim, H. B., W. J. Lee, S. C. Choi, K. B. Lee, and M. H. Lee. 2019. Dependence of the fiber diameter on quality factor of filters fabricated with meta-aramid nanofibers. Sep.Ppurif. Technol 222:332–41. doi:https://doi.org/10.1016/j.seppur.2019.04.045.
- Kirsch, A. A., and I. B. Stechkina. 1978. The theory of aerosol filtration with fibrous filters. In Fundamentals of aerosol science, 165–256. New York: John Wiley & Sons.
- Koski, A., K. Yim, and S. Shivkumar. 2004. Effect of molecular weight on fibrous PVA produced by electrospinning. Mater. Lett. 58 (3–4):493–7. doi:https://doi.org/10.1016/S0167-577X(03)00532-9.
- Lee, J. S., K. H. Choi, H. D. Ghim, S. S. Kim, D. H. Chun, H. Y. Kim, and W. S. Lyoo. 2004. Role of molecular weight of atactic poly(vinyl alcohol) (PVA) in the structure and properties of PVA nanofabric prepared by electrospinning. J. Appl. Polym. Sci. 93 (4):1638–46. doi:https://doi.org/10.1002/app.20602.
- Lee, K. W., and B. Y. H. Liu. 1982. Theoretical study of aerosol filtration by fibrous filters. Aerosol Sci. Technol. 1 (2):147–61. doi:https://doi.org/10.1080/02786828208958584.
- Lee, M.-H., H. J. Choi, M. Kumita, and Y. Otani. 2020. Present status of air filters and exploration of their new applications. KONA Powder Part. J. 37 (0):19–27. doi:https://doi.org/10.14356/kona.2020001.
- Lee, M.-H., Y. Otani, N. Namiki, and H. Emi. 2002. Prediction of collection efficiency of high-performance electret filters. J. Chem. Eng. Jpn. 35 (1):57–62. doi:https://doi.org/10.1252/jcej.35.57.
- Leung, W. W. F., and C. H. Hung. 2012. Skin effect in nanofiber filtration of submicron aerosols. Sep. Purif. Technol. 92:174–80. doi:https://doi.org/10.1016/j.seppur.2011.02.020.
- Leung, W. W. F., and Y. T. Chau. 2019. Experiments on filtering nano-aerosols from vehicular and atmospheric pollutants under dominant diffusion using nanofiber filter. Sep. Purif. Technol. 213:186–98. doi:https://doi.org/10.1016/j.seppur.2018.12.021.
- Leung, W. W. F., C. H. Hung, and P. T. Yuen. 2009. Experimental investigation on continuous filtration of sub-micron aerosol by filter composed of dual-layers including a nanofiber layer. Aerosol Sci. Technol. 43 (12):1174–83. doi:https://doi.org/10.1080/02786820903261086.
- Leung, W. W. F., C. H. Hung, and P. T. Yuen. 2010. Effect of face velocity, nanofiber packing density and thickness on filtration performance of filters with nanofibers coated on a substrate. Sep. Purif. Technol. 71 (1):30–7. doi:https://doi.org/10.1016/j.seppur.2009.10.017.
- Li, D., and Y. Xia. 2003. Fabrication of titania nanofibers by electrospinning. Nano Lett. 3 (4):555–60. doi:https://doi.org/10.1021/nl034039o.
- Matulevicius, J., L. Kliucininkas, T. Prasauskas, D. Buivydiene, and D. Martuzevicius. 2016. The comparative study of aerosol filtration by electrospun polyamide, polyvinyl acetate, polyacrylonitrile and cellulose acetate nanofiber media. J. Aerosol Sci. 92:27–37. doi:https://doi.org/10.1016/j.jaerosci.2015.10.006.
- Oh, H. J., H. R. Pant, Y. S. Kang, K. S. Jeon, B. Pant, C. S. Kim, and H. Y. Kim. 2012. Synthesis and characterization of spider-web-like electrospun mats of meta-aramid. Polym. Int. 61 (11):1675–82. doi:https://doi.org/10.1002/pi.4260.
- Omori, Y., T. Gu, L. Bao, Y. Otani, and T. Seto. 2019. Performance of nanofiber/microfiber hybrid air filter prepared by wet paper processing. Aerosol Sci. Technol. 53 (10):1149–57. doi:https://doi.org/10.1080/02786826.2019.1634243.
- Pich, J. 1965. The filtration theory of highly dispersed aerosol. Staub Reinhalt. Luft 5:16–23.
- Podgorski, A., A. Balazy, and L. Grado. 2006. Application of nanofibers to improve the filtration efficiency of the most penetrating aerosol particles in fibrous filters. Chem. Eng. Sci. 61 (20):6804–15. doi:https://doi.org/10.1016/j.ces.2006.07.022.
- Stechkina, I. B. 1966. Diffusion precipitation of aerosols in fiber filters. Dokl. Acad. Nauk SSSR 167:1327–30.
- Thomas, D., P. Penicot, P. Contal, D. Leclerc, and J. Vendel. 2001. Clogging of fibrous filters by solid aerosol particles: Experimental and modeling study. Chem. Eng. Sci. 56 (11):3549–61. doi:https://doi.org/10.1016/S0009-2509(01)00041-0.
- Thomas, D., S. Pacault, A. Charvet, N. Bardin-Monnier, and J. C. Appert-Collin. 2019. Composite fibrous filters for nano-aerosol filtration: Pressure drop and efficiency model. Sep. Purif. Technol. 215:557–64. doi:https://doi.org/10.1016/j.seppur.2019.01.043.
- Tien, C. Y., J. P. Chen, S. Li, Z. Li, Y. M. Zheng, A. S. Peng, F. Zhou, C. J. Tsai, and S. C. Chen. 2020. Experimental and theoretical analysis of loading characteristics of different electret media with various properties toward the design of ideal depth filtration for nanoparticles and fine particles. Sep. Purif. Technol. 233:116002. doi:https://doi.org/10.1016/j.seppur.2019.116002.
- Wang, J., D. R. Chen, and D. Y. H. Pui. 2007. Modeling of filtration efficiency of nanoparticles in standard filter media. J. Nanopart. Res. 9 (1):109–15. doi:https://doi.org/10.1007/s11051-006-9155-9.
- Wang, J., S. C. Kim, and D. Y. H. Pui. 2008. Figure of merit of composite filters with micrometer and nanometer fibers. Investigation of the figure of merit for filters with a single nanofiber layer on a substrate. Aerosol Sci. Technol. 42 (9):722–8. doi:https://doi.org/10.1080/02786820802249133.
- Yun, K. M., C. J. Hogan, Y. Matsubayashi, M. Kawabe, F. Iskandar, and K. Okuyama. 2007. Nanoparticle filtration by electrospun polymer fibers. Chem. Eng. Sci. 62 (17):4751–9. doi:https://doi.org/10.1016/j.ces.2007.06.007.
- Zhang, Q., J. Welch, H. Park, C.-Y. Wu, W. Sigmund, and J. C. M. Marijnissen. 2010. Improvement in nanofiber filtration by multiple thin layers of nanofiber mats. J. Aerosol Sci. 41 (2):230–6. doi:https://doi.org/10.1016/j.jaerosci.2009.10.001.