
 ?Mathematical formulae have been encoded as MathML and are displayed in this HTML version using MathJax in order to improve their display. Uncheck the box to turn MathJax off. This feature requires Javascript. Click on a formula to zoom.
Abstract
Adhesion forces between microparticles and substrates is a parameter of fundamental importance in studies of surfaces contamination and decontamination, filter and surface cleaning, non-contact sampling, and environmental and occupational health assessments. This parameter can be estimated theoretically or determined experimentally. Due to the specificities of the processes, the experimental determination is one of the best choices. Techniques commonly used to determine the particle-substrates adhesion forces include the atomic force microscopy (AFM), electric field detachment method, the aerodynamic detachment, and the centrifuge method. The capability to measure several particles simultaneously; and to determine the adhesion forces of regular and irregular real powders on smooth or rough surfaces in a single experiment, producing statistically reliable results are some advantages attributed to the centrifugation technique. This work aimed to use the centrifuge technique to determine adhesion forces between soot particles and cellulose ester membranes. The effects of the average particles size (11.1 to 29.0 µm), powder consolidation relative centrifuge forces (press-on forces − 63.7, 255.0 and 1,593.6 RCF), and pore size of cellulose ester membranes (0.2 µm and 0.8 µm) were investigated. Adhesion forces between the soot and cellulose ester membrane substrates were directly affected by the press-on forces, by the average diameter of the soot particles, and by the pore size of the cellulose ester membranes. The theoretical models of Johnson–Kendall–Roberts (JKR) and of Derjaguin-Muller-Toporov (DMT) described the trend of adhesion forces as affected by the soot particle’s diameter; although showed high deviation from the experimental data.
Copyright © 2020 American Association for Aerosol Research
EDITOR:
1. Introduction
Adhesion forces between microparticles and substrates are present in various industrial process and operations such as surfaces contamination and decontamination of processing equipment, in studies of surfaces contamination and decontamination, filter and surface cleaning, powder mixing, comminution, and powder conveying. Adhesion forces are also involved in food and pharmaceutical process and products, e.g., wound dressing, powder handling, granulation, tabletting, dry powder inhalations, and so on (Podczeck Citation1998; Tighe and Mann Citation2011; Pietsch Citation2004; Egermann Citation1980; Nussinovitch Citation2017).
The adhesion forces might arise from intermolecular or electrostatic interactions, liquid and solids bridges, and are affected by particle size and morphology. Among the various forces involved in adhesion, the Van der Waals forces are considered one of the most important (Götzinger and Peukert Citation2003; Hamaker Citation1937; Kendall and Stainton Citation2001; Rumpf Citation1977). Van der Waals forces occur when the random motion of electrons in atoms and molecules produces transitory polarized zones, inducing the formation of dipoles (Rumpf Citation1977). At any moment, these dipoles can induce new dipoles in adjacent regions, creating the attraction forces.
Several theoretical models have been proposed to estimate the particle-particle and particle-substrate adhesion forces being the Johnson–Kendall–Roberts or JKR (Johnson, Kendal, and Roberts Citation1971), and the Derjaguin-Muller-Toporov or DMT (Derjaguin, Muller, and Toporov Citation1975) widely used. An excellent overview of the main adhesion models available in the literature for rough surfaces, covering single asperity and multiple asperity contacts were presented by Prokopovich and Starov (Citation2011).
However, due to the specificity of the process involved, the experimental determination of adhesion forces usually furnishes better estimates. The atomic force microscopy (AFM), the centrifuge method, the electric field detachment method and the aerodynamic detachment are experimental methods commonly used for determination of particle-substrate adhesion forces (Fillingham et al. Citation2019; Marti Citation2000; Salazar-Banda et al. Citation2007).
The AFM method is a well-established procedure for the determination of particle- substrate adhesion forces in several applications (Götzinger and Peukert Citation2003; Marti Citation2000). Notwithstanding, from an engineering point of view, the AFM technique presents some restrictions, e.g., the characterization of individual particles adhesion and the need of an excessive number to obtain reliable data, mainly for irregular particles. These drawbacks turn the AFM method a very time-consuming procedure (Zafar et al. Citation2014).
Otherwise, the vibrating disk and the centrifuge technique permits the measurement of many particles at once, furnishing statistically broader results (Moeller and Nirschl Citation2017). The former technique depends on mechanically stable and relatively flat substrates, while the latter makes use of reliable, constant accelerations in a simple centrifuge setup. One of the main advantages of the centrifuge technique is its capability to determine the adhesion forces of regular and irregular real powders on both smooth and rough surfaces in a single experiment.
Therefore, the centrifuge technique might yield statistically trustworthy results for the whole powder particles under study (Salazar-Banda et al. Citation2007; Nguyen et al. Citation2010; Booth and Newton Citation1987). Determination of adhesion using centrifuge techniques is based on detaching the particles from a substrate surface by centrifugal force. The magnitude of the centrifugal force applied is a function of the mass of the particles (m), the centrifuge angular velocity (ω), of the distance between the surface of the substrate and the axis of rotation (r). At equilibrium, the magnitude of the applied centrifugal force is equal to the adhesion force, but with opposite direction. When the magnitude of the centrifugal force exceeds the magnitude of adhesion force, the particles are detached from the surface.
Lam and Newton (Citation1991) used the centrifuge technique to evaluate the influence of applied press‐on forces on the adhesion of classified pharmaceutical polyethene-glycol (PEG) 4000, Starch 1500, spray-dried lactose and heavy precipitated calcium carbonate powder over stainless steel substrate. The slope of each regression line indicated quantitatively the change of the median adhesion force per unit increase of the applied force and was dependent on the properties of tested materials. In another study, the authors investigated the effects of particle size on the adhesion behavior of two pharmaceutical powders, Starch 1500 and spray-dried lactose, and observed an increase in the geometric mean adhesion with the increment of particle size (Lam and Newton Citation1992). Based on the experimental results the authors suggested that the molecular van der Waals forces were the prevailing force component involved in the adhesions phenomenon. The data treatment using the classical JKR (Johnson, Kendal, and Roberts Citation1971), and the DMT (Derjaguin, Muller, and Toporov Citation1975) theories of adhesion contact permitted determine approximate values of the mechanical work of interaction, which was 7.34 mJm- for Starch 1500 and 2.56 mJm for spray-dried lactose, which indicate that larger adhesive bond breakage energy is required for the starch detachment from the substrate surface compared to the spray-dried lactose. The particle-substrate adhesion forces determined for 04 different powders (polyethyleneglycol (PEG) 4000, pregelatinized starch (Starch 1500), spray-dried lactose and calcium carbonate) also showed a dependence of the application time of the press-on force (Lam and Newton Citation1993), being with a more significative for the harder spray-dried lactose, compared to the softer PEG 4000 and Starch 1500.
The influence of the material properties on the adhesion forces was also verified by Salazar-Banda et al. (Salazar-Banda et al. Citation2007), which investigated effects of size of powdery phosphatic rock (ρ p = 3,090 kg m−3) and manioc starch particles (ρ p = 1,480 kg m−3) on adhesion forces over a stainless-steel surface. It was observed that the adhesion force increased with particle size; and that the adhesion forces for the phosphatic rock particles was superior to ones determined for the manioc starch particles. The data treatment using the DMT (Derjaguin, Muller, and Toporov Citation1975) theory showed better agreement for the phosphatic rock particles adhesion on the stainless-steel surface; while the theoretical estimates were lower than the experimental values for the manioc starch particles, perhaps due to the small roughness of these particles, their physical properties (softer and deformable material) and/or specific chemical interactions due to its organic nature. An estimate of the separation distance between the surfaces in contact was 1.0 × 10⁻⁹ m for the phosphatic rock and 5.0 × 10⁻¹⁰ m for the manioc starch, and was weakly dependent on the particle size range.
Podczeck and Newton (Citation1995) also verified that the adhesion strength increased with the applied press on forces until a maximum is reached, after that the additional applied force cause only a more elastic deformation. The adhesion and auto-adhesion forces particle-substrate of pharmaceutical powders (salmeterol xinafoate and lactose monohydrate) was also affected by the relative humidity of the environment (Podczeck, Newton, and James Citation1997). The effect magnitude showed dependence on the structure of the substrate surface, the solubility of the particles adhered, and the solubility of the surface material. Irreversible strong adhesion forces at particles interfaces were observed for air relative humidity higher than 75%.
A critical evaluation of these various works, however, shows a lack of information regarding the effects of some process variables on particle-substrate adhesion forces mainly for organic substrates. The understanding of the differences in adhesion forces shown by regular and irregular particles with smooth or rough organic surfaces is crucial, for example, to design efficient and economical cleaning devices gas filtration using fabric or cellulose filter media. Yet, to the best of our knowledge, there are not research works reported in current literature dealing with the adhesion of soot particles to filter media.
Therefore, this study aimed to investigate the particle-substrate adhesion forces between organic materials (soot and cellulose ester membranes) by using the centrifuge technique, evaluating the effects of particle size, substrate porosities, and the powder consolidation press on forces applied. The experimental data of adhesion forces were compared with estimates obtained by JKR and DMT models developed to describe the adhesive interactions of cohesive particles (Derjaguin, Muller, and Toporov Citation1975; Johnson, Kendal, and Roberts Citation1971; Barthel Citation2008).
Soot (ash) is a residue from sugarcane bagasse burning, and are recognized to affect negatively the respiratory health of sugarcane mill workers and surrounding inhabitants. It can also form deposits on surfaces of solar cells, reducing its performance (Karmouch and Hor Citation2017). Soot is generally highly heterogeneous and it constitutes a mixture of inorganic materials, charcoal and, partially pyrolyzed material (Le Blond et al. Citation2017; Teixeira et al. Citation2015). The material is dark, fine and moderately soluble in water.
2. Materials and methods
2.1. Physical properties of the soot particles
The particulate material used as a model was the sugarcane bagasse burning ash, here named as soot. It was collected from a wet scrubber installed at the outlet of the sugarcane bagasse boiler of Ipiranga Sugar and Alcohol Plant (Descalvado city, Brazil). The wet material was oven-dried and deagglomerated to return to its original characteristics. The sugarcane bagasse is essentially fibrous, and the burned ash (soot) tended to partially maintain these characteristics until the complete carbonization, when the fibrous structure collapsed. A very irregular powdered product of low density is formed; exhibiting prismatic, spherical and fibrous particles (Imran and Anwar Khan Citation2018; James and Pandian Citation2017; Payá et al. Citation2002; Torres Agredo et al. Citation2014). shows typical photomicrograph obtained by scanning electronic microscopy (SEM) of the soot, with magnifications of 1000 and 5.000 times, respectively, in and . The photomicrographs show that the powdery is composed of particles with very irregular shapes and polydisperse sizes, typical of the burned sugarcane bagasse ash.
Figure 1. Typical SEM photomicrographs of soot, with magnifications of (a) 1000 and (b) 5000 x.
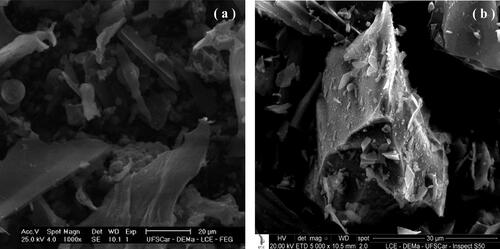
The average sphericity (actually circularity) of the powdery material (Φ), defined as the ratio of the area to the square perimeter of particles was determined by image analysis (Ulusoy Citation2008), given the value of 0.67. The image analysis was carried out in the software Image-Pro Plus® 7.0, being the images acquired in an optical microscope (BX60, Olympus), connected to a digital camera.
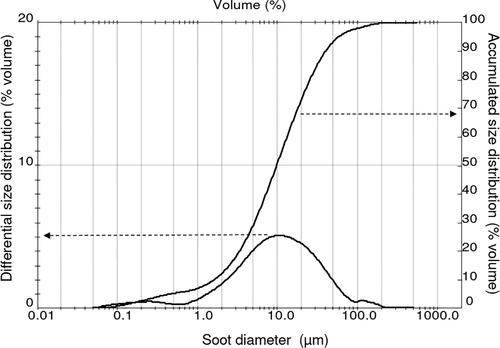
The accumulated and differential size distribution (% volume) of the soot was determined by light scattering in a Malvern Mastersizer analyzer (Malvern Instruments, UK). shows a polydisperse size distribution, showing d10, d50 and d90 of 1.8, 10 and 40 µm, respectively; and a SPAN ((d90 – d10)/d50) of 3.82.) These values show that soot is constituted by a high amount of particulate matter ≤2.5 µm (PM2.5) and from 2.5 µm to 10 µm (PM2.5-10) particles, which can originate respiratory problems to burning plants workers and neighborhoods inhabitants; therefore needs to be removed from biomass burning emissions (Amaral et al. Citation2016). The material has a density of 2,170 kg/m3, determined in a digital Helium pycnometer (Micromeritics AccuPyc 1330).
Figure 2. Particle size distribution of the soot.
2.2. Preparation and characterization of organic substrate
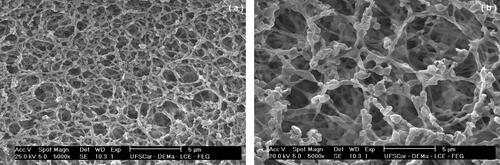
The organic substrates used were cellulose ester membrane filters (Schleicher & Schuell Membrane Filters) of 0.2 and 0.8 µm grades. These filters membranes are widely used for monitoring of particulate material. shows typical SEM photomicrographs of the membrane filters used in the experiments. The cellulose ester membranes showed non-rigid surfaces and were highly irregular, which differentiated them significantly from the substrates used in previous studies, namely stainless steel, PVC, glass, and Teflon (Felicetti et al. Citation2008; Felicetti et al. Citation2009; Salazar-Banda et al. Citation2007).
Figure 3. SEM micrographs of the cellulose ester membrane filters with a magnification of 5000 x. (a) Grade 0.2 µm; (b) Grade 0.8 µm.
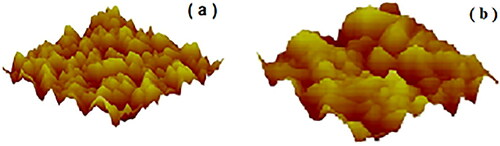
The membranes roughness were determined in an Atomic Force Microscopy Bruker model Nanoscope V, since it has effects on particle-particle and particle-substrate contacts. The topographical images were taken in the tapping mode in the Atomic Force Microscope Multimode SPM da Digital Instruments, using the 100 µm silicon nitride cantilever with spring constant of 0.38 N/m. show topographical images of the 0.2 and 0.8 µm membranes, with their specific roughness. The increase in the membrane pore from 0.2 to 0.8 increased significantly its roughness, from 169 nm to 334 nm (maximum values). It is expected that the increase in membrane roughness should reduce the contact points between particles and the substrate.
Figure 4. AFM topographical images of the cellulose ester filter membrane with their specific roughness. (a) Grade 0.2 µm, roughness of 169 nm; (b) grade 0.8 µm, roughness of 334 nm.
2.3. Determination of particle adhesion by centrifuge technique
The centrifuge technique was used to evaluate the adhesion profile between soot particulates and cellulose filter membranes of different porosities. The experimental setup used consisted of a powder disperser (PD-10 vacuum gauge, Galai), a microcentrifuge (MA-860, Marconi), an optical microscope (BX60, Olympus) connected to a digital camera, and a personal computer loaded with the software Image-Pro Plus 7.0, used for the determination of the analytical results. A specially designed aluminum tube and adapters (Salazar-Banda et al. Citation2007) was installed perpendicularly to the centrifuge rotation axis to accommodate the cellulose membrane proof disk of 14 mm of diameter. The disks were divided into twelve quadrants, which permit to locate a particular particle or area of the substrate during image analysis, during the whole experimental protocol, avoiding repeated measurements. A statistical procedure was used for the determination of press-on and detachment forces. First, the soot powder was homogeneously dispersed on the surface of the proof disk with the aid of the powder disperser (PD-10 vacuum gauge, Galai), and was placed inside the aluminum tube in a position opposite to the centrifuge force action (press-on force) to consolidate the powder material. Then, the disk position was inverted to perform the particle detachment assays. The number of particles measured are random, and depends on their size, press-on and detachment forces used. However, the minimum and maximum number of particles measured in each detachment force ranged nearly between 10 and 45, at each size intervals. The results presented are values of triplicate assays, which were summed together due to the random character of the measurement process. Three distinct press-on forces were used to consolidate the soot on the substrate surface, namely 63.7, 255.0 and 1,593.6 RCF (Relative Centrifugal), corresponding to 1,000, 2,000, and 5,000 rpm of the centrifuge. RCF (or g-force) is determined by the formula: RCF = 0.01097.rc.rpm2, where rc is the radius of the centrifuge rotor (0.057 m). The detachment centrifugal forces ranged from 63.7 to 12,490.3 RCF (1,000 to 14,000 rpm – increasing 2,000 rpm each step). The press on and detachment (spin-off) forces were applied on the proof disk for 1 min each test. After each rotation run the proof disk containing the remaining soot was removed and placed in an optical microscope (Olympus BX60). Digital images were acquired with the aid of a digital camera connected to the microscope. The images were analyzed in the Image Pro-Plus 7.0 software, to determine the size and quantity of soot particles remaining on the cellulose membrane disk surface. Counts of the number of particles consolidate or removed from the disk surface were made and classified in the following particle diameter intervals: 11.1–17.0, 17.1–23.0, and 23.1–29.0 µm.
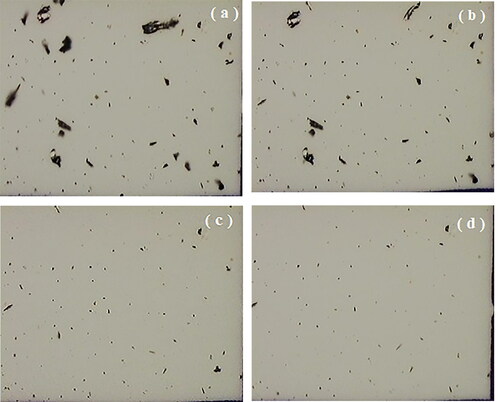
The equivalent volume diameter used for the evaluation of the centrifuge tests was determined by the following equation: dp = 3.Vp/2.Ap. The particle volume was determined as: Vp = 4/3 Ap.rp; where Ap and rp are determined by image analysis, as proposed by Salazar-Banda et al. Citation2007). shows typical photomicrographs of the soot remaining on the cellulose membrane disk after application of the press-on force of 255.0 RCF, and after detachment forces of 63.7; 1,593.2; 5,161.8 and 12,490.3 RCF.
Figure 5. Typical photomicrographs of the soot on the first zone (2 x 2 mm) of the cellulose ester membrane disks proof after detachment forces of 63.7; 1,593.2; 5,161.8 and 12,490.3 RCF (a to d), for the press-on force of 255.0 RCF and pore size of 0.2 µm.
3. Results and discussion
3.1. Effect of press-on and detachment forces on the percentage of soot remaining on the cellulose ester membrane filter media of grade 0.2 and 0.8 µm
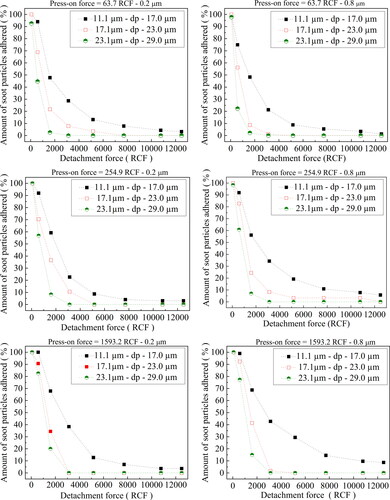
shows the experimental results of the remaining percentage of soot powdered material on the cellulose ester membrane disks of grade 0.2 and 0.8 µm as a function of the detachment forces applied (63.7 to 12,490.3 RCF, corresponding to 1,000 to 14,000 rpm) discriminated according to soot particle diameter ranges of 11.1–17.0, 17.1–23.0, and 23.1–29.0 µm, for the press-on forces of 63.7, 255.0 and 1,593.6 RCF. From the graphs presented, it can be seen that the percentage of remaining solids on the test disk shows dependence on the particle size ranges, press-on and detachment forces. A small portion of the particles may be adhered or trapped on the cellulose ester membrane surface after the detachment tests, mainly for small detachment forces, as can be seen in . However, most of the particles that remained on the membrane substrate were outside the size ranges used to determine adhesion forces (11.1 µm to 17.0 µm; 17.1 µm−23.0 µm; 23, 1 µm− 29.0 µm); which tend to be almost completely removed, mainly for the higher particle size ranges, as can be seen in . Therefore, the effect of the small particles retained on surfaces membrane on the adhesion forces can be assumed as negligible. Indeed, at detachment forces of 63.7 RCF, a high % of the particles remained adhered to the cellulose ester membrane disk, independently of the particle size ranges and press-on force used, for both 0.2 and 0.8 µm membranes pore sizes. However, the soot particles adhesion behavior is drastically changed when the detachment forces are increased beyond 573.5 RCF, exhibiting differences according to cellulose grade used. It can be seen from the Figures that the percentage the soot particles remained on the cellulose membrane surface for each detachment force showed a similar trend. The percentage number of particles adhered to the cellulose membrane tended to decrease conversely with the soot particles size ranges and with detachment forces used. Similar behavior was reported by Salazar-Banda et al. Citation2007), for adhesion of powdery phosphatic rock (ρp = 3,090 kg m−3) and manioc starch particles (ρp = 1,480 kg m−3) over a stainless-steel surface.
Figure 6. Percentage of adhered soot particles as a function of detachment force for 0.2 μm and 0.8 μm cellulose ester membrane filter media (press-on forces of 63.7, 255.0, and 1,593.6 RCF.
3.2. Adhesion forces between soot particles and cellulose ester filter membranes
The adhesion strength force acting over soot particles adhered to the test disk might be determined from the detachment centrifugal force (Fc) applied, which is a function of the particle mass (m, in kg), of the centrifuge angular velocity (ω, in rad/s), and the average distance between the substrate surface and the centrifuge rotation axis (r, with a value of 0.057 m). Fc (detachment force) is given by EquationEquation (7)(7)
(7) .
(1)
(1)
where: m = Vp.ρp, with ρ
p
= 2,170 kg/m3. show a graph of the Fc as a function of the percentage amount of soot powder particles remained on cellulose ester filter membranes for the three ranges of soot powder diameters (11.1–17 µm, 17.1–23 µm and 23.1–29 µm); for press-on forces of 63.7, 255.0, and 1,593.6 RCF (mono-log scale). The mean mass of particles in each size intervals were determined according to (Petean and Aguiar Citation2015). As expected, the amount of soot particles adhered to the cellulose membrane disks, for pore sizes of 0.2 and 0.8 µm decrease conversely with the strength of detachment forces acting over the soot particles. The magnitude of the detachment force tended to be higher for the size range of 23.1–29.0 µm, at the same centrifuge rotation. This result indicates that detachment of big particles occurs more easily, thus requiring a lower RCF to start the disengagement of the particles from the cellulose membrane surfaces. It can be seen that Fc and the amount of soot particles remained in the cellulose ester membranes correlate linearly in a logarithmic probability scale, for the three press-on forces used; evidence of a log-normal distribution. These results are in close agreement with previous results reported in the literature (Zimon Citation1982; Podczeck and Newton Citation1995; Felicetti et al. Citation2009). Hence, the adhesion force of the soot particles to the cellulose ester membranes can be characterized by the geometric median adhesion force (GMAF) and the geometric standard deviation (SD-G), as reported by Lam and Newton (Lam and Newton Citation1992). shows the experimental results of the GMAF and SD-G for the three soot particles size ranges at press-on forces of 63.7, 255.0, and 1,593.6 RCF, for cellulose ester membranes of 0.2 and 0.8. The processing conditions caused remarkable effects on the experimental values of the GMAF. However, the effects on SD-G was marginal, which can be linked to the random amount of soot particles dispersed in the system, during repeated experimental runs.
Figure 7. Resulting detachment forces as a function of the percentage amount of soot powder particles remained on cellulose filter membranes, for press-on forces of 63.7, 255.0, and 1,593.6 RCF.
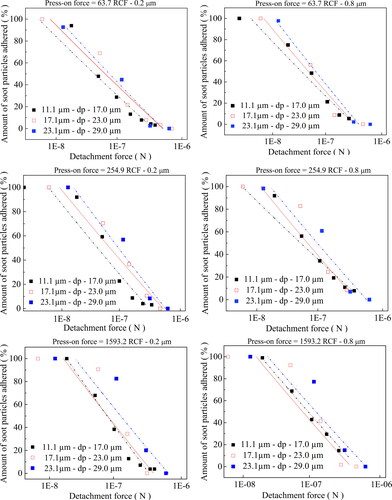
Table 1. Geometric median adhesion force (GMAF) and geometric standard deviation (SD-G) for the three soot particles fractions for cellulose ester membranes with pores sizes of 0.2 and 0.8 µm.
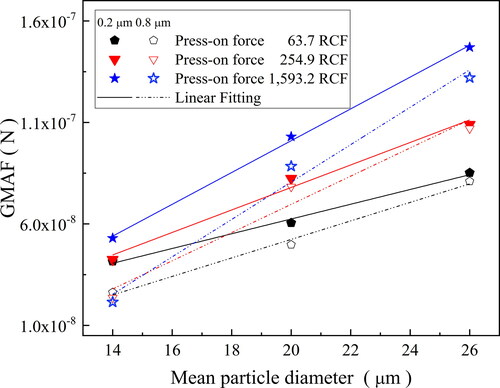
The effects of the evaluated variables (press-on forces and soot pore size ranges) on adhesion forces are better observed in . The highest adhesion force values were obtained for the 0.2 µm cellulose ester membrane (solids symbols and lines), which can be associated to its smoother surfaces (see ), and greater contact areas. Also, the adhesion forces increased with the consolidation forces (press-on). High press-on forces might promote a higher deformation on the cellulose ester membrane substrate, increasing the contact area, hence favoring the adherence of the particles, effect more pronounced at the press-on force of 1,593.2 RCF. Notwithstanding, the values of adhesion forces determined for soot particles to cellulose ester membranes were lower than the ones reported for different materials and substrates using the same technique (Petean and Aguiar Citation2015; Salazar-Banda et al. Citation2007; Felicetti et al. Citation2009), due to the distinct physicochemical properties of the powdered materials and substrates used (e.g., size distribution, particles shape, composition, bulk density, rugosity, surface energies, and so on). It can be seen from that adhesion forces tended to increase linearly with the soot particles diameters intervals, in close agreement with previous works (Salazar-Banda et al. Citation2007; Felicetti et al. Citation2009).
Figure 8. GMAF as a function of the soot particles size range, for press-on forces of 63.7, 255.0, and 1,593.6 RCF and cellulose ester membrane of 0.2 µm and 0.8 µm.
3.3. Comparison of experimental results of adhesion forces with theoretical estimates
The experimental data of adhesion forces were compared with estimates obtained by two theoretical models commonly used to estimate the adhesion forces particle-particle and particle-substrate, namely the Johnson–Kendall–Roberts or JKR, and the Derjaguin-Muller-Toporov or DMT theories developed to describe the contact mechanics of cohesive particles (Derjaguin, Muller, and Toporov Citation1975; Johnson, Kendal, and Roberts Citation1971). The models can be described by a similar form, given by EquationEquation (2)(2)
(2) .
(2)
(2)
where W is the work of adhesion, dp is the diameter of the adhered particle, and kt is a theoretical constant, which depends on the particular assumptions of the adhesion force model used. The values of kt for DMT and JKR models are, respectively, π, and 3π/4.
The JKR and DMT models describe the effect of deformation on the adhesion force, and are appropriate for small and fully elastic deformations. The roughness of the surfaces of materials has the effect of reducing the adhesion force between the bodies in contact, according to the particle diameter. W is the work of adhesion particle-substrate (W12), and might be calculated by the following equation:
(3)
(3)
where W12 is the work of adhesion per unit area between two bodies 1 and 2, γ1 and γ2 are the surface tension of the systems 1 and 2, respectively. The term γ12 is the surface tension of the interface between the media 1 and 2, which can be calculated by Antonow’s rule, described as follows (Adamson and Klerer Citation1977):
(4)
(4)
According to Wu (Citation2017), the work of adhesion corresponds to the decrease in the Gibbs free energy per unit area, when an interface is formed between two different surfaces. In the case of solids, γ1 is represented by γS, with units of energy per unit area (J m−2). A further two equations (EquationEquations (5)(5)
(5) and Equation(6)
(6)
(6) ) for the interfacial tension were presented by (Brandrup, Immergut, and Grulke Citation1999), relating the interfacial tension to the surface tensions of each medium (γ1 and γ2) and their respective components of dispersion (γ1
d and γ2
d) and polarization (γ1
p and γ2
p).
(5)
(5)
(6)
(6)
The surface tension of an element (γi) is the sum of its dispersion and polarization components:
(7)
(7)
The surface tension (γ) of the soot powder and the cellulose ester was obtained from the literature (Brandrup, Immergut, and Grulke Citation1999; Glass and Larsen Citation1994), from which were determined the respective components of dispersion (γd) and polarization, (γp), as can be seen in . The work of adhesion (W) is the base of the JKR and DMT models. To calculate the values of the work of adhesion that best fit to the experimental results of this work, the interfacial tension substrate/powdery material (γ12) were estimated by three distinct methods: Antonow rule, geometric mean, and harmonic mean ().
Table 2. Surface tensions of the adhesion components.
Table 3. Interfacial tension and the work of adhesion determined by using the Antonow rule, geometric, and harmonic means for the soot cellulose membrane system.
The values of the work of adhesion determined by the geometric mean, harmonic mean, and Antonow rule were used to determine the theoretical adhesion forces by the studied models, which were compared with the experimental values. Albeit still distant from the experimental data, the Antonow rule exhibited the closest agreement. Hence, this rule was adopted to determine the theoretical values of the adhesion forces by the JKR and DMT models, which are compared with the experimental values in .
Figure 9. Comparison of experimental data of the adhesion forces for soot-cellulose ester membrane (pore sizes of 0.2 μm and 0.8 μm) with estimates by JKR and DMT models; for press-on forces of 63.7, 255.0, and 1,593.6 RCF.
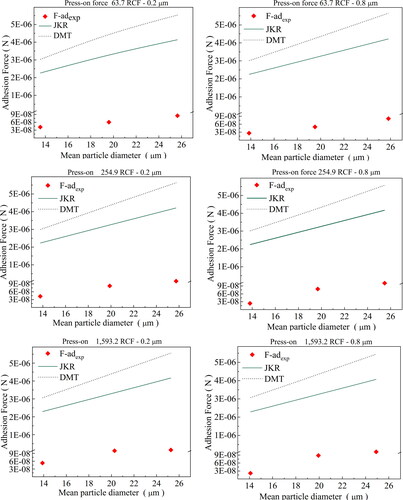
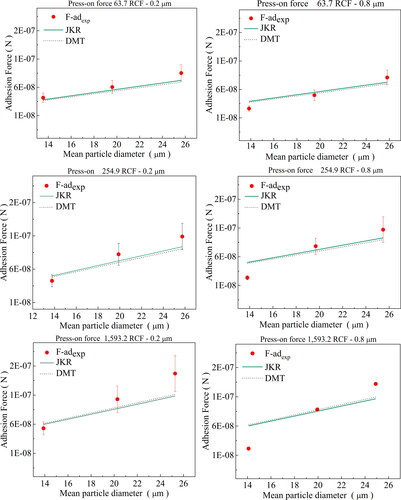
The overestimated values of the adhesion forces determined by the JKR and DMT theories are due to the assumptions used to define the contact interactions in the development of these models. These models have been proposed to describe the adhesion forces between smooth spherical particles or between spherical and flat particles (Barthel Citation2008). The soot powder used in our work has a highly irregular shape (sphericity of 0.67), and a polydisperse size distribution. Also, the cellulose ester membranes have pores (0.2 and 0.8 µm) and roughness (169 and 334 nm); properties not considered in the models used. These characteristics significantly reduced the actual points of contact between the soot particles and the surfaces of the cellulose ester membranes, consequently decreasing the adhesion forces (Cheng, Dunn, and Brach Citation2002). Another important point is that the tabulated values of surface tension of the solids used to estimate the adhesion work can differ significantly from the real values if determined at real experimental conditions used (Petean and Aguiar Citation2015; Israelachvili Citation2011). Therefore, the theoretical values of the kt constant used in the JKR and DMT models did not reflect the reduction in the adhesion forces caused by the influence of irregularities on surfaces and particles, as well as due to experimental conditions used. However, we can replace the constant kt of the JKR and DMT adhesion models with the experimental value kt,r to correct the deviations observed; and EquationEquation (2)(2)
(2) , becomes:
(8)
(8)
where: kt,r = kc.kt, being kc is a dimensionless correction factor. The kc values for the JKR and DMT models were determined using an arithmetic mean relationship between the experimental and theoretical results of the adhesion forces. shows the kc values obtained; where it can be seen that kc increases with the consolidation forces used. Several studies reported in the current literature address the effects of particles and surface irregularities on adhesion models (Cheng, Dunn, and Brach Citation2002; Ciavarella et al. Citation2019); however, a throughout analysis of these effects goes beyond the objective of the present study.
Table 4. kc correction factors for the JKR and DMT models used to describe the adhesion forces of the soot/cellulose ester membrane system.
shows a comparison of the experimental data of the adhesion forces as a function of the soot mean diameter with the corrected values determined by JKR and DMT models; for press-on forces of 63.7, 255.0 and 1,593.6 RCF and cellulose ester membrane disks of 0.2 µm and 0.8 µm pore size, It can be seen that the experimental and correct theoretical values of adhesion force values showed good agreement. Therefore, it can be concluded that the adhesion forces between soot particles and cellulose ester membranes might be determined by the DMT and JKR models, if the correction factor kc is known.
Figure 10. Experimental results of the adhesion forces and the corrected theoretical values determined by JKR and DMT models as a function of the mean soot diameter; press-on forces of 63.7, 255.0, and 1,593.6 RCF and cellulose membranes of 0.2 µm and 0.8 µm pore sizes.
4. Conclusions
The centrifuge technique was successfully used to investigate the influence of the size of soot particles and the nature of an organic substrate (cellulose ester membrane filters) on the particle-substrate adhesion force. The results showed that the strength of adhesion soot-substrate, as well as the particles detachment (spin-off) from the surface of the membranes, depends on the soot average diameter, consolidation forces applied (press-on), and cellulose membranes pore size (rugosity). The cellulose ester membrane with smaller porosities were associated with greater adhesion forces. The adhesion force also increased with the powder consolidation forces (press-on).
The comparison between the experimental results of adhesion forces with estimates calculated by the JKR and DMT models showed high deviation, but the models could describe adequately the trend of adhesion forces as affected by the particle’s diameter. Therefore, the adhesion forces between soot particles and cellulose ester membranes might be determined by the JKR and DMT models, provided the correction factor, kc, is known.
| Notation | ||
| Ap | = | mean particle surface area L2 |
| d10 | = | size corresponding to 10% of particle size distribution L |
| d50 | = | size corresponding to 50% of particle size distribution L |
| d90 | = | size corresponding to 90% of particle size distribution L |
| dp | = | particle diameter L |
| Fad | = | adhesion force M L T−2 |
| Fc | = | centrifugal force M L T−2 |
| kc | = | correction factor for the JKR and DMT theoretical models |
| kt | = | theoretical constants of the JKR and DMT models |
| kt,r | = | corrected constants of the JKR and DMT models |
| r | = | radius of the centrifuge rotor L |
| rp | = | particle radius as determined by the Image-Pro Plus 7.0 software L |
| m | = | mean particle mass M |
| Vp | = | particle volume L3 |
| W | = | work of adhesion M T−2 |
| W1,2 | = | work of adhesion particle-substrate M T−2 |
| Greek letters | ||
| ρp | = | particle density M L−3 |
| γ | = | surface tension of the systems M T−2 |
| γ1 | = | surface tension of the systems 1 M T−2 |
| γ2 | = | surface tension of the systems 2 M T−2 |
| γ12 | = | surface tension of the interface between the media 1 and 2 M T−2 |
|
| = | dispersion component of the surface tension of the system 1 M T−2 |
|
| = | dispersion component of the surface tension of the system 2 M T−2 |
|
| = | polarization component of the surface tension of the system 1 M T−2 |
|
| = | polarization component of the surface tension of the system 2 M T−2 |
| γs | = | surface tension of the solids M T−2 |
| ω | = | angular rotation of the centrifuge T−1 |
Acknowledgments
The authors acknowledge the Coordination for the Improvement of Higher Education Personnel – CAPES and the PPGEQ/UFSCar for the research support.
References
- Adamson, A. W. , and J. Klerer . 1977. Physical chemistry of surfaces. J. Electrochem. Soc. 124 (5):192C. doi:https://doi.org/10.1149/1.2133374.
- Amaral, S. S. , J. A. Carvalho , M. A. M. Costa , and C. Pinheiro . 2016. Particulate matter emission factors for biomass combustion. Atmosphere 7 (11):141.
- Barthel, E. 2008. Adhesive elastic contacts: JKR and more. J. Phys. D: Appl. Phys. 41 (16):163001. doi:https://doi.org/10.1088/0022-3727/41/16/163001.
- Le Blond, J. S. , S. Woskie , C. J. Horwell , and B. J. Williamson . 2017. Particulate matter produced during commercial sugarcane harvesting and processing: A respiratory health hazard? Atmos. Environ . 149:34–46. doi:https://doi.org/10.1016/j.atmosenv.2016.11.012.
- Booth, S. W. , and J. M. Newton . 1987. Experimental investigation of adhesion between powders and surfaces. J. Pharm. Pharmacol. 39 (9):679–684. doi:https://doi.org/10.1111/j.2042-7158.1987.tb06969.x.
- Brandrup, J. , E. H. Immergut , and E. A. Grulke . 1999. Polymer handbook . 4rd ed. Wiley.
- Cheng, W. , P. F. Dunn , and R. M. Brach . 2002. Surface roughness effects on microparticle adhesion. Journal Adhesion 78 (11):929–965. doi:https://doi.org/10.1080/00218460214510.
- Ciavarella, M. , J. Joe , A. Papangelo , and J. R. Barber . 2019. The role of adhesion in contact mechanics. J. R. Soc. Interface 16 (151):20180738. doi:https://doi.org/10.1098/rsif.2018.0738.
- Derjaguin, B. , V. Muller , and Y. Toporov . 1975. Effect of contact deformations on the adhesion of particles. J. Colloid Interface Sci . 53 (2):314–326. doi:https://doi.org/10.1016/0021-9797(75)90018-1.
- Egermann, H. 1980. Effects of adhesion on mixing homogeneity part I: Ordered adhesion—random adhesion. Powder Technol. 27 (2):203–206. doi:https://doi.org/10.1016/0032-5910(80)85023-6.
- Felicetti, M. A. , F. Piantino , J. R. Coury , and M. L. Aguiar . 2008. Influence of removal time and particle size on the particle substrate adhesion force. Braz. J. Chem. Eng. 25 (1):71–82. doi:https://doi.org/10.1590/S0104-66322008000100009.
- Felicetti, M. A. , G. R. Salazar-Banda , J. R. Coury , and M. L. Aguiar . 2009. Influence of particle size, applied compression, and substratum material on particle − surface adhesion force using the centrifuge technique. Ind. Eng. Chem. Res. 48 (2):877–887. doi:https://doi.org/10.1021/ie071506u.
- Fillingham, P. , K. Kottapalli , X. Zhan , and I. V. Novosselov . 2019. Characterization of adhesion force in aerodynamic particle resuspension. J. Aerosol Sci . 128:89–98. doi:https://doi.org/10.1016/j.jaerosci.2018.11.006.
- Glass, A. S. , and J. W. Larsen . 1994. Coal surface properties. specific and nonspecific interactions for polar molecules and surface tensions for hydrocarbons at the surface of illinois no. 6 coal. Energy Fuels 8 (3):629–636. doi:https://doi.org/10.1021/ef00045a018.
- Götzinger, M. , and W. Peukert . 2003. Dispersive forces of particle–surface interactions: Direct AFM measurements and modelling. Powder Technol. 130 (1–3):102–109. doi:https://doi.org/10.1016/S0032-5910(02)00234-6.
- Hamaker, H. C. 1937. The London—van Der Waals attraction between spherical particles. Physica 4 (10):1058–1072. doi:https://doi.org/10.1016/S0031-8914(37)80203-7.
- Imran, M. , and A. R. Anwar Khan . 2018. Characterization of agricultural waste sugarcane bagasse ash at 1100 °C with various hours. In Materials Today: Proceedings 5 (2):3346–3352. doi:https://doi.org/10.1016/j.matpr.2017.11.577.
- Israelachvili, J. 2011. Intermolecular and surface forces. Intermolecular and surface forces . USA: Academic Press. doi:https://doi.org/10.1016/C2011-0-05119-0
- James, J. , and P. K. Pandian . 2017. A short review on the valorisation of sugarcane bagasse ash in the manufacture of stabilized/sintered earth blocks and tiles. Adv. Mater. Sci. Eng . 2017:1–15. doi:https://doi.org/10.1155/2017/1706893.
- Johnson, K. L. , L. K. Kendal , and A. D. Roberts . 1971. Surface energy and the contact of elastic solids. Proc. R. Soc. Lond. A 324 (1558):301–313. doi:https://doi.org/10.1098/rspa.1971.0141.
- Karmouch, R. , and H. E. Hor . 2017. Solar cells performance reduction under the effect of dust in Jazan Region. J. Fundam. Renewable Energy Appl . 07 (02):1–4. doi:https://doi.org/10.4172/2090-4541.1000228.
- Kendall, K. , and C. Stainton . 2001. Adhesion and aggregation of fine particles. Powder Technol. 121 (2–3):223–229. doi:https://doi.org/10.1016/S0032-5910(01)00386-2.
- Lam, K. K. , and J. M. Newton . 1991. Investigation of applied compression on the adhesion of powders to a substrate surface. Powder Technol. 65 (1–3):167–175. doi:https://doi.org/10.1016/0032-5910(91)80179-M.
- Lam, K. K. , and J. M. Newton . 1992. Influence of particle size on the adhesion behaviour of powders, after application of an initial press-on force. Powder Technol. 73 (2):117–125. doi:https://doi.org/10.1016/0032-5910(92)80072-5.
- Lam, K. K. , and J. M. Newton . 1993. The influence of the time of application of contact pressure onparticle adhesion to a substrate surface. Powder Technol. 76 (2):149–154. doi:https://doi.org/10.1016/S0032-5910(05)80022-1.
- Marti, O. 2000. Measurement of adhesion and pull-off forces with the AFM. In Modern tribology Handbook: Volume one: Principles of tribology . Boca Raton, FL: CRC Press. http://www.crcnetbase.com/doi/abs/10.1201/9780849377877.ch17.
- Moeller, R.-S. , and H. Nirschl . 2017. Adhesion and cleanability of surfaces in the baker’s trade. J. Food Eng . 194:99–108. doi:https://doi.org/10.1016/j.jfoodeng.2016.09.012.
- Nguyen, T. T. , C. Rambanapasi , A. H. de Boer , H. W. Frijlink , P. M. V. D. Ven , J. de Vries , H. J. Busscher , and K. v D. V. Maarschalk . 2010. A Centrifuge method to measure particle cohesion forces to substrate surfaces: The use of a force distribution concept for data interpretation. Int. J. Pharm . 393 (1–2):89–96. doi:https://doi.org/10.1016/j.ijpharm.2010.04.016.
- Nussinovitch, A. 2017. Adhesion in foods: Fundamental principles and applications . Chichester: John Wiley & Sons, Ltd.
- Payá, J. , J. Monzó , M. V. Borrachero , L. Díaz-Pinzón , and L. M. Ordónez . 2002. Sugar-Cane Bagasse Ash (SCBA): Studies on its properties for reusing in concrete production. J. Chem. Technol. Biotechnol. 77 (3):321–325. doi:https://doi.org/10.1002/jctb.549.
- Petean, P. G. C. , and M. L. Aguiar . 2015. Determining the adhesion force between particles and rough surfaces. Powder Technol. 274 (1):67–76. doi:https://doi.org/10.1016/j.powtec.2014.12.047.
- Pietsch, W. 2004. Agglomeration in industry: Occurrence and applications . Weinheim, DE: Wiley-VCH Verlag GmbH &. Co. KGaA.
- Podczeck, F. 1998. Particle-particle adhesion in pharmaceutical powder handling . London: World Scientific Publishing Ltd. https://www.worldscientific.com/worldscibooks/10.1142/p095
- Podczeck, F. , and J. M. Newton . 1995. Development of an ultracentrifuge technique to determine the adhesion and friction properties between particles and surfaces. J. Pharm. Sci . 84 (9):1067–1071. doi:https://doi.org/10.1002/jps.2600840907.
- Podczeck, F. , J. M. Newton , and M. B. James . 1997. Influence of relative humidity of storage air on the adhesion and autoadhesion of micronized particles to particulate and compacted powder surfaces. J. Colloid Interface Sci . 187 (2):484–491. doi:https://doi.org/10.1006/jcis.1996.4684.
- Prokopovich, P. , and V. Starov . 2011. Adhesion models: From single to multiple asperity contacts. Adv. Colloid Interface Sci . 168 (1–2):210–222. doi:https://doi.org/10.1016/j.cis.2011.03.004.
- Rumpf, H. 1977. Particles adhesion. In Agglomeration 77 , ed. K. V. S. Sastra , vol. 1, 97–129. New York: American Institute of Mining, Metallurgical and Petroleum Engineers.
- Salazar-Banda, G. R. , M. A. Felicetti , J. A. S. Gonçalves , J. R. Coury , and M. L. Aguiar . 2007. Determination of the adhesion force between particles and a flat surface, using the centrifuge technique. Powder Technol. 173 (2):107–117. doi:https://doi.org/10.1016/j.powtec.2006.12.011.
- Teixeira, S. R. , A. Arenales , A. E. Souza , R. Silva Magalhães , A. F. V. Peña , D. Aquino , and R. Freire . 2015. Sugarcane bagasse: Applications for energy production and ceramic materials. J. Solid Waste Technol. Mngmnt . 41 (3):229–238. doi:https://doi.org/10.5276/JSWTM.2015.229.
- Tighe, B. J. , and A. Mann . 2011. Adhesives and interfacial phenomena in wound healing. In Advanced Wound Repair Therapies , 247–83. Sawston, Cambridge: Woodhead Pub. Ltd.
- Torres Agredo, J. , R. M. de Gutiérrez , C. E. Escandón Giraldo , and L. O. González Salcedo . 2014. Characterization of sugar cane bagasse ash as supplementary material for portland cement. Inginv. 34 (1):5–10. doi:https://doi.org/10.15446/ing.investig.v34n1.42787.
- Ulusoy, U. 2008. Application of ANOVA to image analysis results of talc particles produced by different milling. Powder Technol. 188 (2):133–138. doi:https://doi.org/10.1016/j.powtec.2008.04.036.
- Wu, S. 2017. Polymer interface and adhesion . New York: Routledge. https://www.taylorfrancis.com/books/9781351423533.
- Zafar, U. , C. Hare , A. Hassanpour , and M. Ghadiri . 2014. Drop test: A new method to measure the particle adhesion force. Powder Technol. 264:236–241. doi:https://doi.org/10.1016/j.powtec.2014.04.022.
- Zimon, A. D. 1982. Adhesion of dust and powder. 2nd ed. New York: Consultants Bureau.