
 ?Mathematical formulae have been encoded as MathML and are displayed in this HTML version using MathJax in order to improve their display. Uncheck the box to turn MathJax off. This feature requires Javascript. Click on a formula to zoom.
Abstract
The current study investigates the nonvolatile particle number emissions of three bi-fuel passenger cars (Euro 6b, 6d-temp), which operate on compressed natural gas (CNG), as a primary fuel, and gasoline as a secondary one. The CNG fuel was injected into the engine using port fuel injection (PFI) while the gasoline fuel was either by PFI or by direct injection (GDI). A novel exhaust gas sampling and dilution system was employed for the determination of solid particle number (SPN) emissions at 10 nm (SPN>10nm) and 2.5 nm (SPN>2.5 nm). The vehicles were tested in the laboratory over different test cycles where the CNG solid particle number emissions greater than 23 nm (SPN>23nm) were an order of magnitude lower than GDI and PFI gasoline emissions. However, when the size threshold was lowered to 10 nm or 2.5 nm, emissions were similar for both fuels. Particularly, SPN>2.5 nm emissions of the Euro 6 b vehicle exceeded the Euro 6 emission standard for both fuels while the SPN>23nm emissions were between 40 and 2.8 times lower than the limit for CNG and gasoline, respectively. Particle size distributions show a significant number of particles reside below the regulated limit of 23 nm, even lower than 10 nm. The results have significant implications in setting a particle number limit for alternative fuel vehicles while indicating that the current size threshold (23 nm) is insufficient for particle emission testing.
Copyright © 2020 American Association for Aerosol Research
EDITOR:
1. Introduction
The adverse effects of air pollution on human health are well recognized, with 0.4 and 7 million annual premature deaths caused by air pollution in the European Union (EU) and the world, respectively (Guerreiro, de Leeuw, and Ortiz Citation2015)(WHO. 2012). Particle emissions from vehicles comprise a large share of air quality deterioration in European cities. Road transport contributes 11% of total emissions of particulate matter (PM) with aerodynamic size up to 2.5 μm (PM2.5) and 28% of black carbon (BC) (Guerreiro, de Leeuw, and Ortiz Citation2015). In particular, ultrafine particles below 100 nm in size have received separate attention, owed to their high mobility and penetration within the body (Miller et al. Citation2017). Road transport contributes almost up to 90% of the total emissions of such ultrafine particles (Pey et al. Citation2009; Kumar et al. Citation2010). This contribution comes both from exhaust and non-exhaust sources (brake or tyre wear emissions) with the contribution of the latter becoming increasingly important for the ultrafine mode as exhaust ultrafine particle emissions drop (Mathissen et al. Citation2011; Vouitsis et al. Citation2017; Samaras et al. 2020). The need to improve air quality, in particular in terms of airborne particle concentrations, imposes ambitious goals in vehicular combustion efficiency and exhaust emissions reduction.
The latest innovative fuel combustion technologies such as bi-fuel compressed natural gas (CNG) engines have entered the market to tackle air pollution, enhance fuel efficiency, and decrease carbon emissions. The market penetration of bi-fuel CNG passenger cars has recently increased. In 2018, new registrations of CNG passenger cars increased by 31% compared to 2017 representing 0.4% of the total new vehicle sales (European Automobile Manufacturers Association (ACEA) 2019), with forecasts to 2030 projecting a total CNG fleet of more than 10 million cars (NGVA-Europe Citation2018). The competitive lower pump price of CNG in comparison to liquid fuels (NGVA-Europe Citation2018) together with its positive contribution to market-average CO2 emissions targets (Cachón, Tóth, and Pucher Citation2009; Paul and Owen Citation2014) are the main drivers of this distinct market penetration.
Gaseous emissions of CNG cars have been studied in some detail (Chen, He, and Zhong Citation2019; Jahirul et al. Citation2010; Yusaf et al. Citation2010). The emission levels of gaseous pollutants with CNG are generally lower for CO2 and CO and higher for NOx when compared to gasoline (Dimaratos et al. Citation2019). With regard to particulate emissions, a Euro 6 CNG vehicle in real drive emissions (RDE) testing exhibited, Solid Particle Number (SPN) emissions greater than 23 nm (SPN>23nm), that were as low as a diesel particle filter (DPF) equipped vehicle (Kontses et al. Citation2020). Similarly, low (<1010p/km) SPN>23nm levels were also observed by (Giechaskiel, Lähde, et al. Citation2019) on a medium-sized Euro 6 CNG car. Both these last two studies demonstrated that CNG SPN>23nm emissions are by an order of magnitude lower than gasoline both in RDE (Kontses et al. Citation2020) and laboratory (Giechaskiel, Lähde, et al. Citation2019) testing.
Similar results were also reported from older research work with tests on Euro 4 (Schreiber et al. Citation2007) and Euro 5 (Magara-Gomez et al. Citation2014) CNG passenger vehicles. Those earlier results were obtained in the laboratory over steady state operation or outdated driving cycles (NEDC) (Schreiber et al. Citation2007), utilizing constant volume sampling (CVS) to collect particles (Schreiber et al. Citation2007; Magara-Gomez et al. Citation2014; Giechaskiel, Lähde, et al. Citation2019) in most of the cases. CVS is prone to small particle formation artifacts or can lead to a measurement bias of the PSD (Louis et al. Citation2017; Giechaskiel Citation2019a; Giechaskiel Citation2019b). As a result, high particle losses from tailpipe to CVS (Giechaskiel, Lähde, et al. Citation2019). The minimization of particle losses is of paramount importance when the measurement goal is the accurate determination of particle emissions below 23 nm.
The SPN size threshold of 23 nm is the current EU cutoff size for positive and compression ignition direct injection (DI) engines under the Euro 6 emission standard. Although total particulate mass emissions from vehicles have decreased over the years, a large fraction of them is located in the region below 10 nm. For GDI vehicles, the GMD has dropped from 70 nm (Euro 2) to less than 30 nm (Euro 6) (Giechaskiel, Joshi, et al. Citation2019). For Euro 6 CNG vehicles, the GMD appears below 25 nm (Giechaskiel, Lähde, et al. Citation2019). In addition, studies from experimental optical bi-fuel engines (Catapano et al. Citation2017; Nithyanandan et al. Citation2016) suggest higher numbers of nanoparticles (<50 nm) in CNG rather than gasoline operation. In this context, the current work aims to investigate the nonvolatile emissions of the latest technology CNG passenger cars, extending the particle size range down to 2.5 nm. To achieve this, a novel raw exhaust sampling system with enhanced separation of solid particles and limited nanoparticle losses was utilized. The results aim to provide an assessment of the impacts of alternative fuels on vehicle emissions and inform the next generation of emission standards and control.
2. Methodology
2.1. Test vehicle and test protocol
Three latest technology (one Euro 6b and two Euro 6d-temp) CNG and gasoline bi-fuel passenger cars equipped with a three-way catalyst (TWC) without particulate filter (PF) and operating stoichiometrically were tested in the current study (). In all cases, the CNG fuel feed was achieved by port fuel injection (PFI). When CNG was depleted, a gasoline fuel feed was initiated. This was of direct injection (GDI) type except from the Segment A vehicle, which utilized port fuel injection (PFI). No simultaneous use of the two fuels was possible in any of the vehicles. In our measurements, this was confirmed by monitoring the relevant fuel use information (fuel type) with on-board diagnostics (OBD). presents the characteristics of the test vehicles, distinguished by market segment as indicative of the overall size and specifications of the vehicles selected.
Table 1. Test vehicle characteristics.
Tests were performed on a chassis dynamometer using real-world road load settings, which were determined by an on-road coast-down test. In order to cover an extensive engine operation, the test protocol comprised the current and previous type approval driving cycles (Worldwide Harmonized Light Vehicle Test Cycle - WLTC and New European Driving Cycle -NEDC) as well as non-regulated ones such as ERMES, Artemis, simulated RDE and steady-state operating points at 80 km/h. Tests were first conducted with the CNG fuel, as this was the primary fuel. No on-demand selection of fuels was possible for testing. Following CNG depletion, each vehicle automatically switched to back-up gasoline operation. Any auxiliary device including the Start/Stop system was deactivated during the tests.
2.2. Measurement set-up
The dilution and sampling system used for exhaust particle number measurements is shown in . The sampling system was developed in the framework of the EU DownToTen project (in short: DTT) and can be used both for raw exhaust measurements in the tailpipe and for diluted aerosol sampling following a primary dilution in the CVS. In the current work, raw tailpipe sampling was conducted.
Figure 1. Chassis dynamometer measurement layout with the sampling system at the exhaust tailpipe. An AVL PN PEMS (SPN>23nm) was in parallel connected to the tailpipe. Notes: MFC: Mass Flow Controller, VPR: Volatile Particle Remover, ED: Ejector Diluter.
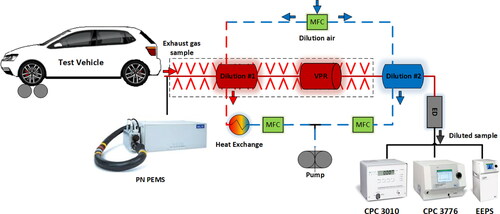
The DTT sampling system consists of two porous tube dilutors in series. The first dilutor is heated (wall temperature at 350 °C with hot dilution air at 200 °C) and is followed by a catalytic stripper (CS) at 350 °C wall temperature, used to separate nonvolatile particles. The second dilutor is not heated and operates with dilution air at ambient temperature. Dilution ratios in both dilutors are adjustable in the order of 10:1 per stage. In case that particle concentrations need to be further reduced prior to measurement, a third dilution stage utilizing an ejector dilutor (ED) can be used. In the current study, measurements with EEPS were tested under a third dilution stage of ED.
In the context of this work, we refer to nonvolatile particle numbers with a 50% cutpoint at 23 nm as defined in the regulations, as solid particles above 23 nm or, in short, SPN>23nm. By extending this notion to smaller particle sizes, one can define solid particles above 2.5 nm (SPN>2.5 nm) or above 10 nm (SPN>10nm), determined with the different instruments, following the catalytic stripper treatment.
The particle number (PN) emission was measured in transient testing by a condensation Particle Counter (CPC) with a size cutoff at 2.5 nm (TSI CPC 3776) and a second one placed in parallel with a size cutoff at 10 nm (TSI CPC 3010). An Engine Exhaust Particle Sizer (EEPS - TSI 3090) was also used to obtain PSD in size range 5.6 − 560 nm in real-time. Α Scanning Mobility Particle Sizer (SMPS - TSI 3936 N) was also employed to acquire PSDs in size range 2.5 − 150 nm under steady-state operation. A commercial, RDE and PMP compliant PN Portable Emission Measurement System (PN PEMS), based on diffusion charging, was placed in parallel to the DTT system for the determination of nonvolatile particles counts according to regulatory (Regulation 2017/1151) provisions (SPN>23nm). The system includes a two stage temperature-controlled exhaust gas dilution system and a Volatile Particle Remover (VPR) (evaporation tube and catalytic stripper) prior to the diffusion charging sensor unit. The specifications of the instruments utilized are shown in .
The DTT system aims at improving the sampling of nonvolatile particles of smaller sizes than current regulations prescribe (23 nm). Current commercial systems are known to induce high uncertainty in sub-23 nm particle measurements due to high losses and possible inefficiencies of the current evaporator-type VPRs (Giechaskiel and Martini Citation2014). Porous tube dilutors have an excellent performance in decreasing wall losses (Ntziachristos and Samaras Citation2010; Lyyränen et al. Citation2004). Using a porous tube dilutor as the ambient temperature dilutor can also limit total thermophoretic losses to less than 5% in all size ranges. The CS, which is the primary source of diffusional losses, was optimized in the course of the DTT project, while volatile artifact formation of the whole system was negligible for typical exhaust sulfate concentrations (Bainschab et al. Citation2017). Total emissions were corrected for particle losses. Loss correction was based on a size-dependent curve at the range of 10% for SPN>23nm, 30% in the 10-23 nm region, and 60-70% for particles <10 nm (Bainschab et al. Citation2017).
The DR of the system may be affected by pressure and temperature fluctuations of the exhaust gas at the tailpipe sampling point. For this reason, the DR was monitored with CO2 concentrations at the raw exhaust and after DTT sampling system dilution. A typical total DR configuration for the DTT sampling system was in the order of 100:1 (15:1). This range of DR was selected to be as high as possible but to provide particle concentrations within the range of available instrumentation, in particular of the EEPS. All results presented in the following sections are corrected for dilution ratio (DR), CPC coincidence, and sampling system particle losses.
3. Results and discussion
The aggregated results for SPN emissions of different size ranges are shown in . SPN>23nm emissions determined with the commercial PN PEMS are below the current Euro 6 limit (6 × 10¹¹ p/km), with CNG being on average 90% lower than gasoline in both the Euro 6b and 6d-temp vehicles. A similar difference of SPN>23nm emissions between fuels was also observed by other researchers who compared CNG and GDI passenger cars of similar engine displacement (Giechaskiel, Lähde, et al. Citation2019). When the size threshold is set at 10 nm or lower, the particle emissions comparison between the two fuels changes significantly for the Euro 6b Segment C and Euro 6d-temp Segment A vehicles, with SPN>10nm being at almost the same level for both fuels. This is despite the fact that combustion takes place with gasoline either under GDI or PFI mode and CNG only under PFI mode. With regard to the Segment B Euro 6d-temp vehicle, gasoline SPN>10nm emissions were, on average, 20 times higher than CNG but were kept below the SPN>23nm limit in almost all cases except over the WLTC cold. Even though Segment A and B vehicles have the same engine displacement and overall specifications, engine design and calibration seem to have a substantial effect on sub-23 nm particle emissions when comparing emissions from these two vehicles. Hence, a different particle emission performance can be seen for the two Euro 6d-temp vehicles.
Figure 2. Aggregated SPN emissions for gasoline (light yellow background) and CNG (light green background). Error bars show the standard error of the mean, including 2 to 4 repetitions. Emission bars with no error bar indicating a unique measurement.
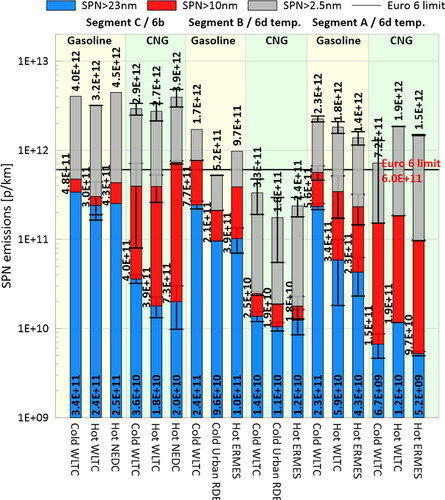
It should be mentioned that the SPN>23nm limit is not applicable to PFI vehicles. Hence the comparison of CNG emissions with the limit level is only to provide a frame of reference. When the complete particle size range down to 2.5 nm or even down to 10 nm is considered, emission levels are found to be above the SPN>23nm limit in almost all cases. In particular, SPN>2.5 nm emissions, are an order of magnitude higher than the SPN>23nm limit level for both fuels except the “cleaner” Euro 6d-temp Segment B vehicle.
Observed nanosized particles can only be of nonvolatile nature as we have used a CS in our sampling system (Amanatidis et al. Citation2013; Khalek and Bougher Citation2011; Melas et al. Citation2020). Such very small nonvolatile particles are often termed as ‘core mode’ particles and have been associated with lube-oil ash content (Rönkkö et al. Citation2007; De Filippo and Matti Maricq Citation2008; Raza et al. Citation2018; Mayer et al. Citation2010). In the case of the CNG operation, those core mode particles appear much more pronounced in number than in gasoline operation, and hence elevated SPN>2.5 nm, and SPN>10nm can be seen. The existence of such core mode particles was consistently observed in our experiments in all the three vehicles during CNG operation.
The total particle emission levels relative to the current regulation limit are depicted in . It is repeated that the current SPN>23nm limit is not applicable for PFI vehicles (either Gasoline or CNG) and is only used here to provide a frame of reference. The results are from various test cycles (NEDC, WLTC, SRC, Artemis, ERMES, in-lab replicated RDE, and steady speed tests) under different test conditions (Hot or Cold). With non-hatched and hatched triangles are the CNG SPN>10nm and SPN>2.5 nm results, respectively. The same indicators are also for the GDI (Segment B and C) and PFI (Segment A) gasoline results (in squares). Focusing on the SPN>10nm emissions of Euro 6b Segment C vehicle during hot start testing with Gasoline (GDI), those are located at the top right of the green area where the limit is not exceeded even when including particles as small as 10 nm. In addition, GDI levels are very close to the centerline, which indicates that emissions of SPN>10nm are almost identical with SPN>23nm, an observation also confirmed from the aggregated results in . Regarding the Euro 6d-temp SPN>10nm emission levels, these span over a greater range than the Euro 6b ones. There are both cold and hot start cases, where SPN>10nm emissions are beyond the Euro 6 limit while the SPN>23nm are within limits (area II). When sizes down to 2.5 nm are considered, particle emissions are beyond the Euro 6 limit in almost all cases, with SPN>2.5 nm emissions being an order of magnitude higher than SPN>10nm. SPN>2.5 nm emission performance indicates that even in the case of “cleaner” Euro 6d-temp vehicles, there are conditions that the current limit (6 × 10¹¹ part./km) could be no more satisfied in the case of a future regulation that counts PN with particle size below 23 nm.
Figure 3. SPN emission results with respect to the particle limit level. Horizontal axis: Relative emissions of SPN>23nm over limit level. Vertical axis: Relative emissions of SPN>10nm or SPN>2.5 nm over limit level. Left-side graphs refer to Euro 6b, right-hand graphs refer to Euro6d-temp vehicles. Triangle marks refer to CNG, and square ones refer to gasoline. Each color represents a different vehicle segment, while hatched and non-hatched symbols represent SPN>2.5 nm and SPN>10nm, respectively.
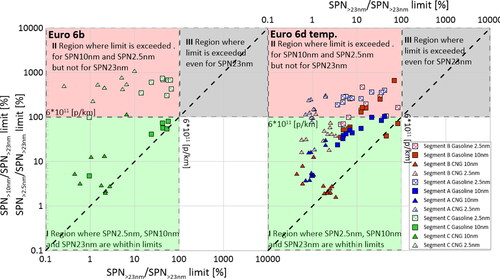
CNG SPN emission behavior is different from gasoline. In particular, CNG SPN>10nm emission results are away from the centerline, indicating higher emissions of SPN>10nm than SPN>23nm. In some cases, SPN>10nm results exceed the current regulation limit, while when extending to the SPN>2.5 nm size range, almost all the data fall within the red area II. On the other hand, even in the worst case, none of the SPN>23m emissions results exceed the current limit. Hence no data can be found in region ΙΙΙ, where the limit would be exceeded even for SPN>23m.
It is clear from that the particle cutoff size considered in the regulation is decisive in terms of which emission control technologies can fulfill type approval requirements when the particle number limit is fixed. For example, the Euro 6b Segment C vehicle would fulfill type-approval requirements with both fuels (CNG and gasoline) even if the size cutoff was extended down to 10 nm in the regulations. However, the vehicle would be above the limit even when operating on CNG, if the cutoff threshold was decreased to 2.5 nm.
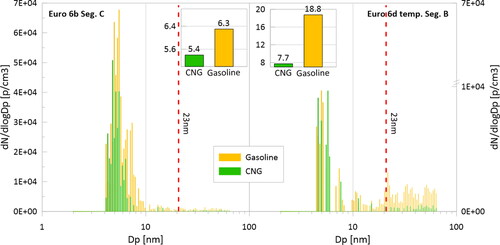
PSDs measured with the EEPS for both fuels use are illustrated in . The distributions depicted correspond to average PSD profiles during WLTC hot measurements, as a representative example of transient testing.
Figure 4. Average PSD profiles recorded with EEPS during WLTC Hot testing. Levels within the red area are considered to be below the instrument sensitivity. Left: Euro 6 b Segment C vehicle; Right: Segment A and B Euro 6d-temp vehicles.
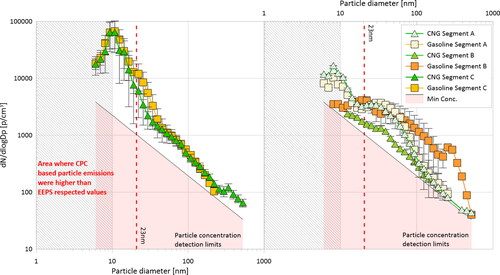
With regard to the Segment C vehicle, the size distribution profiles are similar for the two fuels but with one pronounced difference in the range of 23 nm (±5nm), where the average particle concentration with CNG is lower than with gasoline. However, in the 5.6 nm-23nm range, the size distributions are almost the same. The shape of the distribution results in a GMD of 23 nm with CNG compared to 34 nm with gasoline. All results should be interpreted with care in the size range below 10 nm, where a significant drop in concentration appears. This drop should rather be associated with the decreased sensitivity and algorithmic correction of the EEPS instrument (IM-Soot). This has been shown to underpredict particle concentrations in the sub-10nm, as shown with gasoline and diesel exhaust under steady state conditions (Wang et al. Citation2016; Zimmerman et al. Citation2014). Hence the sub-10nm region (dashed area in ) should not be taken into consideration to compare fuel effects. However, the EEPS distributions are useful to obtain an understanding of particle size over transient testing.
In order to check fuel effects on PSD with a more sensitive instrument than EEPS for small particle sizes, presents the PSD and the respective GMD at 80 km/h steady speed testing, as an average of three repetitions with each fuel using a nano-DMA (2.5 − 150 nm) SMPS. Similar to WLTC, a smaller GMD is observed with CNG operation compared to gasoline. The peak concentration is actually below 10 nm for both fuels, which indicates that even with a 10 nm size cutoff, almost 80% of the particle number would be below this. A considerable portion of particle number resided in the sub-10nm region in several other studies of CNG emissions (Hajbabaei et al. Citation2013; Alanen et al. Citation2015).
Figure 5. Particle size distribution for both fuels under steady state operation at 80 km/h. Measurements were performed with SMPS nano-DMA with three repetitions for each vehicle and fuel combination. The upper right sub-graph presents the average GMD for each fuel.
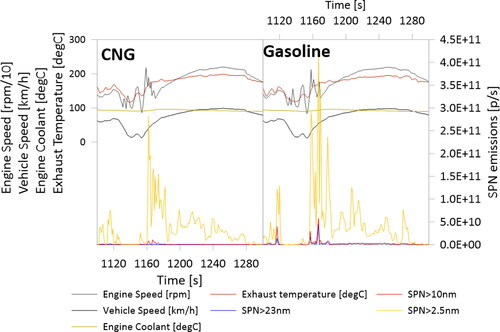
presents a snapshot of the instantaneous, SPN>23nm, SPN>10nm, and SPN>2.5 nm emissions during a cold WLTC for the Euro6b vehicle to better understand what conditions favor the formation of particles in each size range during typical transient operation events. The figure shows a sequence of an acceleration event followed by a deceleration during the so-called ‘High’ sub-cycle of the WLTC. SPN>23nm emission rate is only visible with gasoline operation in the range of 1100s-1300s, but there are hardly any visible SPN>23nm emissions with CNG. The SPN>10nm emission rate also seems consistent with SPN>23nm for both fuels. However, when particles down to 2.5 nm are considered, both fuels exhibit around eight times higher SPN>2.5 nm emissions compared to SPN>23nm and SPN>10nm. Nonvolatile sub-23nm particle emissions were observed from other researchers during deceleration phases of GDI passenger vehicles or heavy-duty CNGs, and the nature of such particles was suggested to be ash from lubricants (Karjalainen et al. Citation2014; Rönkkö et al. Citation2014; Napolitano et al. Citation2019). In the cases shown in , the particle number peaks are mostly associated with accelerations, so it cannot be concluded whether these come from lube oil ash or combustion. The vehicles of the current study had low mileage. Hence lube oil consumption is expected to be at normal levels.
Figure 6. Instantaneous SPN>2.5 nm emissions of CNG and gasoline engine operation of the Euro 6 b Segment C vehicle during an excerpt of cold WLTC.
A general overview of particle emissions with respect to engine operation is depicted in , which provides associations of particle emissions with engine performance parameters for the Euro 6b Segment C vehicle during a hot WLTC. Panel I show the relation of GMD with engine load. The particle GMD is positively correlated with engine load when using gasoline but is rather insensitive to load changes when using CNG. The increase in particle size around 0% load comes as a consequence of a drop in the core-mode at low fueling conditions. Τhe increase of size with load is most probably a consequence of the higher carbon content in the combustion zone as load increases that later agglomerates to form larger particles. Fuel impingement on the walls cannot be excluded as a mechanism responsible for increased particle size observations (He, Ratcliff, and Zigler Citation2012). Fuel impingement on the walls may lead to pool fire events, which in turn lead to significant soot particle concentration increases. In such cases, though, the expected degree of increase would be higher than what observed in our measurements (Shen et al. Citation2016). No similar behavior is observed with CNG (PFI), probably as the lower carbon content of CNG compared to gasoline is unable to promote soot particle formation, while its gaseous nature and PFI feeding eliminates the possibility of wall wetting and over-rich fuel air mixture zones.
Figure 7. Particle emission performance with respect to engine operational characteristics of the Segment C vehicle as an example.
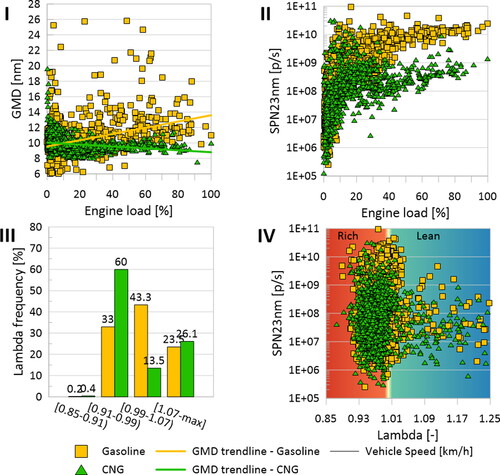
Panel (II) of shows the SPN>23nm emissions versus engine load. The yellow squares and green triangles are the Gasoline and CNG operating points during a WLTC, respectively. The increase in SPN>23nm and the corresponding increase in mean particle size with the load when using gasoline is consistent with the in-cylinder carbon content increase as fueling increases with load. A similar increase in soot emissions with load was also observed by (He, Ratcliff, and Zigler Citation2012), who investigated the effect of the start of injection (SOI) on PN emissions produced from a GDI engine. Early SOI that corresponds to a higher amount of injected fuel and higher engine load shows a strong correlation with PN. Early SOI results in liquid impingement on the piston bowl that promotes fuel-rich zones and results in high soot concentration. However, when using CNG, there is hardly any increase in soot emissions with the load; actually, the GMD seems to drop as load increases. The previous results in a significant difference in emissions, even on the same engine as load increases when using two different fuels.
In the lower right panel graph (IV), the SPN>23nm emissions with Gasoline and CNG are depicted with respect to the lambda. Even though the engine seems to be tuned toward richer mixtures under CNG operation, this does not seem to have a negative effect on PN emission. Rich mixtures under gasoline operation are often observed to have a positive correlation with a large number of particles (Braisher, Stone, and Price Citation2010). The richer operation of CNG in comparison to gasoline is clearly visible in the lower left panel-graph (III), where the frequency distribution of lambda is depicted per fuel. The fact that CNG operates in a richer mixture has to do with the conversion efficiency of CH4 in a three-way catalyst, which is optimized in a very narrow, less than stoichiometric, window (Ferri, Elsener, and Kröcher Citation2018; Dimaratos et al. Citation2020).
4. Discussion and conclusions
The current study provides an insight into the particle emission performance of three market available (Euro 6b and Euro 6d-temp) CNG/gasoline vehicles. Measurements of nonvolatile particles were conducted utilizing the H2020 DownToTen sampling system that offers low particle losses and a stable dilution ratio (100 ± 10). Nonvolatile particles were separated by a catalytic stripper to avoid volatile particle artifacts.
Findings from this work indicate that the current 23 nm cutoff size for particle emission testing may lead to wrong interpretations of total particle emissions, in particular when CNG vehicles are involved in any emissions assessment. Results reveal that SPN>23nm emissions using CNG are an order of magnitude lower than use of gasoline in either GDI or PFI operation. However, by decreasing the size threshold to 10 nm or 2.5 nm, the SPN difference between the two fuels is diminished in almost all cases. In particular, both transient and steady-state tests revealed that average SPN>23nm emissions represented only 43% of SPN>10nm and 8% of SPN>2.5 nm during gasoline and 7% of SPN>10nm and 1% of SPN>2.5 nm during CNG operation respectively. Evidence has shown that sub-23nm emission performance from fuel injection technologies such as PFI, that do not require to comply with particle emission testing, was similar to that of GDI.
Selecting a threshold has significant repercussions on the applicable size limit. With the current size threshold at 23 nm, gasoline SPN>23nm emissions were on average at 50% of the currently applicable limit (6 × 10¹¹ part./km), while CNG SPN>23nm emissions levels were at 4% of the limit. If the threshold decreased to 10 nm, then CNG and gasoline emissions would be at similar levels, at approximately 90% (±25%) of the 6 × 10¹¹ part./km limit. This limit would already become critical under certain conditions. If the threshold would decrease to 2.5 nm, emission levels would be up to 7.5 and 6.5 times higher than the limit for gasoline and CNG operation, respectively.
Results suggest that irrespective of the fuel use (CNG or gasoline) or fueling technology (GDI or PFI), a significant number of particles was found in the sub-23nm size range, especially in cold start operation. It seems necessary that future PN regulation framework should cover all combustion technologies and fuel types, including PFIs and CNGs. In that case, a size threshold at 23 nm seems insufficient to sample the majority of particles, especially in the case of CNG. Extending to 10 nm would be an improvement but SPN>2.5 nm emissions were found up to an order of magnitude higher than SPN>10nm, so an even lower threshold may need to be considered. Nonetheless, possibilities with engine and after treatment technology to comply with stringent limits seem already currently available. Measurements from a Euro 6d-temp CNG vehicle revealed SPN>2.5 nm levels below the current regulation limit in almost all test cycles, even without the use of a particle filter in the exhaust line. Hence, such comprehensive regulation should be developed to enforce the development of such truly clean engine technologies.
Table 2. Technical characteristics of particle detection instrumentation.
| Abbreviations | ||
| CNG | = | Compressed Natural Gas |
| CPC | = | Condensation Particle Counter |
| CS | = | Catalytic stripper |
| CVS | = | Constant Volume Sampling |
| DI | = | Direct Injection |
| DMA | = | Differential Mobility Analyzer |
| ECU | = | Electronic control unit |
| ED | = | Ejector diluter |
| EEPS | = | Engine Exhaust Particle Sizer |
| GDI | = | Gasoline Direct Injection |
| GMD | = | Geometric mean diameter |
| PF | = | Gasoline particulate filter |
| NEDC | = | New European driving cycle |
| OBD | = | On Board Diagnostics |
| PEMS | = | Portable emission measurement system |
| PFI | = | Port Fuel Injection |
| PMP | = | Particle measurement programme |
| PSD | = | Particle size distribution |
| SPN | = | Solid Particle Number |
| SRC | = | Standard Road Cycle |
| TWC | = | Three-way catalyst |
| WLTC | = | Worldwide harmonized Light vehicles Test Cycles |
Disclosure statement
The authors declare that there is not any conflict of interest with this work.
Additional information
Funding
References
- Alanen, J., E. Saukko, K. Lehtoranta, T. Murtonen, H. Timonen, R. Hillamo, P. Karjalainen, H. Kuuluvainen, J. Harra, J. Keskinen, et al. 2015. The formation and physical properties of the particle emissions from a natural gas engine. Fuel 162 (December):155–61. doi:https://doi.org/10.1016/j.fuel.2015.09.003.
- Amanatidis, S., L. Ntziachristos, B. Giechaskiel, D. Katsaounis, Z. Samaras, and A. Bergmann. 2013. Evaluation of an oxidation catalyst (‘catalytic Stripper’) in eliminating volatile material from combustion aerosol. J. Aerosol Sci. 57:144–55. doi:https://doi.org/10.1016/j.jaerosci.2012.12.001.
- Bainschab, M., A. Bergmann, P. Karjalainen, J. Keskinen, J. Andersson, A. Mamakos, B. Giechaskiel, C. Haisch, O. Piacenza, L. Ntziachristos, et al. 2017. “Extending Particle Number Limits to below 23 Nm: First Results of the H2020 DownToTen Project.” In 2017 ETH-Conference on Combustion Generated Nanoparticles, 49:3644–3652.
- Braisher, M., R. Stone, and P. Price. 2010. Particle number emissions from a range of European vehicles. SAE Technical Papers, no. Ci. doi:https://doi.org/10.4271/2010-01-0786.
- Cachón, L., D. Tóth, and E. Pucher. 2009. Real-world emission measurements of a high efficient monofuel CNG light duty vehicle. SAE Technical Papers, June, 1–8. doi:https://doi.org/10.4271/2009-01-1864.
- Catapano, F., S. Di Iorio, P. Sementa, and B. M. Vaglieco. 2017. Particle formation and emissions in an optical small displacement SI engine dual fueled with CNG DI and gasoline PFI. In SAE Technical Papers. Vol. 2017. doi:https://doi.org/10.4271/2017-24-0092.
- Chen, H., J. He, and X. Zhong. 2019. Engine combustion and emission fuelled with natural gas: A review. J. Inst. Energy 92 (4):1123–36. doi:https://doi.org/10.1016/j.joei.2018.06.005.
- De Filippo, A., and M. Matti Maricq. 2008. Diesel nucleation mode particles: Semivolatile or solid? Environ. Sci. Technol. 42 (21):7957–62. doi:https://doi.org/10.1021/es8010332.
- Dimaratos, A., Z. Toumasatos, S. Doulgeris, G. Triantafyllopoulos, A. Kontses, and Z. Samaras. 2019. Assessment of CO2 and NOx emissions of one diesel and one bi-fuel gasoline/CNG Euro 6 vehicles during real-world driving and laboratory testing. Front. Mech. Eng 5 (December): 6–7. doi:https://doi.org/10.3389/fmech.2019.00062.
- Dimaratos, A., Z. Toumasatos, G. Triantafyllopoulos, A. Kontses, and Z. Samaras. 2020. Real-World Gaseous and particle emissions of a bi-fuel gasoline/CNG Euro 6 passenger car. Transportation Research Part D: Transport and Environment 82:102307. doi:https://doi.org/10.1016/j.trd.2020.102307.
- European Automobile Manufacturers Association (ACEA). 2019. Economic and Market Report EU Automotive Industry Full-Year 2018. https://www.acea.be/uploads/statistic_documents/Economic_and_Market_Report_full-year_2018.pdf.
- Ferri, D., M. Elsener, and O. Kröcher. 2018. Methane oxidation over a honeycomb Pd-only three-way catalyst under static and periodic operation. Appl. Catal, B. 220:67–77. doi:https://doi.org/10.1016/j.apcatb.2017.07.070.
- Giechaskiel, B., 2019a. Differences between tailpipe and dilution tunnel Sub-23 Nm nonvolatile (solid) particle number measurements. Aerosol Sci. Technol. 53 and 5 (9): 1012–22. doi:https://doi.org/10.1080/02786826.2019.1623378.
- Giechaskiel, B. 2019b. Effect of sampling conditions on the Sub-23 Nm nonvolatile particle emissions measurements of a moped. Appl. Sci. 9 (15):7–8. doi:https://doi.org/10.3390/app9153112.
- Giechaskiel, B., A. Joshi, L. Ntziachristos, and P. Dilara. 2019. European regulatory framework and particulate matter emissions of gasoline light-duty vehicles: A review. Catalysts 9 (7):11–12. doi:https://doi.org/10.3390/catal9070586.
- Giechaskiel, B., T. Lähde, and Y. Drossinos. 2019. Regulating particle number measurements from the tailpipe of light-duty vehicles: The next step? Environ. Res. 172 (December):1–9. doi:https://doi.org/10.1016/j.envres.2019.02.006.
- Giechaskiel, B., and G. Martini. 2014. Engine exhaust solid sub-23 Nm particles: II. Feasibility study for particle number measurement systems. SAE Int. J. Fuels Lubr. 7 (3):935–49. doi:https://doi.org/10.4271/2014-01-2832.
- Guerreiro, C., F. de Leeuw, and E. E. A. A. G. Ortiz. 2015. Air quality in Europe — 2015 report. Report. 5:23–24. doi:https://doi.org/10.2800/62459.
- Hajbabaei, M., G. Karavalakis, K. C. Johnson, L. Lee, and T. D. Durbin. 2013. Impact of natural gas fuel composition on criteria, toxic, and particle emissions from transit buses equipped with lean burn and stoichiometric engines. Energy 62:425–34. doi:https://doi.org/10.1016/j.energy.2013.09.040.
- He, X., M. A. Ratcliff, and B. T. Zigler. 2012. Effects of gasoline direct injection engine operating parameters on particle number emissions. Energy Fuels 26 (4):2014–27. doi:https://doi.org/10.1021/ef201917p.
- Jahirul, M. I., H. H. Masjuki, R. Saidur, M. A. Kalam, M. H. Jayed, and M. A. Wazed. 2010. Comparative engine performance and emission analysis of CNG and gasoline in a retrofitted car engine. Appl. Therm. Eng. 30 (14/15): 2219–26. doi:https://doi.org/10.1016/j.applthermaleng.2010.05.037.
- Karjalainen, P., L. Pirjola, J. Heikkilä, T. Lähde, T. Tzamkiozis, L. Ntziachristos, J. Keskinen, and T. Rönkkö. 2014. Exhaust particles of modern gasoline vehicles: A laboratory and an on-road study. Atmos. Environ. 97 (November): 262–70. doi:https://doi.org/10.1016/j.atmosenv.2014.08.025.
- Khalek, I., Bougher, T. 2011. Development of a solid exhaust particle number measurement system using a catalytic stripper technology. SAE International Journal of Engines. 4 (1):639–49. doi:https://doi.org/10.4271/2011-01-0635.
- Kontses, A., G. Triantafyllopoulos, L. Ntziachristos, and Z. Samaras. 2020. Particle number (PN) emissions from gasoline, diesel, LPG, CNG and hybrid-electric light-duty vehicles under real-world driving conditions. Atmos. Environ. 222:117126. doi:https://doi.org/10.1016/j.atmosenv.2019.117126.
- Kumar, P., A. Robins, S. Vardoulakis, and R. Britter. 2010. A review of the characteristics of nanoparticles in the urban atmosphere and the prospects for developing regulatory controls. Atmos. Environ. 44 (39):5035–52. doi:https://doi.org/10.1016/j.atmosenv.2010.08.016.
- Louis, C., Y. Liu, S. Martinet, B. D'Anna, A. M. Valiente, A. Boreave, B. R'Mili, P. Tassel, P. Perret, and M. André. 2017. Dilution effects on ultrafine particle emissions from Euro 5 and Euro 6 diesel and gasoline vehicles. Atmos. Environ. 169 (November):80–8. doi:https://doi.org/10.1016/j.atmosenv.2017.09.007.
- Lyyränen, J., J. Jokiniemi, E. I. Kauppinen, U. Backman, and H. Vesala. 2004. Comparison of different dilution methods for measuring diesel particle emissions. Aerosol Sci. Technol. 38 (1):12–23. doi:https://doi.org/10.1080/02786820490247579.
- Magara-Gomez, K. T., M. R. Olson, J. E. McGinnis, M. Zhang, and J. J. Schauer. 2014. Effect of ambient temperature and fuel on particle number emissions on light-duty spark-ignition vehicles. Aerosol Air Qual. Res. 14 (5):1360–71. doi:https://doi.org/10.4209/aaqr.2013.06.0183.
- Mathissen, M., V. Scheer, R. Vogt, and T. Benter. 2011. Investigation on the potential generation of ultrafine particles from the tire-road interface. Atmos. Environ. 45 (34):6172–9. doi:https://doi.org/10.1016/j.atmosenv.2011.08.032.
- Mayer, A. C., A. Ulrich, J. Czerwinski, and J. J. Mooney. 2010. Metal-oxide particles in combustion engine exhaust. SAE Technical Papers. doi:https://doi.org/10.4271/2010-01-0792.
- Melas, A. D., V. Koidi, D. Deloglou, E. Daskalos, D. Zarvalis, E. Papaioannou, and A. G. Konstandopoulos. 2020. Development and evaluation of a catalytic stripper for the measurement of solid ultrafine particle emissions from internal combustion engines. Aerosol Sci. Technol. 54 (6):704–17. doi:https://doi.org/10.1080/02786826.2020.1718061.
- Miller, M. R., J. B. Raftis, J. P. Langrish, S. G. McLean, P. Samutrtai, S. P. Connell, S. Wilson, A. T. Vesey, P. H. B. Fokkens, A. J. F. Boere, et al. 2017. Inhaled nanoparticles accumulate at sites of vascular disease. ACS Na 11 (5):4542–52. doi:https://doi.org/10.1021/acsnano.6b08551.
- Napolitano, P., C. Guido, C. Beatrice, V. Fraioli, and S. Alfuso. 2019. Particle and gaseous emissions from a heavy-duty SI gas engine over WHTC driving cycles. In. doi:https://doi.org/10.4271/2019-01-2222.
- NGVA-Europe. 2018. “Report of Activities 2017 - 2018,” January. https://www.ngva.eu/wp-content/uploads/2018/12/NGVA-Europe_Report-of-Activities-2017-2018.pdf.
- Nithyanandan, K., Y. Lin, R. Donahue, X. Meng, J. Zhang, C. Fon, and F. Lee. 2016. Characterization of soot from diesel-CNG dual-fuel combustion in a CI engine. Fuel 184 (x):145–52. doi:https://doi.org/10.1016/j.fuel.2016.06.028.
- Ntziachristos, L., and Z. Samaras. 2010. The potential of a partial-flow constant dilution ratio sampling system as a candidate for vehicle exhaust aerosol measurements Leonidas Ntziachristos. J. Air Waste Manag. Assoc. 60 (10):1223–36. doi:https://doi.org/10.3155/1047-3289.60.10.1223.
- Paul, R., and K. Owen. 2014. Automotive fuels reference book. 3rd ed. Society of Automotive Engineers. https://www.sae.org/publications/books/content/r-297/.
- Pey, J., X. Querol, A. Alastuey, S. Rodríguez, J. P. Putaud, and R. Van Dingenen. 2009. Source Apportionment of urban fine and ultra-fine particle number concentration in a Western Mediterranean City. Atmos. Environ. 43 (29):4407–15. doi:https://doi.org/10.1016/j.atmosenv.2009.05.024.
- Raza, M., L. Chen, F. Leach, and S. Ding. 2018. A review of particulate number (PN) emissions from gasoline direct injection (Gdi) engines and their control techniques. Energies 11 (6):1417. doi:https://doi.org/10.3390/en11061417.
- Rönkkö, T., L. Pirjola, L. Ntziachristos, J. Heikkilä, P. Karjalainen, R. Hillamo, and J. Keskinen. 2014. Vehicle engines produce exhaust nanoparticles even when not fueled. Environ. Sci. Technol. 48 (3):2043–50. doi:https://doi.org/10.1021/es405687m.
- Rönkkö, T., A. Virtanen, J. Kannosto, J. Keskinen, M. Lappi, and L. Pirjola. 2007. Nucleation mode particles with a nonvolatile core in the exhaust of a heavy duty diesel vehicle. Environ. Sci. Technol. 41 (18):6384–9. doi:https://doi.org/10.1021/es0705339.
- Samaras, Z. C., J. Andersson, A. Bergmann, S. Hausberger, Z. Toumasatos, J. Keskinen, C. Haisch, et al. 2020. Measuring automotive exhaust particles down to 10 Nm - ‘DownToTen’ Project. SAE Powertrains, Fuels & Lubricants Meeting 2017:1–12. doi:https://doi.org/10.4271/2020-01-2209.Abstract.
- Schreiber, D., A. M. Forss, M. Mohr, 2007. and, and P. Dimopoulos. Particle characterisation of modern CNG, gasoline and diesel passenger cars. SAE Technical Papers 2007-Septe. doi:https://doi.org/10.4271/2007-24-0123.
- Shen, M., M. Tuner, B. Johansson, P. Tunestal, and J. Pagels. 2016. Influence of injection timing on exhaust particulate matter emissions of gasoline in HCCI and PPC. In SAE Technical Papers. Vol. 2016-Oct. doi:https://doi.org/10.4271/2016-01-2300.
- Vouitsis, I., L. Ntziachristos, C. Samaras, and Z. Samaras. 2017. Particulate mass and number emission factors for road vehicles based on literature data and relevant gap filling methods. Atmos. Environ. 168:75–89. doi:https://doi.org/10.1016/j.atmosenv.2017.09.010.
- Wang, X., M. A. Grose, R. Caldow, B. L. Osmondson, J. J. Swanson, J. C. Chow, J. G. Watson, D. B. Kittelson, Y. Li, J. Xue, et al. 2016. Improvement of engine exhaust particle sizer (EEPS) size distribution measurement – II. Engine exhaust particles. J. Aerosol Sci. 92:83–94. doi:https://doi.org/10.1016/j.jaerosci.2015.11.003.
- WHO. 2012. Burden of Disease from Household Air Pollution for 2012. World Health Organization, Global Health Risks 1 (February): 1 –17. http://www.who.int/phe/health_topics/outdoorair/databases/FINAL_HAP_AAP_BoD_24March2014.pdf.
- Yusaf, T. F., D. R. Buttsworth, K. H. Saleh, and B. F. Yousif. 2010. CNG-Diesel engine performance and exhaust emission analysis with the aid of artificial neural network. Appl. Energy 87 (5): 1661–9. doi:https://doi.org/10.1016/j.apenergy.2009.10.009.
- Zimmerman, N. K. J., Godri Pollitt, C. Heon Jeong, J. M. Wang, T. Jung, J. M. Cooper, J. S. Wallace, and G. J. Evans. 2014. Comparison of three nanoparticle sizing instruments: The influence of particle morphology. Atmos. Environ. 86:140–7. doi:https://doi.org/10.1016/j.atmosenv.2013.12.023.