
 ?Mathematical formulae have been encoded as MathML and are displayed in this HTML version using MathJax in order to improve their display. Uncheck the box to turn MathJax off. This feature requires Javascript. Click on a formula to zoom.
Abstract
Air filtration to remove viruses is considered for use in the swine industry to reduce epidemic episodes in Canada. The capture efficiencies of commercially available air filters against biological particles (bioaerosols) such as viruses needs to be determined in standardized and controlled conditions such as the ones required by the ASHRAE Standard 52.2. Artificially nebulized viruses may not accurately represent the bioaerosols present in swine buildings as associated viruses are likely to be transported on dust particles. The present study seeks to develop an infectious phages - carrying dust characterized by a similar particle size distribution of bioaerosols in swine buildings. A test duct was used to challenge MERV-16 and antimicrobial filters against the aerosolized infectious phages – dust mixtures (artificial viral aerosols). ISO 12103-1 A3 medium test dust, phages, and sucrose were lyophilized to form dried infectious phages – dust preparations. Observations of TEM imaging and results from Electrical Low Pressure Impactor (ELPI) samplings support MS2 phages were aggregated with dust particles. MS2 genomes were detectable on particles sized from 0.017 to 10 µm. The reduction efficiency of the MERV-16 filter challenged against the artificial viral aerosols was 99.4% for infectious MS2 phages (culture), 99.4% for total MS2 phages (qPCR), and 96.4% for dust. The antimicrobial filters had efficacies of 97.9% (culture), 83.4% (qPCR), and 48.5% (dust). The present study supports the possibility of making an infectious phages - bearing dust for use in environmentally controlled experiments evaluating reduction efficiency of air filters against viruses.
Copyright © 2020 American Association for Aerosol Research
EDITOR:
Introduction
Bioaerosols, airborne particles of biological origin, may transport pathogenic agents and expose remote, physically separated from the sources, human and animal populations to microbes of health concern. Pathogens of significance to the swine industry include viruses such as influenza and porcine reproductive and respiratory syndrome viruses (PRRSV) (Otake et al. Citation2010). Biosecurity measures already in place in swine buildings are not enough to prevent air transmission of viruses and the filtration of air was therefore proposed for protecting populations. Airborne particles are captured by filters via different mechanisms: diffusion, interception, inertial impaction, gravitational sedimentation, and sieving (Hinds Citation1999). Diffusion influences the filtration of ≤0.1 µm particles while other mechanisms are associated to the capture of larger particles. Multiple capture mechanisms are then simultaneously challenged with generated aerosols with a particle -size distribution in the nanometer to micrometer range. Mechanical filters are constituted of different media such as fibers (e.g., glass, cellulosic, metal), membranes (e.g., cellulose esters, polycarbonate), fabrics (e.g., cotton, fiberglass), foam, and granular bed. Mechanical filters are commonly applied in heating, ventilation, and air conditioning (HVAC) systems of office buildings and hospitals. Commercially available antimicrobial filters are composed of fibers in which an antimicrobial solution (virucide, bactericide, and/or fungicide) has been incorporated during the manufacturing process. Mechanical filters are classified according to their efficiency to remove inorganic particles (KCl particles) in three ranges (0.3–1.0, 1.0–3.0, and 3.0–10.0 μm) and rated from MERV-1 to MERV-16, MERV-16 being the most effective against the finest particles (MERV: minimum efficiency reporting value) (ASHRAE Citation2012). The capture efficiency of the rated mechanical filters against airborne bacteria or viruses is however unknown, especially since challenges in producing standardized artificial microbial aerosols (bioaerosols) still need to be resolved in order to model the naturally occurring bioaerosols composed of microbial aggregates. Indeed, microbes in bioaerosols exist as aggregates, with viruses, bacteria, and organic or inorganic material, and then transported on nanometer to micrometer-sized particles. Moreover, these aggregates are associated with a reduced microbial exposure to environmental stresses (e.g., UV) and a consequent increased survival of microorganisms (Carrera et al. Citation2005). While progress has been reported on standardizing the aerosolization of spore-forming bacteria Bacillus (Hart et al. Citation2020), production of artificial infectious viral aerosols is complicated by viral sensitivity to environmental conditions and stresses.
The mass median aerodynamic diameter (MMAD) of airborne organic particles in swine buildings is between 10 and 19 μm (Maghirang et al. Citation1997; O’Shaughnessy, Achutan, and Karsten Citation2002). Influenza A virus (IAV, viral particle size: 80-120 nm) and PRRSV (54 nm) were located in swine buildings on fine as well as on large airborne particles of up to 10 μm (Alonso et al. Citation2015; Dokland Citation2010; Noda 2011). As viruses are associated with nanometer and micrometer-sized particles and preservation of infectivity is of concern for biological agents, it is important to develop a replicable and safe experimental procedure to challenge and classify filters with particles transporting viruses. In the present study, a commercially available test dust was combined with phages, bacterial viruses, to form artificial viral aerosols with a particle size distribution similar to the one found in swine buildings. ISO 12103-1 A3 medium test dust (Powder Technology Inc, Arden Hills, MN, USA) has a MMAD of approximately 12 μm, which is in the range expected within swine buildings. Bacteriophages are ideal for modeling airborne viruses occurring naturally in swine buildings as phages are grown easily and safely in laboratories and may be aerosolized in a non bioconfined experimental set up. Finally, to simulate the viral aerosols of swine buildings, a cryoprotective agent was added to the phages and the commercial test dust and lyophilization was used to facilitate the formation of aggregates, and preserve viral infectivity.
Evaluations of a filter’s efficiency against artificial viral aerosols were performed in a test duct designed according to the American Society of Heating, Refrigeration and Air-Conditioning Engineers (ASHRAE) standard 52.2-2012 – Method of Testing General Ventilation Air – Cleaning Devices for Removal Efficiency by Particle Size (ASHRAE Citation2012).
The specific objectives of the present study were then to: A) design a protocol that allows the preparation of a test dust spiked with infectious viruses and with a size distribution similar to the original test dust B) generate artificial viral aerosols containing infectious phages - test dust aggregates in a test duct and C), using these artificial viral aerosols, challenge MERV-16 (mechanical) and antimicrobial filters and estimate their efficiency to remove viruses.
Methods
The test duct
The test duct was designed according to the ASHRAE Standard 52.2-2012 and complied with the “Air Velocity Uniformity” qualification test. Other qualification tests required by the ASHRAE 52.2-2012 Standard were not performed since the present study did not intend to classify the filtering devices (MERV classification). The test duct allows testing air-cleaning devices or filters at airflow rates between 0.22 m3/s and 1.4 m3/s. The test duct is composed of square cross sections (610 × 610 mm) made of aluminum with a smooth interior finish. A blower discharges room air into the duct, upstream of the air-cleaning device. The blower was controlled with a variable frequency drive (MD65 A-C Drive, Reliance Electric, OH, USA) and a differential pressure transmitter (Type 694, Huba Control, Switzerland). In order to straighten out the flow and mix aerosols, an orifice plate and a perforated diffusion plate are located downstream of the aerosol generator and of the evaluated air-cleaning device. HEPA filters clean inlet and outlet air. According to the ASHRAE Standard 52.2-2012, tests need to be conducted at temperatures of 10–38 °C and with a relative humidity of between 20% and 65%. A data acquisition program (Python 3.4, Python Software Foundation, Beaverton, Oregon, USA) was developed to measure airflow, temperature, relative humidity and pressure continuously during tests, using an analog to digital converter, (T7 Pro, LabJack, CO, USA). The airflow was calculated by the pressure differential measured at a nozzle (HCSDRRN002NDAA5, Honeywell, NJ, USA). The temperature and the relative humidity were measured at the entrance of the wind tunnel (HPP809A03, TE Connectivity, Switzerland) to avoid dust deposition on the sensor. The static pressure in the wind tunnel was also measured at several locations including at sampling section (MPXV7002PD, NXP Semiconductors, Netherlands). Airflow, temperature, and relative humidity measurements were validated with a unidirectional hot wire anemometer (AVM440, Alnor/TSI, MN, USA). Pressure measurement were validated with a manometer (MPD500, KIMO, France). The air pressure at the dust feeder was measured using pressure sensor (M3031-000005-100PG, TE Connectivity, Switzerland). The filter to be challenged was installed and sealed inside the test duct. Sampling probes were located upwind and downwind () of the filter for the isokinetic sampling of the artificial viral aerosols. There were two probes at each location, one for the Optical Particle Sizer Model 3330 (OPS; TSI, Shoreview, MN, USA), a real-time particle counter, and another for the All Glass Impinger-30 (AGI-30, BGI Instrument Inc., Butler, NJ, USA). The sampling lines’ orientation allow isoaxial sampling and probe inlets were designed to ensure isokinetic sampling.
Figure 1. Diagram of the test duct used in experiments, based from the ASHRAE Standard 52.2. Locations on the diagram show the approximate placement of the injection location, sampling location, and filters.
The challenged filters in the present study were commercially available MERV-16 rated mechanical filters and antimicrobial 15-layer filters (bought 3 years before the present project beginning). The mechanism of action of the antimicrobial filter is proprietary and is not discussed. Each challenged filter was unused prior to the experiments.
Preservation of viral infectivity of PhiX174 and MS2 phages – test dust mixtures by adding a cryoprotective agent
PhiX174 is a well-characterized DNA bacteriophage infecting Escherichia coli and has been previously used as a eukaryote virus model in aerosol studies (Tseng and Li Citation2006; Turgeon et al. Citation2016; Turgeon et al. Citation2014). MS2 is an RNA bacteriophage of approximately 26 nm in size which also infects E. coli (Strauss Jr and Sinsheimer Citation1963).
All phages and host strains were obtained from the Félix d’Hérelle Reference Center for Bacterial Viruses (www.phage.ulaval.ca). Host strains E. coli (E. coli HER-1462 for MS2 or E. coli HER 1036 for PhiX174) were inoculated into two hundred ml of tryptic soy broth (TSB, Difco) and incubated at 37 °C with 200 rpm shaking until an optical density of 0.17. MS2 or PhiX174 bacteriophages were then added to the TSB containing E.coli, and incubated (37 °C, 200 rpm) another 16 h. Finally, phages were purified of cells and debris by centrifugation 7830 rpm for 10 min and filtration on 0.45 μm pore-sized membrane. Phages were quantified by plaque assays in the presence of their respective host strain E. coli. For experiments in the test duct, phage concentrations needed to exceed ∼1011 plaque forming units per ml (PFU/ml). Phages were stored at 4 °C until combined with the cryoprotective agent and the test dust ISO 12103-1 A3 medium test dust (Powder Technology Inc, Arden Hills, MN, USA) (Ackermann, Tremblay, and Moineau Citation2004).
The following cryoprotective agents were added at varying concentrations to mixtures of 10 ml of phages and 5 or 25 g of test dust: glycerol (Becton Dickinson and Company, Sparks, MD, USA) (final concentrations of 10% and 3%), sucrose (MP Biomedicals LLC, Solon, OH, USA) (0.8 M, 0.4 M, and 0.1 M), and ultra-pasteurized milk (1% partly skim). The cryoprotectant, the test dust, and the phage lysate were mixed by inverting and shaking. Tubes were kept in the −80 °C freezer for 16 h before lyophilization. Lyophilized phages – test dust mixtures (before and after lyophilization) were kept at room temperature until analysis by culture or qPCR.
Infectious MS2 phages – test dust mixtures to be aerosolized
Ten grams of ISO 12103-1 A3 medium test dust (Powder Technology Inc) were mixed with 2.5 ml of 0.8 M sucrose and 17.5 ml of the MS2 phages in a 50 ml tube. Tubes were kept in the −80 °C freezer for 16 h before lyophilization.
Tubes to be lyophilized were placed in a 500 ml freeze-drying jar and connected to a freeze-drier (Labconco FreeZone6, Labconco Corporation, Kansas City, MO, USA) at −52 °C and <0.055 mBar. The samples were freeze-dried for approximately 48 h. Large aggregates of lyophilized mixtures were then broken up and the content of 10 tubes was mixed together. ISO 12103-1 A3 medium test dust was added to complete lyophilized mixtures to a weight of 1 kg.
Aerosolization and sampling
Tests were conducted at an airflow of approximately 1250 to 1300 CFM () within the test duct (). The phages - test dust was aerosolized into the test duct using a Solid Aerosol Generator 410/H (SAG, TOPAS, Dresden, Germany) with the following settings: The feeding belt was adjusted to 15% and the injector air pressure was maintained at 1.5 bar. The scrapper was adjusted in order to constantly fill the feeding belt. The expected dust mass rate was of 1329 g/h and was kept for the different tests between 1209 and 1512 g/h. Following each filter challenge, the front half of the test duct was cleaned of settled dust, filter removed, and the system closed again. Aerosolisation was then performed in the duct without a filter installed. Each filter was exposed to the phage-dust for approximately 20 min. The entirety of the tunnel was cleaned between testing days.
Table 1. Airflow and environmental conditions inside the test duct during ELPI measuring and sampling of artificial viral aerosols.
The MS2 phages - test dust was allowed to fill the tunnel for 30 s before the upwind and downwind isokinetic sampling of artificial viral aerosols began using two high-flow rate pumps (12.5 L/min for 20 min; Levitt Safety, Gilair Aircon II) drawing air into two AGI-30s (12.5 l/min, 20 min) simultaneously filled with 20 ml of 1X phage buffer (20 mM Tris-HCl, 100 mM NaCl, 10 mM MgSO4, pH 7.5). The two AGI-30s were connected to samplings ports upwind and downwind of the tested filter with static dissipative tubing. Air samples were kept at 4 °C until quantification of phages by culture or at −80 °C until viral genomic material extraction.
Airborne particles were monitored using an OPS model 3330 (isokinetic sampling and counting of particles from 10 µm to 0.3 µm, 1 l/min, TSI) connected to a 1:100 Aerosol Diluter Model 3332 (TSI) with a static dissipative tubing. Particles were counted for 1 min repeated five times. Before sampling, the connecting tubes were cleaned using compressed air and the OPS purged using a HEPA filter. Before aerosolization, OPS measurements were taken to ensure low or no background particles were in the test duct. During each aerosolization, the OPS was alternated between probes connected upwind and downwind of the tested filter. The data was imported into the Aerosol Instrument Manager (AIM: release version 9.0.0.0, TSI) and exported for counts and mass data for each sampling.
The particle size distribution of MS2 phages in artificial viral aerosols was determined using an Electrical Low Pressure Impactor (10 l/min, ELPI, Dekati Ltd., Kangasala, Finland). The ELPI measures particle concentration and size distribution in real-time and is composed of 15 stages for the size-selective impaction of particles from 10 µm to 6 nm (Table S1). MS2 phages – test dust mixture was aerosolized into the tunnel for 20 or 40 min and sampled with the ELPI connected to the upstream sampling probe of the test duct. Collection substrates for the ELPI were aluminum foil with grease added to reduce particle-bouncing events. After sampling, the aluminum foils were removed from the stages and placed in 1 ml of 1X phage buffer. MS2 phages were quantified by PCR from samples diluted as necessary according to inhibition tests (data not shown).
PhiX174 and MS2 phages quantification by culture and PCR
Infectivity of phages in the lyophilized PhiX174 and MS2 – test dust mixtures was evaluated by culture using plaque assays. Weighed phage – test dust mixtures were added to an initial phage buffer solution and then serially diluted 1:10. Concentrations were expressed as number of plaque forming units (PFU) per gram.
The air samples from AGI-30 were completed to 20 ml with 1X phage buffer and serially diluted down to 10−6 using 1 ml from the sample and 9 ml of 1X phage buffer for the culture of MS2 phages. Host strain for MS2, E. coli HER-1462, was incubated 16 h at 37˚C with 200 rpm shaking. Three ml of 55–60 °C-heated top agar (TSB containing 0.75% agar) inoculated with 100 µl of E. coli HER-1462 and 100 µl of air samples were poured over the TSA plate. Plates were incubated at 37˚C for 16 h. Data were expressed as number of PFU per m3.
For MS2 quantification by PCR, RNA was extracted from dust or air samples using QIAamp Viral RNA Mini Kit (Qiagen) following instructions provided by the manufacturer. Extracted RNA were then converted to cDNA through the use of the iScript cDNA Synthesis Kit (BioRad) and a thermoprotocol run on a DNA Engine Dyad Thermocycler (BioRad). The cDNA synthesis mixes contained 1 μl RNA, 4 µl 5X iScript Reaction Mix, 1 µl of iScript Reverse Transcriptase, and 14 µl of nuclease-free water (a total volume of 20 μl). cDNA (2 μl) were quantified by PCR in a 20 μl reaction mixture containing: primers (forward (490 nM): 5′-GTC CAT ACC TTA GAT GCG TTA GC-3′, reverse (490 nM): 5′-CCG TTA GCG AAG TTG CTT GG-3′), probe (146.5 nM: 5′-/FAM/ACG TCG CCA GTT CCG CCA TTG TCG/3BHQ_1-3′), iQ Supermix 1x, and nuclease-free water (Gendron et al. Citation2010). For quantification of PhiX174 by PCR, samples were diluted 1:100 and then added to the PCR reaction mixture (no DNA extraction performed). PhiX714 qPCR used 5 μl diluted sample added to 15 μl of: primers (468.75 nM: forward − 5′-ACA AAG TTT GGA TTG CTA CTG ACC-3′, 468.75 nM: reverse − 5′-CGG CAG CAA TAA ACT CAA CAG G-3′), probe (187.5 nM: 5′-/56-FAM/CTC TCG TGC TCG TCG CTG CGT TGA/3BHQ_1-3′), iQ Supermix 1x, and nuclease-free water (Verreault et al. Citation2010). Both thermoprotocols were run on a CFX96 Touch Real-Time PCR Detection System (BioRad) using the thermoprotocol of 94 °C for 3 min followed by 40 cycles of 94 °C for 15 s, and 60 °C for 60 s. Data were expressed as number of phages per gram or m3.
Transmission electron microscopy
Phage-bearing dust particles were observed under transmission electron microscopy (TEM) at the Institut de biologie intégrative et des systèmes (IBIS, Université Laval) on a JEOL, JEM-1230 (Tokyo, Japan) operated at 80 kV. A small quantity of dust was spread on TEM grids and a 3% uranyl acetate solution was applied, allowing it to settle for 1 min before removing excess solution.
Filter reduction efficiency
The reduction or capture efficiency of a filter was calculated according to the formula described by Foarde and Hanley Citation1999 and the ASHRAE Standard 52.2-2012 (Foarde and Hanley Citation1999). See EquationEquations (1)–(4).
(1)
(1)
(2)
(2)
(3)
(3)
(4)
(4)
Statistical analysis
Statistical analyses on dust, total MS2, and viable MS2 concentrations in the test duct without the installation of a tested filter were performed in GraphPad Prism 5 (GraphPad Software Inc). Paired t-tests were performed on the averaged replicates for each day before and after the filter location when no filter was installed to examine effects of the test duct on losses in the system. The results were considered significant when p-values were less than 0.05.
Results
Preservation of infectious PhiX174 and MS2 in lyophilized phages – test dust mixtures
Without cryoprotectant or test dust, there was no quantifiable infectious PhiX174 phages after lyophilization and a 1,000-fold decrease in MS2 concentrations (data not shown). The addition of 25 g of test dust before lyophilization resulted in PhiX174 being unrecoverable while MS2 experienced a more than three log10 reduction in concentration (“Phage Buffer” columns in ).
Figure 2. Preservation of infectivity of PhiX174 and MS2 phages with test dust and cryoprotectants after lyophilization. The quantification of PhiX174 (a) and MS2 (b) phages with test dust and cryoprotectants was done before and after lyophilization. All tested mixture contained 25 g of test dust, 10 ml of phage suspensions and a cryoprotective agent for a total volume of 20 ml. Bars are averages of replicates (n = 3, except for 0.1 M sucrose of MS2 before lyophilization n = 1) with standard error of the mean. * indicates a result below the detection limit.
Glycerol (3% and 10%) provided no protection to PhiX174 phages from lyophilization but was slightly protective for MS2 (a loss of approximately two log10 in concentration) (). Sucrose provided protection to both lyophilized viruses (at 0.8 M, 0.4 M, and 0.1 M) although 0.4 M was the least efficient. Losses were observed with all cryoprotective agents when using test dust but could be limited through the reduction of number of grams of test dust used (5 g versus 25 g). When 0.1 M sucrose was used in combination with 5 g of test dust instead of 25 g in 10 ml of PhiX174 phage suspensions, there was an increase in the concentration of infectious PhiX174 after lyophilization (data not shown). The lyophilized mixture of 5 g of test dust, 0.1 M (final concentration) sucrose and 10 ml of phage suspensions was used to create artificial viral aerosols into the test duct.
MS2 phages were found in association with test dust particles when using TEM imaging of the prepared mixtures (). The observation of phages associated or not with dust particles of varying sizes may support the result of a well-distributed mixture of phages and test dust particles.
Figure 3. TEM imaging of lyophilized mixture of MS2 phages – ISO 12103-1 A3 medium test dust. (a) An aggregation of MS2 phages and fine dust particles indicated by the faint shading around the aggregate. (b) A larger dust particle bearing MS2 phages. (c) A broad view of MS2 phages associating with dust particles and existing potentially independently. (d) A closer image of the large aggregate at the top left in (c).
The particle size distribution of MS2 phages in the artificial viral aerosols
On the experimental days using the ELPI, the relative humidity and temperature were between 48.5% and 56.9% and from 18.4 °C to 22.8 °C, respectively ().
The number of dust particles by aerodynamic diameter measured by the ELPI did not differ much during any of the four aerosolization (). Potential effects by the tunnel length on particle numbers (Figure S1) were accounted for in calculations as previously described. The particle concentration increases up to 0.76 μm and decreases after 0.48 μm. At particle sizes of 0.039 μm and smaller, the difference between aerosolization increases.
Figure 4. The total number of dust particles by ELPI stage. The ELPI stages are indicated along the x-axis. Two replicates (hollow and solids) were done on each sampling days, 7 June (● and ^) and 27 September (▪ and □). X-axis stage size indicates the approximate geometric midpoint, minor variations were noted between the two columns used to collect air samples, Table S1. Error bars are from the varying counts by the ELPI during sampling.
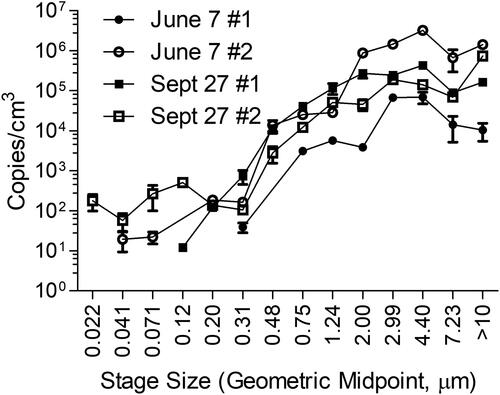
Infectious MS2 phages were not detectable from the 14 ELPI stages. Concentration of total MS2 phages was able to be determined by qPCR and revealed a trend of decreasing concentrations as particle size diminishes (). There was a slight increase of quantities at 4.4 μm followed by a decreasing trend. The distributions of total MS2 phages showed similar distributions on all experimental days even if not identical in term of number per cubic centimeter of air (total MS2 phages/cm3). There was a greater difference in total MS2 phages concentrations between the two replicates (aerosolization) taken place on 7 June (1st experimental day) compared to those on 27 September (2nd experimental day).
Figure 5. Total MS2 phages (copies) per cm3 of air per stage of ELPI. The ELPI stages are indicated along the x-axis. Two replicates (hollow and solids) were done on each experimental day, 7 June (● and ^) and 27 September (▪ and □). X-axis stage size indicates the approximate geometric midpoint, minor variations were noted between the two columns used to collect air samples, Table S1. Error bars represent the error from the qPCR replicates.
Reduction efficiencies of challenged MERV-16 and antimicrobial filters
The air taken by the blower came from a non-environmentally controlled room and then temperature and relative humidity inside the test duct were closely monitored during each experimental day. Environmental conditions may as well influence the preservation of viral infectivity. All temperature and relative humidity were within the ranges imposed by the standard, 11–23 °C and 39-65%, respectively (). On each experimental day, a test was done without any filtering device (P100) and then one with the tested filter in place in the duct (Ptest). The results of the upstream and downstream aerosolization and phage quantifications with and without filters installed are presented in Figure S2 but for percent calculations, any effect was taken into consideration through the calculations described in the methods section. The reduction efficiency for particles determined through the counting of the OPS is broken down by size fraction in Table S2.
Table 2. Airflow and environmental conditions inside the test duct during the challenge of MERV-16 and antimicrobial filters with artificial viral aerosols. Values are averages of the recordings on each experimental day. The amount (kg) of phages – test dust aerosolized on average per day is indicated in the “Weight” column.
PhiX174 phages were quantified in the 1 kg of PhiX174 phages – test dust mixture to be aerosolized and the calculated concentration was 6.53 × 10⁷ PFU/g. Once aerosolized, the concentration of infectious PhiX174 phages in the test duct was 2 × 10⁵ PFU/m3 upwind and 1.09 × 10⁴ PFU/m3 downwind without any mechanical or antimicrobial filter installed in the test duct. However, no infectious PhiX174 phages were detectable downwind when a MERV-16 filter was challenged. All following reported data on reduction efficiencies of challenged filters are then the result of experiments done with MS2 phages – test dust mixtures since aerosolization of PhiX174 phage – dust would result in 100% capture efficiencies for infectious PhiX174 phages for any of the challenged filters. Using a 1 PFU per plate of the lowest diluted sample as a limit of detection (LOD) for the downwind air samples and using this LOD as a value for calculations, a reduction efficiency of 91.1% was obtained.
The MS2 phages – test dust mixtures after lyophilization showed 7.014 × 10¹¹ PFU/g (averaged concentrations across all lyophilization). Inside the test duct, concentrations of aerosolized MS2 phages before the tested filter varied between 7.07 × 10⁸ PFU/m3 and 1.04 × 10⁹ PFU/m3 for all experimental days. No loss in concentrations was observed in the test duct when no filter was installed for total dust, total MS2, or infectious MS2 (p-values = 0.9512, 0.4729, and 0.7638, respectively). In tests challenging filters, the concentrations of MS2 phages downwind of the MERV-16 filter was on average 4.18 × 10⁶ PFU/m3 and 3.31 × 10⁷ PFU/m3 downwind of the antimicrobial filter.
Results indicate a difference in the removal efficiency of total dust particles (from 10 µm to 0.3 µm-sized particles) between the MERV-16 and antimicrobial filters (). On average, the MERV-16-rated filters had a 96.4% efficiency for reducing airborne dust particles while the antimicrobial filters were 48.5% effective. Infectious MS2 phages (culture) reduction was 99.4% on average by the MERV-16 filter and 97.9% for the antimicrobial filter. The MERV-16 filter captured an average of 99.4% of total MS2 phages (qPCR) with the antimicrobial filters removing 83.4%.
Table 3. Reduction efficiencies of MERV-16 and antimicrobial filters against dust particles, and infectious (culture) and total (qPCR) MS2 phages when challenged with the artificial viral aerosols.
Discussion
A previous study investigating phage therapy and the application of phages in an aerosolized form has found success in using lyophilization to generate respirable phage powder (Golshahi et al. Citation2011). These powders had a MMAD of up to 3.4 µm since the research was on producing a powder in the respirable fraction (<4 µm according to the ACGIH) (American Conference of Governmental Industrial Hygienis [ACGIH] Citation2005). A MMAD of 3.4 µm falls below the required MMAD to simulate dust found inside a swine building. Golshahi et al. evaluated multiple cryoprotectants for phages and found sugars along with other additives to be protective (Golshahi et al. Citation2011). Another study investigated the encapsulation of phages in an oil-based solution before lyophilization, and found lyophilization to be a suitable for producing phage powders (Puapermpoonsiri, Spencer, and van der Walle Citation2009). In the present research, experiments on cryoprotectants demonstrated that sucrose provided the best protection for both PhiX174 and MS2 phages. While glycerol did not protect PhiX174 phages, it did provide minimal protection for MS2 phages. However, glycerol underperformed compared to sucrose due to the 2 log10 loss in concentrations which is consistent with previous findings that sugars, such as sucrose, preserves better the viral infectivity during lyophilization (Merabishvili et al. Citation2013; Zhang et al. Citation2018). The present study did not investigate on the long term the preservation of infectious phages in the phages – test dust mixtures but Merabishvili et al. found a Staphylococcus aureus phage to be stable for up to 27 months after lyophilization with sucrose (Merabishvili et al. Citation2013). There were however issues with using the highest concentrations of sucrose (0.8 M and 0.4 M) as a hardening of the phages – test dust preparations occurred during lyophilization. Quantification of phages from these mixtures was complicated and found concentrations may not be representative of the whole preparation as samples used for quantification were scrapings of the surface. It could explain the apparent disagreement between the present study and Merabishvili et al. (Citation2013) who discovered a greater survival at 0.5 M sucrose. The hardening of mixtures made it impossible to use for airborne dispersion in the test duct and is the primary reason for using lower concentrations (0.1 M) of sucrose, which resulted in mostly dust although some larger clumps needed to be broken up.
PhiX174 phages were amplified to concentrations that when aerosolized into the test duct (1.81 × 10⁵ PFU/m3) resulted in no detectable infectious PhiX174 after a MERV-16 filter and, consequently, no reduction efficiency could be calculated. MS2 phages were aerosolized to significantly higher concentrations (3 to 4 log10 higher) than PhiX174 phages and allowed for the quantification of infectious phages downwind of MERV-16 or antimicrobial filters. The differences observed from the lyophilization of MS2 and PhiX174 are similar to that of Golshahi et al. (Citation2011) with phages KS4-M and ФKM resulting in different reductions of their infectious state after lyophilization (Golshahi et al. Citation2011).
The consistency of dust particle concentrations and size distribution as measured by the ELPI across the four aerosolization experiments is encouraging and shows that the particle size distribution has not been altered by the addition of the phages, even when the phages concentrations vary. The lack of quantifiable phages by culture methods could be indicative of the stressful process of sampling, corona discharges, and collection on aluminum substrates by the ELPI. The phage genomes present in the dust had similar size distribution patterns but the concentrations varied between tests, especially for the two experiments taken place on 7 June. The differences could result from the different starting concentrations of MS2 phages in the phages – test dust preparations to be aerosolized and perhaps from the environmental conditions. Indeed, on 7 June, a 7.9% difference in relative humidity was observed between experiments while being only 1.5% different on 27 September.
On the first experimental day, the challenging of the MERV-16 filter resulted in a reduction of infectious phages of only 26% which is an outlier value compared to capture efficiencies of the three other experiments using MERV-16 filters. The relative humidity on that experimental day was 64.2% that is a 19.7% increase with the average values of the other experimental days () and might explain a lower reduction efficiency for infectious MS2 phages. Phage infectivity could have been affected by the room relative humidity and temperature while the phage-dust mixture was resting in the SAG reservoir or in the closed container. A previous study did find some reduction of infectious MS2 phages with increasing relative humidity (Verreault et al. Citation2015).
The MERV-16 filters were capable of reducing dust particles as expected based on the rating (>95% reduction of particles 0.3 to 10 μm, 96% average in the present study). The antimicrobial filters were much less effective (49% for total dust particles, lower capture efficiency for fine particles) at reducing dust particles but almost equally efficient of reducing infectious MS2 phages (99% for MERV-16 compared to 98% for the antimicrobial filters). The reduction of total MS2 phages (genomic DNA copies) differed however between the two filters as the MERV-16 performed better (99% to 83% for the antimicrobial filters). The more equivalent capture efficiencies of total MS2 phages by the mechanical MERV-16 and antimicrobial filters (less efficient against fine particles) than of dust particles suggest that the MS2 phages had successfully been aggregated with larger dust particles (multiple nano-sized viruses aggregated on a micro-sized dust particle). TEM imaging of MS2 phages associated with ISO 12103-1 A3 medium test dust also supported that the phages had successfully formed aggregates with the dust particles. Compared to the MERV-16 filters, the antimicrobial filters were capable of reducing almost equally as many infectious MS2 phages without needing to capture the same amount of dust particles. The combination of similar removal efficiencies of the antimicrobial and MERV-16 filters for infectious MS2 phages and the aggregation of phages onto larger particles could indicate that removal is primarily physical capture instead of antimicrobial activity although the virucidal effect of the antimicrobial filter cannot be entirely ruled out considering the existing differences in reduction efficiencies of MS2 phage genomes (99% for MERV-16 and 83% for antimicrobial filter). Result interpretation on the reduction efficiencies of MERV-16 and antimicrobial filters against artificial viral aerosols is however limited by the few number of samples for comparison and then reduction efficiencies of the tested filters need to be confirmed by further studies.
Conclusion
Lyophilization allowed the preparation of phages - bearing dust particles with high concentrations of infectious phages that can be used in experiments investigating the capture efficiency of filters toward virus - dust aggregates similar to those naturally produced in swine buildings. The particle size distribution of MS2 phages in the produced artificial viral aerosols was revealed by ELPI sampling and aggregation of virus and dust particles was supported by TEM imaging. The present study suggests a replicable approach to produce and aerosolize infectious viral models - test dust aggregates that could be used to determine the capture efficiency of air cleaning devices or filters against biological particles (bioaerosols) such as infectious viruses using test ducts designed according to the ASHRAE Standard 52.2.
Supplemental Material
Download MS Word (497.6 KB)Acknowledgments
The authors would like to thank Gabrielle Dumas and Patrick Gagnon (CDPQ). Authors would like to also acknowledge Amélia Bélanger Cayouette for laboratory and field work (Université Laval) and Serge Simard (CRIUCPQ) for statistical analyses. The authors would also like to thank Richard Janvier (IBIS-Université Laval) for TEM sample preparations and imaging.
Additional information
Funding
References
- Ackermann, H.-W., D. Tremblay, and S. Moineau. 2004. Long-term bacteriophage preservation. WFCC Newsletter 38:35–40.
- Alonso, C., P. C. Raynor, P. R. Davies, and M. Torremorell. 2015. Concentration, size distribution, and infectivity of airborne particles carrying swine viruses. PloS One 10 (8):e0135675. doi:https://doi.org/10.1371/journal.pone.0135675.
- American Conference of Governmental Industrial Hygienis (ACGIH). 2005. TLVs and BEIs: Based on the documentation of the threshold limit values for chemical substances and physical agents and biological exposure indices. Cincinnati, OH: ACGIH.
- ASHRAE. 2012. Method of testing general ventilation air-cleaning devices for removal efficiency by particle size. ASHRAE.
- Carrera, M., J. Kesavan, R. Zandomeni, and J.-L. Sagripanti. 2005. Method to determine the number of bacterial spores within aerosol particles. Aerosol Sci. Technol. 39 (10):960–5. doi:https://doi.org/10.1080/02786820500352098.
- Dokland, T. 2010. The structural biology of PRRSV. Virus Res. 154 (1–2):86–97. doi:https://doi.org/10.1016/j.virusres.2010.07.029.
- Foarde, K. K., and J. T. Hanley. 1999. A new laboratory method for measuring the bioaerosol filtration efficiency of air cleaners. Air Filtration Conference: Fall Topical Conference, 47–54.
- Gendron, L., D. Verreault, M. Veillette, S. Moineau, and C. Duchaine. 2010. Evaluation of filters for the sampling and quantification of RNA phage aerosols. Aerosol Sci. Technol. 44 (10):893–901. doi:https://doi.org/10.1080/02786826.2010.501351.
- Golshahi, L., K. Lynch, J. Dennis, and W. Finlay. 2011. In vitro lung delivery of bacteriophages KS4-M and ΦKZ using dry powder inhalers for treatment of Burkholderia cepacia complex and Pseudomonas aeruginosa infections in cystic fibrosis. J. Appl. Microbiol. 110 (1):106–17. doi:https://doi.org/10.1111/j.1365-2672.2010.04863.x.
- Hart, M. B., C. S. Scotto, J. E. Tucker, D. C. McPherson, Z. Minter, J. Kesavan, D. Silcott, H. B. Lin, and J. D. Eversole. 2020. Toward biological aerosol reference standards. Aerosol Sci. Technol. 54 (5):601–10. doi:https://doi.org/10.1080/02786826.2019.1708860.
- Hinds, W. C. 1999. Aerosol technology: Properties, behavior, and measurement of airborne particles: New York, N.Y.: Wiley.
- Maghirang, R. G., M. C. Puma, Y. Liu, and P. Clark. 1997. Dust concentrations and particle size distribution in an enclosed swine nursery. Trans. ASAE 40:749–54. doi:https://doi.org/10.13031/2013.21305.
- Merabishvili, M., C. Vervaet, J.-P. Pirnay, D. De Vos, G. Verbeken, J. Mast, N. Chanishvili, and M. Vaneechoutte. 2013. Stability of staphylococcus aureus phage ISP after freeze-drying (lyophilization). PloS One 8 (7):e68797. doi:https://doi.org/10.1371/journal.pone.0068797.
- Noda, T. 2011. Native morphology of influenza virions. Front. Microbiol. 2:269. doi:https://doi.org/10.3389/fmicb.2011.00269.
- O’Shaughnessy, P. T., C. Achutan, and A. W. Karsten. 2002. Temporal variation of indoor air quality in an enclosed swine confinement building. J. Agric. Saf. Health 8 (4):349–64. doi:https://doi.org/10.13031/2013.10217.
- Otake, S., S. Dee, C. Corzo, S. Oliveira, and J. Deen. 2010. Long-distance airborne transport of infectious prrsv and mycoplasma hyopneumoniae from a swine population infected with multiple viral variants. Vet. Microbiol. 145 (3–4):198–208. doi:https://doi.org/10.1016/j.vetmic.2010.03.028.
- Puapermpoonsiri, U., J. Spencer, and C. F. van der Walle. 2009. A freeze-dried formulation of bacteriophage encapsulated in biodegradable microspheres. Eur. J. Pharm. Biopharm. 72 (1):26–33. doi:https://doi.org/10.1016/j.ejpb.2008.12.001.
- Strauss Jr, J. H., and R. L. Sinsheimer. 1963. Purification and properties of bacteriophage MS2 and of its ribonucleic acid. J. Mol. Biol. 7:43–54. doi:https://doi.org/10.1016/S0022-2836(63)80017-0.
- Tseng, C.-C., and C.-S. Li. 2006. Ozone for inactivation of aerosolized bacteriophages. Aerosol Sci. Technol. 40 (9):683–9. doi:https://doi.org/10.1080/02786820600796590.
- Turgeon, N., K. Michel, T.-L. Ha, E. Robine, S. Moineau, and C. Duchaine. 2016. Resistance of aerosolized bacterial viruses to four germicidal products. PloS One 11 (12):e0168815. doi:https://doi.org/10.1371/journal.pone.0168815.
- Turgeon, N., M.-J. Toulouse, B. Martel, S. Moineau, and C. Duchaine. 2014. Comparison of five bacteriophages as models for viral aerosol studies. Appl. Environ. Microbiol. 80 (14):4242–50. doi:https://doi.org/10.1128/AEM.00767-14.
- Verreault, D., M. Marcoux-Voiselle, N. Turgeon, S. Moineau, and C. Duchaine. 2015. Resistance of aerosolized bacterial viruses to relative humidity and temperature. Appl. Environ. Microbiol. 81 (20):7305–11. doi:https://doi.org/10.1128/AEM.02484-15.
- Verreault, D., G. M. Rousseau, L. Gendron, D. Massé, S. Moineau, and C. Duchaine. 2010. Comparison of polycarbonate and polytetrafluoroethylene filters for sampling of airborne bacteriophages. Aerosol Sci. Technol. 44 (3):197–201. doi:https://doi.org/10.1080/02786820903518899.
- Zhang, Y., X. Peng, H. Zhang, A. B. Watts, and D. Ghosh. 2018. Manufacturing and ambient stability of shelf freeze dried bacteriophage powder formulations. Int. J. Pharm. 542 (1–2):1–7. doi:https://doi.org/10.1016/j.ijpharm.2018.02.023.