
 ?Mathematical formulae have been encoded as MathML and are displayed in this HTML version using MathJax in order to improve their display. Uncheck the box to turn MathJax off. This feature requires Javascript. Click on a formula to zoom.
Abstract
Detection, monitoring and estimation of bioaerosol concentration have become increasingly important for several reasons, particularly for environmental quality monitoring and public health concerns on these materials. Bioaerosol concentration is highly variable and noisy, influenced by many factors including meteorological parameters. Directly predicting bioaerosol concentration with noisy data gives erroneous results. As such, we developed a facile approach to forecast bioaerosol concentration using the Wavelet De-noising-based Back Propagation (WDBP) neural network model. We used meteorological data for Changsha gathered from 1 November 2018 to 1 April 2019 to demonstrate the efficiency of WDBP neural network in forecasting atmospheric bioaerosol concentration. The superiority of the new approach over the single Back Propagation (BP) neural network was also validated using real dataset. Overall, the performance of WDBP neural network was satisfactory, underlying potential practical application of the method in forecasting bioaerosol concentration. This work provides a prospective model, useful in monitoring environmental quality and atmospheric bio-threats to public health.
Copyright © 2020 American Association for Aerosol Research
EDITOR:
1. Introduction
Bioaerosol mainly comprise of volatile organic compounds derived from microorganisms, plants, spores, pollen, fungi, bacteria, viruses, etc. (Kim, Kabir, and Jahan Citation2018). The term bioaerosol has attracted unprecedented attention after the 2019 Corona Virus (COVID-19) pandemic, based on the possibility the virus could spread between individuals through bioaerosols, particularly in a relatively closed environment (Wang Citation2020). Bioaerosols in the environment play important roles in climate change, ecosystem function and impact on public health (Liu et al. Citation2020). Regarding health, inhalation of bioaerosols can cause cytotoxicity and inflammation. Once in the lungs, bioaerosol can easily enter the circulation, causing respiratory and vascular diseases (Maya-Manzano et al. Citation2016; Liu et al. Citation2018). Bioaerosol concentration is affected by many factors such as meteorological parameters, location, season and human activities (Oduber et al. Citation2019). Overall, bioaerosol concentration greatly impact on public health.
Most researchers focus on evaluating the correlation between bioaerosol concentration and multiple meteorological factors, but little effort is put in predicting the concentration of bioaerosols. Consequently, De Gennaro developed a novel artificial neural network model that can predict daily concentration of small particulate matter with aerodynamic diameter ≤10 μm (PM10) (De Gennaro et al. Citation2013). Ren then developed a method for selecting input factors to obtain desired results using the BP neural network based on Particle Swam Optimization. The modified BP neural network model was found to be superior to the single BP neural network in forecasting the behavior of meteorological factors (Ren et al. Citation2014). Bai on his part developed a model for predicting concentration of air pollutants using the wavelet transformation and BP neural network (Bai et al. Citation2016). On the other hand, Chaloulakou applied the neural network model to accurately forecast particulate pollutants in the air (Chaloulakou, Grivas, and Spyrellis Citation2003). Meanwhile, Li used the BP neural network model to forecast bioaerosol concentration by analyzing meteorological factors (Li et al. Citation2020). These reports demonstrate the rapid evolution of predicting concentration of air pollutants. In this study, we proposed a hybrid forecasting model called WDBP neural network that incorporates BP neural network and wavelet decomposition of meteorological factors. The WDBP model is an improvement of our previous forecasting model. The performance of WDBP neural network was compared with the single BP neural network reported in our previous and other related studies (Li et al. Citation2020). Correlation analysis was performed to explore the relationship between bioaerosol concentration and meteorological factors. The dimensionality of the complex matrix of meteorological factors was realigned using component analysis (PCA). The original data was first stratified into multiple layers by wavelet transformation. A BP neural network model was established using low and high-frequency signal from each layer. This process is ideally the WDBP neural network used for forecasting bioaerosol concentration. To the best of our knowledge, this is the first time WDBP neural network-based model is used in forecasting bioaerosol concentration. Practical application of this model was demonstrated using meteorological data of Changsha, collected from 1 November 2018 to 1 April 2019. Furthermore, the forecasting efficacy of WDBP neural network over single BP neural network was demonstrated using real dataset.
2. Materials
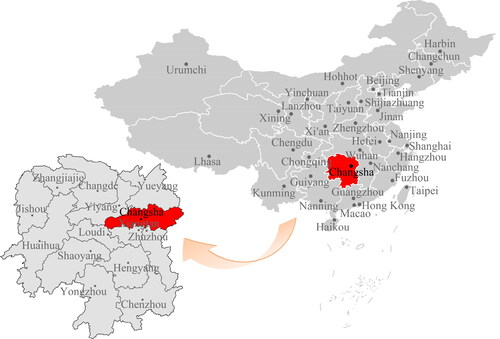
As shown in , Changsha is located in Hunan province, downstream of Xiangjiang River, South-Central China. It stretches 230 km from east to west and 88 km from north to south. Overall covers 11,819 km2, and as of 2018 it had a population of 8,150,000 people (He et al. Citation2019). Accurate forecasting of bioaerosol concentration is likely to improve implementation of public health policies need to effectively ‘Make our skies blue again’.
Figure 1. Geographical location of Changsha within Hunan province, China.
We collected 3 secondary bioaerosol concentration data in Changsha, generated by a Fluorescent Data Acquisition Instrument (FDAI) from 1 November 2018 to 1 April 2019. FDAI monitors bioaerosol based on fluorescent signals emitted from common amino acids like tryptophan, tyrosine, phenylalanine and also from reduced nicotinamide adenine dinucleotide (NADH) and riboflavin (Pöhlker et al. Citation2013). Tryptophan and NADH are the major emitters of fluorescence among common bioaerosols. As the same time, short interval meteorological data (5-min) on precipitation, air temperature, relative humidity, wind speed, air pressure, concentration of particulate matter with aerodynamic diameter ≤2.5 μm (PM2.5), PM10, air quality index (AQI), sunlight radiation, sunshine duration, etc, was gathered from Meteorological Bureau of Changsha Municipality. The fluorescence and meteorological data was then standardized using MATLAB (R2016a, MathWorks Inc). The same program was used to detect and delete blank or outliers data FDAI, automatic weather station's software and damaged hardware. The WDBP neural network forecasting methods used in this study was assessed for its ability to forecast bioaerosol concentration at short intervals (5-min).
3. Methods
In this section, the systematic methodology of a WDBP neural network model approach was described in detail, including correlation analysis, PCA, and WDBP neural network. The accuracy of WDBP neural network model can be improved by determining a reasonable input vector through correlation analysis and PCA. In section 3.1, correlation analysis is used to study the relationships between bioaerosol concentration and meteorological factors. In section 3.2, PCA is used to reduce the dimension of meteorological factors matrix. In section 3.3, the steps of wavelet transformation for WDBP network was provided in detail.
3.1. Correlation between bioaerosol concentration and meteorological factors
The relationship between bioaerosol concentration and meteorological factors is complex (Liu et al. Citation2019). Correlation analysis was first be performed using SPSS to uncover meteorological factors that strongly influence bioaerosol concentration to be used as neural network input vectors.
This part applied correlation analysis function of SPSS to analyzing the correlation. There are three types of correlations in SPSS: Pearson correlation, Kendall rank correlation, Spearman correlation. In Pearson correlation, the correlation analysis function gets a linear correlation between vectors and nonlinear correlation can be got in Spearman correlation. And Kendall rank correlation is not applicable the correlation analysis between two one-dimensional vectors. Because of possible nonlinear relationship between bioaerosol concentration and meteorological factors, we performed Spearman correlation analysis to explore the association the two parameters. As shown in , bioaerosol concentration strongly correlated with wind direction and wind speed, air temperature, particulate matter and air pressure, relative humidity, vapor pressure, dew temperature and precipitation. Hence these nine parameters were selected as candidate input vectors for neural network model.
Table 1. Correlation between bioaerosol concentration and meteorological factors.
3.2. Improved meteorological data based on PCA
Although bioaerosol concentration and meteorological factors are correlated, intra correlation between meteorological factors such as relative humidity and precipitation, relative humidity and air temperature complicate construction of neural network model. This may intern impact on the accuracy of the model (Jones, Westra, and Sharma Citation2010). As such, PCA was performed to realign and simplify the multicollinear complexity of meteorological factors, while at the same time maintaining the integrity of the data (Jolliffe and Cadima Citation2016).
Through the research of PCA, it can find out the primary information of the candidate input vectors, while the dimension of input vector was reduced. One of the most commonly used tools for dimension reduction is PCA, PCA can transform a set of vectors with dimension i into a set of linearly independent vectors with dimension j by orthogonal transformation, where j is less than i. And the explained variance corresponding to the j-dimension vectors. Overall, PCA simplified the operation of neural network model, decreased its running time and ensured better accuracy. Total variance explained of PCA analysis is displayed on . It showed that the cumulative variance was larger than 85% by the 7-principal components, therefore, 7-principal components was selected for this study. The input vectors thus decreased from 9 to 7, which were then applied in the construction of the WDBP neural network.
Table 2. Total variance explained of PCA analysis.
3.3. Wavelet transformation and WDBP neural network
3.3.1. Wavelet transformation
Bioaerosol concentration in the atmosphere is highly variable and noisy, which renders single BP neural network forecasting inaccurate. Therefore, wavelet transformation was performed for preliminary processing of the data set.
Wavelet transformation is useful in analyzing non-static data (Bai et al. Citation2014), and provides accurate data on frequency of domains and respective time of occurrence. Thus, wavelet transformation is regarded a special type of Fourier transformation. Principally, it is based on appropriate selection of wavelet function, also referred to as 'mother' wavelet. The wavelet was obtained by scaling and shifting the decomposed signal of 'mother' wavelet. The properties of the original signal are derived by comparing the wavelet and the original signal (Goswami and Chan Citation2011). Wavelet basis can be expressed as follows;
(1)
(1)
where a is positive number of scale parameter and b is any real number of translational parameters. The pair (a, b) defines a point in the right halfplane R+×R. The greatest strength of wavelet transformation is it strengthens multiresolution analysis of the origin signal and discerns the characteristics of bioaerosol concentration. In practice, the multiresolution analysis can provide two channel filter banks composed of a low and high-pass filter containing low-frequency and high-frequency signals (Li and Liang Citation2011). For the past few years, wavelet transformation has undergone tremendous improvement and adoption in analysis of signals in many fields. In this research, it was utilized for filtering background noise in data ahead of predicting bioaerosol concentration.
In particular, wavelet transformation was applied to decompose bioaerosol concentration into different scales, and thereafter, the BP neural network was used to forecast the bioaerosol concentration in each strata. In training the WDBP neural network model, bioaerosol concentration and meteorological data was divided into training and validation datasets in the ratio of 7:3 using the ‘Hold-out’ method, which is bases upon statistically random analysis. Even after data stratification in to training and validation sets, the data were still well organized. To ensure quality forecasting by WDBP neural network model, the original data was normalized based on the following equation;
(2)
(2)
where Ximin and Ximax represent the maximum and minimum value of the original series, respectively.
In this research, the computationally efficient Daubechies (db5) wavelet was used because it is conceptually simple, fast and compatible. The decomposition process of Daubechies (db5) is shown in .
Figure 2. The eight levels of db5 wavelet de-composition.
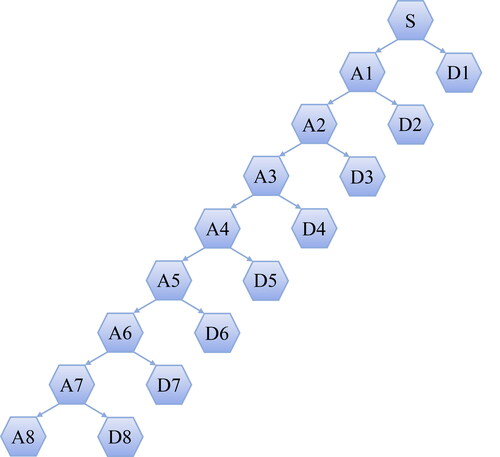
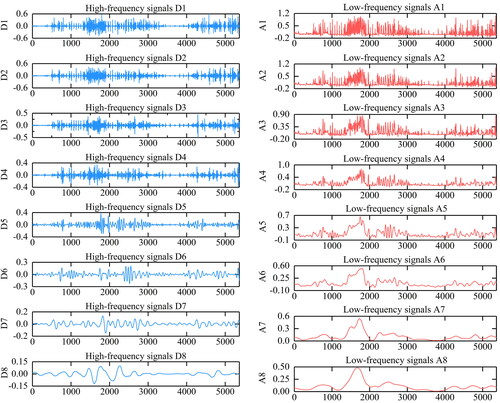
S represents the original signal, Ai (i = 1,2,…,8) whereas Di (i = 1,2,…,8) represent the approximation and detailed components, respectively, all reconstructed from the wavelet coefficients. In general, the number of levels for wavelet de-composition depends on when acceptable reliable information is available. In this research, eight levels of wavelet de-composition was used. The noise in bioaerosol concentration was minimized by db5 wavelet de-composition. The decomposition process is shown in , based on the formulae;
(3)
(3)
Figure 3. The de-composition process of the bioaerosol concentration data.
3.3.2. WDBP neural network
A WDBP neural was used to forecast the bioaerosol concentration by meteorological factors. Although there are many different neural networks available for forecasting bioaerosol concentration, we used WDBP neural network in this research. BP neural network was originally proposed in 1986 by Rumelhart and McClelland (Wang et al. Citation2016). It was proposed to be used in regression analysis, function approximation, classification and data processing, blockchain (Ren, Zhu, et al. Citation2019) and smart computing (Ren, Leng, et al. Citation2019). It was also widely applied in short-term forecasting situations.
Different from other BP neural networks that directly utilize original data, WDBP neural network is constructed by wavelet de-composed signals (Wang et al. Citation2011). Each BP neural network was pre-assessed by low and high-frequency signals before reconstruction to WDBP neural network model. In this study, the BP neural network featured a three-layer: the input layer, the hidden layer and the output layer. The BP neural network also had a 7 input layer nodes, a 15 hidden layer nodes and a 1 output layer node. In general, the structural makeup of the BP neural network are comparable to previous model (Li et al. Citation2020).
The training function of BP neural network was LM (Levenberg-Marquardt backpropagation) whereas the adaption learning function was GDM (Gradient Descent with Momentum backpropagation). On the other hand, MSE (Mean Squared normalized Error performance function) was the performance function. The transfer functions used in the hidden layer and the output layer were LOGSIG (Log-sigmoid transfer function) and PURELIN (Linear transfer function), respectively. Because the initial weights and thresholds are randomly generated and influence the performance of BP neural network, the model gives different results each time. In the field of neural network, an initial weight problem is a function together with a specified value, called the initial condition (initial weights), of the transfer function at a given point in the domain of the solution. The definition of a threshold is only when the signal exceeds this threshold will the model send a signal to the next artificial neuron. As such, each BP neural network was tested five times, and GDM function was used to optimize based on the initial weight and threshold determined after the last training. In the end, we selected the model with the least error. Overall, the results of each reconstructed BP neural network are selected as the final prediction of WDBP model forecasting.
3.4. Overview of WDBP neural network model
Step 1. Several meteorological factors influencing bioaerosol concentration were selected as the neural network input vectors the model.
Step 2. The input vectors were realigned using PCA to simplify their intra-multicollinearity.
Step 3. Wavelet transformation was performed to decompose the bioaerosol concentration series into low and high-frequency signals.
Step 4. Functionality of BP neural network was validated using bioaerosol concentration and meteorological data.
Step 5. The final forecasting results were obtained.
4. Results and discussion
In this section, simulation results of WDBP neural network model were provided first. Forecasting performance was also compared with a single BP neural network to illustrate the WDBP neural network model's advantage. To evaluate the performance of the forecast model, we assessed its accuracy based on the following formulae;
(4)
(4)
where yi and ti are the forecast and actual measured values, respectively. The standard methods were also used to evaluate regressors, including average relative error, average absolute error, Mean Squared Error (MSE) and R-squared coefficient.
The MSE values can be calculated as follow:
(5)
(5)
4.1. Simulation results of the WDBP neural network model
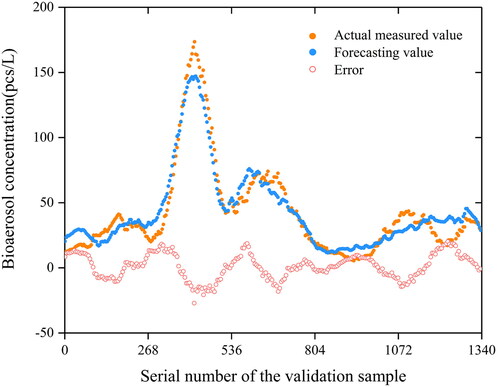
In this research, we fitted the predicted bioaerosol concentration forecast estimates generated by WDBP neural network model in actual measured values as shown in illustrated how the results of WDBP neural network model fit the actual measured value. The errors were also shown in .
Figure 4. The comparison between actual values and WDBP neural network model forecast estimates.
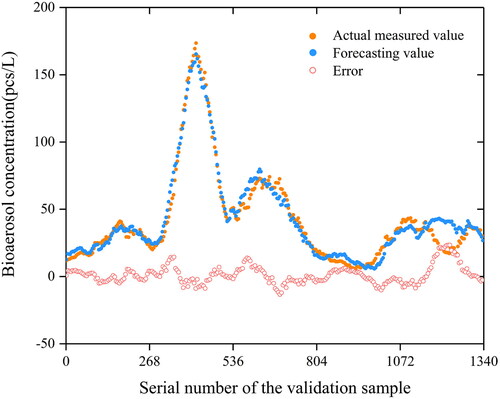
As illustrated in , the two graphs display almost perfect fit, demonstrating the accuracy of the WDBP neural network after wavelet de-noising. The relative error of the forecast results by WDBP neural network model was 8.75%, whereas the average absolute error was 1.22 pieces/L (pcs/L). Meanwhile, the MSE, R2 and the accuracy of the model were 0.06, 0.96 and 89.21, respectively. Together, these scores demonstrate the accuracy of WDBP neural network model in forecasting bioaerosol concentration.
4.2. Comparison between actual values and single BP neural network estimates
To validate the superiority of the WDBP neural network, the performance of single BP neural network was also compared with actual measures. As shown in , single BP neural network displayed slightly larger deviation from actual measurements. Details of the errors are shown in the same figure.
Figure 5. Relative deviation between actual measurements and the single BP neural network forecasting values.
Here, the average relative error between single BP neural network forecasting and actual measurements was 10.55%. On the other hand, the average absolute error, the MSE, R2 and the accuracy grade of forecast model were 2.80 pcs/L, 0.12, 0.93, and 84.01, respectively. Compared with WDBP neural network model, single BP neural network forecasting exhibited relatively larger margin errors for various performance parameters.
As illustrated in , the bioaerosol concentration forecasting performance of WDBP neural network is superior to that of single BP neural network under five key indicators.
Table 3. Comparative forecasting performance between WDBP and single BP neural network model.
5. Conclusions
In this study, we propose incorporation of wavelet transformation in WDBP neural network model for improving prediction of bioaerosol concentration influenced of meteorological factors. The hybrid model was developed to overcome inherent deficiencies in BP neural network, which lacks wavelet transformation de-noising.
Based on correlation analysis and PCA, the candidate input vectors for WBDP neural network model were confirmed. Then decomposed the original bioaerosol concentration data into low-frequency signals and high-frequency signals and established WDBP neural network based on aforesaid signals which are used to forecast bioaerosol concentration by meteorological factors. The WDBP neural network is also compared with the single BP neural network. The results showed that this WDBP neural network model was a satisfactory forecast model of bioaerosol concentration with the average relative error of 8.75%, which was better than the average relative error of 15.9% (PM10) of Chaloulakou's artificial neural networks (Chaloulakou, Grivas, and Spyrellis Citation2003). The average absolute error was 1.22 pcs/L and the accuracy grade of forecast model was 89.21, which was superior to the accuracy grade 84.72 (PM10), 84.13 (SO2), 83.46 (NO2) of Bai's BP neural network model based on wavelet transformation (Bai et al. Citation2016). R2 of the WDBP model was 0.96, which was better than 0.84 of De Gennaro's Neural network model (De Gennaro et al. Citation2013) and 0.65 of Chaloulakou's artificial neural networks (Chaloulakou, Grivas, and Spyrellis Citation2003). MSE of the WDBP model was 0.06, which was better than 6.87 of Bai's model (Bai et al. Citation2016). In addition, the forecasting accuracy of the WDBP neural network was higher than that of the single BP neural network.
Hence, WDBP neural network model was competent to forecast bioaerosol concentration accurately with better performance. Meanwhile, wavelet transformation is a reliable data set de-noising tool that may improve the performance of other forecasting methods. In one research, atmospheric pathogens accounted for about 5% of bioaerosols (Liu et al. Citation2018). This underscores the benefit of the bioaerosol concentration forecast model described in this research in monitoring environmental quality and public health.
Acknowledgments
We would like to express gratitude to Changsha Meteorological Bureau for providing the meteorological dataset used in this study. Special thanks to Huifenglong Economic and Technological Development Co. LTD for providing FDAI equipment. We also thank Huan Liu of Zhejiang University for her comments on this research. Dataset related to this study can be found at http://dx.doi.org/10.17632/bmtbd73nfm.1, an open-source online data repository hosted at Mendeley Data.
Disclosure statement
There is no conflict of interest.
Additional information
Funding
References
- Bai, Y., Y. Li, X. X. Wang, J. J. Xie, and C. Li. 2016. Air pollutants concentrations forecasting using back propagation neural network based on wavelet decomposition with meteorological conditions. Atmos. Pollut. Res. 7 (3):557–66. doi:https://doi.org/10.1016/j.apr.2016.01.004.
- Bai, Y., P. Wang, C. Li, J. J. Xie, and Y. Wang. 2014. A multi-scale relevance vector regression approach for daily urban water demand forecasting. J. Hydrol. 517:236–45. doi:https://doi.org/10.1016/j.jhydrol.2014.05.033.
- Chaloulakou, A., G. Grivas, and N. Spyrellis. 2003. Neural network and multiple regression models for PM10 prediction in Athens: A comparative assessment. J. Air. Waste. Manag. Assoc. 53 (10):1183–90. doi:https://doi.org/10.1080/10473289.2003.10466276.
- De Gennaro, G., L. Trizio, A. D. Gilio, J. Pey, N. Pérez, M. Cusack, A. Alastuey, and X. Quero. 2013. Neural network model for the prediction of PM10 daily concentrations in two sites in the Western Mediterranean. Sci. Total Environ. 463-464:875–83. doi:https://doi.org/10.1016/j.scitotenv.2013.06.093.
- Goswami, J. C., and A. K. Chan. 2011. Fundamentals of wavelets: Theory, algorithms, and applications. New York: John Wiley & Sons.
- He, Y. H., G. H. Zhou, C. L. Tang, S. G. Fan, and X. S. Guo. 2019. The spatial organization pattern of urban-rural integration in urban agglomerations in China: An agglomeration-diffusion analysis of the population and firms. Habitat. Int. 87:54–65. doi:https://doi.org/10.1016/j.habitatint.2019.04.003.
- Jolliffe, I. T., and J. Cadima. 2016. Principal component analysis: A review and recent developments. Philos. Trans. A. Math. Phys. Eng. Sci. 374 (2065):20150202. doi:https://doi.org/10.1098/rsta.2015.0202.
- Jones, R. H., S. Westra, and A. Sharma. 2010. Observed relationships between extreme sub-daily precipitation, surface temperature, and relative humidity. Geophys. Res. Lett. 37:L22805. doi:https://doi.org/10.1029/2010GL045081.
- Kim, K. H., E. Kabir, and S. A. Jahan. 2018. Airborne bioaerosols and their impact on human health. J. Environ. Sci. (China) 67:23–35. doi:https://doi.org/10.1016/j.jes.2017.08.027.
- Li, C., and M. Liang. 2011. Separation of the vibration-induced signal of oil debris for vibration monitoring. Smart Mater. Struct. 20 (4):045016. doi:https://doi.org/10.1088/0964-1726/20/4/045016.
- Li, X. N., X. Cheng, W. J. Wu, Q. H. Wang, Z. Y. Tong, X. Q. Zhang, D. H. Deng, and Y. H. Li. 2020. Forecasting of bioaerosol concentration by a back propagation neural network model. Sci. Total Environ. 698:134315. doi:https://doi.org/10.1016/j.scitotenv.2019.134315.
- Liu, H., Z. C. Hu, M. Zhou, J. J. Hu, X. W. Yao, H. Zhang, Z. Li, L. P. Lou, C. W. Xi, H. F. Qian, et al. 2019. The distribution variance of airborne microorganisms in urban and rural environments. Environ. Pollut. 247:898–906. doi:https://doi.org/10.1016/j.envpol.2019.01.090.
- Liu, H., Z. C. Hu, M. Zhou, H. H. Zhang, Z. Li, H. Zhang, J. J. Hu, X. W. Yao, L. P. Lou, C. W. Xi, et al. 2020. Airborne microorganisms exacerbate the formation of atmospheric ammonium and sulfate. Environ. Pollut. 263 (Pt A):114293. doi:https://doi.org/10.1016/j.envpol.2020.114293.
- Liu, H., X. Zhang, H. Zhang, X. W. Yao, M. Zhou, J. Q. Wang, Z. F. He, H. H. Zhang, L. P. Lou, W. H. Mao, et al. 2018. Effect of air pollution on the total bacteria and pathogenic bacteria in different sizes of particulate matter. Environ. Pollut. 233:483–93. doi:https://doi.org/10.1016/j.envpol.2017.10.070.
- Maya-Manzano, J. M., S. Fernández-Rodríguez, M. Smith, R. Tormo-Molina, A. M.Reynolds, I. Silva-Palacios, Á. Gonzalo-Garijo, and M. Sadyś. 2016. Airborne Quercus pollen in SW Spain: Identifying favourable conditions for atmospheric transport and potential source areas. Sci. Total Environ. 571:1037–47. doi:https://doi.org/10.1016/j.scitotenv.2016.07.094.
- Oduber, F., A. I. Calvo, C. Blanco-Alegre, A. Castro, A. M. Vega-Maray, R. M. Valencia-Barrera, D. Fernández-González, and R. Fraile. 2019. Links between recent trends in airborne pollen concentration, meteorological parameters and air pollutants. Agric. For. Meteorol. 264 (15):16–26. doi:https://doi.org/10.1016/j.agrformet.2018.09.023.
- Pöhlker, C., J. A. Huffman, J. D. Förster, and U. Pöschl. 2013. Autofluorescence of atmospheric bioaerosols: Spectral fingerprints and taxonomic trends of pollen. Atmos. Meas. Tech. 6 (12):3369–92. doi:https://doi.org/10.5194/amt-6-3369-2013.
- Ren, C., N. An, J. Z. Wang, L. Li, B. Hu, and D. Shang. 2014. Optimal parameters selection for BP neural network based on particle swarm optimization: A case study of wind speed forecasting. Knowl. Based. Syst. 56:226–39. doi:https://doi.org/10.1016/j.knosys.2013.11.015.
- Ren, Y., Y. Leng, Y. Cheng, and J. Wang. 2019. Secure data storage based on blockchain and coding in edge computing. Math. Biosci. Eng. 16 (4):1874–92. doi:https://doi.org/10.3934/mbe.2019091.
- Ren, Y., F. Zhu, P. K. Sharma, T. Wang, J. Wang, O. Alfarraj, and A. Tolba. 2019. Data query mechanism based on hash computing power of blockchain in Internet of Things. Sensors 20 (1):207. doi:https://doi.org/10.3390/s20010207.
- Wang, J. Z., J. J. Wang, Z. G. Zhang, and S. P. Guo. 2011. Forecasting stock indices with back propagation neural network. Expert. Syst. Appl. 38 (11):14346–55. doi:https://doi.org/10.1016/j.eswa.2011.04.222.
- Wang, L. P. 2020. Protocol for prevention and control of COVID-19 (Edition 6). Chinese Center for Disease Control and Prevention, Office of Infectious Disease Management. http://www.chinacdc.cn/en/COVID19/
- Wang, S. X., N. Zhang, L. Wu, and Y. M. Wang. 2016. Wind speed forecasting based on the hybrid ensemble empirical mode decomposition and GA-BP neural network method. Renew. Eng. 94:629–36. doi:https://doi.org/10.1016/j.renene.2016.03.103.