
 ?Mathematical formulae have been encoded as MathML and are displayed in this HTML version using MathJax in order to improve their display. Uncheck the box to turn MathJax off. This feature requires Javascript. Click on a formula to zoom.
Abstract
Exposure to respiratory droplets contributes greatly to the spread of SARS-CoV-2 virus during the COVID-19 pandemic. This study investigates the effectiveness of various face coverings to reduce cough-generated airborne particle concentrations at 0.3, 0.9, and 1.8 m away from the source in an indoor environment. We measured the particle number concentration (PNC) and particle size distribution under seven different conditions: (1) no face covering; (2) face shield only; (3) cloth mask; (4) face shield + cloth mask; (5) surgical mask; (6) face shield + surgical mask; (7) N95 respirator or equivalent (i.e., KN95 mask). We observed significant increases in PNCs at 0.3 m under conditions #1-4 and a trend toward an increase at 1.8 m, compared to the background. The face shield by itself provided little protection with a particle reduction of 4 ± 23% relative to no face covering, while the cloth masks reduced the particles by 77 ± 7%. Surgical and N95/KN95 masks performed well and substantially reduced the cough droplets to ≤6% at 0.3 m. In this study, most cough-generated particles were found less than 2.5 µm with an average mode diameter of ∼0.6 µm at 0.3 m. Approximately 80% of the particles ≤2.5 µm were able to travel to 0.9 m, and 10% of the particles ≤1.1 µm likely reached 1.8 m. Based on these results, face coverings, especially surgical and N95/KN95 masks, should be recommended as effective preventive measures to reduce outward transport of respiratory droplets during the COVID-19 pandemic.
Copyright © 2020 American Association for Aerosol Research
EDITOR:
1. Introduction
The COVID-19 outbreak caused by a novel coronavirus referred to as SARS-CoV-2 has resulted in more than 1.1 million deaths in 189 countries/regions as of 26 October, 2020 (Johns Hopkins University Citation2020). One of the major routes of human to human transmission is the inhalation of respiratory droplets produced by infected individuals through coughing, sneezing, and even talking or breathing within a close proximity of 1.8 m (Acter et al. Citation2020; Ma et al. Citation2020; Xie et al. Citation2007). Although larger droplets usually settle quickly within a short distance from the origin, smaller particles can travel longer distances (Morawska Citation2006; Morawska and Cao Citation2020; Morawska et al. Citation2009; Morawska and Milton Citation2020). A recent study has shown that airborne particles associated with SARS-CoV-2 were smaller than 5.0 µm in two Wuhan hospitals during the outbreak (Liu et al. Citation2020). These virus-laden particles remain viable and suspended in the air for hours (Morawska Citation2006; van Doremalen et al. Citation2020), which may contribute to the airborne transmission of COVID-19.
To reduce the risk of infection via the transmission of respiratory droplets, various mitigation measures such as wearing face coverings, including face masks and face shields, have been implemented by governmental agencies worldwide (Chu et al. 2020; WHO Citation2020b). The use of face coverings has been found effective in reducing infection risk. Research has shown that higher-grade respiratory masks (e.g., N95 respirator) were associated with lower infection risk compared to surgical and home-made cloth masks (Chu et al. 2020; MacIntyre et al. Citation2015; van der Sande et al. Citation2008; Wang et al. Citation2020). Extensive studies have assessed the inward filtration efficiency of different face coverings to protect wearers from the environment (Konda et al. Citation2020; Lindsley et al. Citation2014; Steinle et al. Citation2018; van der Sande et al. Citation2008; Weber et al. Citation1993; Zhao et al. Citation2020; Zhou et al. Citation2018). However, few studies have focused on the effectiveness of face coverings against the outward transport of respiratory droplets (Mittal et al. Citation2020).
Since both symptomatic and asymptomatic carriers of SARS-CoV-2 can be potential infection sources (Bai et al. Citation2020; Buonanno et al. Citation2020; Ye et al. Citation2020), the outward protection provided by face coverings to mitigate the spread of respiratory droplets is particularly important during the COVID-19 pandemic. Leung et al. (Citation2020) found that surgical mask contributed to the reduction of coronavirus shedding in exhaled breath. Although the outward respiratory leakage from different face masks has been investigated by qualitative visualizations (Bahl et al. Citation2020; Kahler and Hain Citation2020; Verma et al. Citation2020), quantitative measurements have been scarce. Fischer et al. (Citation2020) have evaluated the efficacy of using various face masks to obstruct speech particles expelled into an enclosure with a small volume ∼0.03 m3. However, a gap of knowledge still exists in the outward transport of respiratory particles that escape to an indoor environment with larger dilution. In addition, violent expiratory events like coughing with high jet velocities would degrade the performance of outward protection using face coverings (Lai et al. Citation2012) and thus need to be better understood. Moreover, limited information is known about the size distributions of respiratory aerosols coming out through face coverings and how far they can move in an indoor environment.
The U.S. Centers for Disease Control and Prevention currently advises staying 6 feet (i.e., 1.8 m) apart from other people in both indoor and outdoor environments, as a mitigation measure in response to the COVID-19 pandemic (CDC Citation2020b). Because the potential airborne hazard indoors may be different from outdoors with sufficient ventilation (Correia et al. Citation2020; Morawska et al. 2020), it is reasonable to be more cautious about assessing the respiratory aerosol exposure within 1.8 m indoors (Morawska and Milton Citation2020). With this context, the purpose of this study is to: (1) determine the particle number concentration (PNC) and particle size distributions at 0.3, 0.9, and 1.8 m away from a coughing source in an indoor environment, and (2) evaluate the effectiveness of different face coverings on obstructing cough-generated airborne particles at 0.3, 0.9, and 1.8 m away from a coughing source.
2. Materials and methods
2.1. Experimental setup and protocol
Measurements were conducted in a 138 m3 (8.7 m × 5.8 m × 2.7 m) HEPA-filtered laboratory room, which is located in UCLA Center for the Health Sciences (schematic diagram is shown in online supplementary information [SI] ). To minimize the effects of infiltration of outdoor air, doors and windows connecting to other spaces were sealed. Central ventilation was fully operating during the experiments. The room temperature and relative humidity were maintained at 25 ± 1 °C and 54 ± 5%, respectively. The air exchange rate was 2.3 h−1 based on the tracer gas method (Batterman Citation2017).
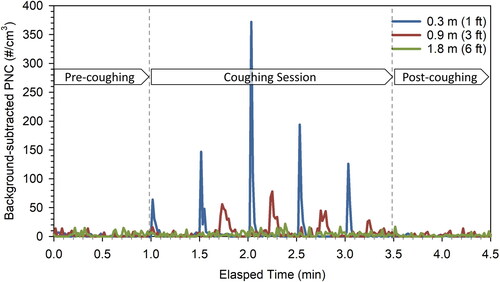
Figure 1. The time series of background-subtracted PNC at three locations, 0.3, 0.9, and 1.8 m away from the volunteer at condition #1 no face covering.
A healthy volunteer sat on a chair facing the sampling instrument and followed a prescribed coughing protocol. The volunteer was instructed to wear each face covering properly before sampling started. Each sampling session lasted for 4.5 min, which included a 1-min pre-coughing session, a 2.5-min coughing session with a total of 5 coughs generated, and a 1-min post-coughing session (see ). A cough was generated every 30 s at an intensity, which the volunteer felt comfortable with. This procedure was repeated three times using each type of face covering. A total of ten different types of face coverings, grouped into seven categories, were tested to evaluate the effectiveness of different face coverings in mitigating cough-generated airborne particles: (1) no face covering; (2) face shield only; (3) cloth mask; (4) face shield + cloth mask; (5) surgical mask; (6) face shield + surgical mask; (7) N95 respirator or equivalent (i.e., KN95 mask). The characteristics of the seven face covering conditions are summarized in . Two types of cloth masks, i.e., 2-layer 100% cotton and 3-layer 50% cotton/50% polyester blend, were selected in this study based on U.S. Centers for Disease Control and Prevention recommended two or more layers of washable, breathable fabric (CDC Citation2020a). In addition, we randomly tested surgical masks from two different manufacturers, considering the variability of product quality. Under condition #7, N95 respirator and KN95 mask were tested separately. We did not attempt to assess all the commercially available face coverings but focused on major categories of face coverings that are representative and commonly used by the general public.
Table 1. Characteristics of the seven face covering conditions.
2.2. Measurements and instrumentation
We measured real-time PNC with a size ranging from 0.01 to greater than 1 µm during each sampling session. Measurement instruments were set up at three locations (as shown in SI ): 0.3, 0.9, and 1.8 m away from the volunteer. The sampling inlets of all instruments were set along the centerline that the volunteer was facing. At each sampling location, a Condensation Particle Counter (CPC 3007, TSI Inc., Shoreview, MN, USA) or a Water-Based Condensation Particle Counter (WCPC 3787, TSI Inc.) was used to monitor the PNC. The data logging interval was set to 1 s for all instruments. Before each experiment, the PNC in the room was maintained at a background level of less than 50 particles/cm3 by using three HEPA air purifiers to enhance signal to noise ratios.
An Aerodynamic Particle Sizer (APS 3321, TSI Inc.) was used to measure particle size distribution within the size range of 0.5-19.8 µm. The sampling inlet of APS was placed at 0.3, 0.9, and 1.8 m for each of the three sampling sessions, respectively. In addition, an indoor air quality monitor (Q-Trak 7575, TSI Inc.) was used to measure temperature, relative humidity, and CO2 concentration in the room. A hot wire anemometer (Model 850024, Sper Scientific Ltd., Scottsdale, AZ, USA) was used to measure the peak expiratory velocity (m/s) during coughing. The peak expiratory flow rate (L/min) was determined by multiplying the peak expiratory velocity by the mouth opening area (i.e., 7.0 cm2) (Gupta et al. Citation2009). To ensure that the data from different instruments were comparable, a 30-min collocation test was conducted for each experiment. To address cough-to-cough variations due to an unstable coughing source, 15 repeated measurements were conducted under each face covering condition.
2.3. Data analysis
At each sampling location, we identified the peak particle concentration associated with each cough. The average of 5-s PNCs before and containing the peak value was denoted as the “background” and “during coughing,” respectively. A Mann-Whitney U test was used to compare the PNC measured at the background versus during coughing. In addition, we defined the percentage of particle reduction as the proportion of cough-generated particles reduced by face coverings measured at 0.3 m away from the volunteer relative to no face covering:
(1)
(1)
Likewise, the 1-s peak particle size distributions for each cough were averaged at each sampling location. The arithmetic mean and standard error of the percentage of particle reduction, PNC, and particle size distribution were calculated for each face covering condition. R 3.4.0 and Microsoft Excel 2016 (Microsoft, Seattle, WA, USA) were used to summarize data and perform statistical analysis. All figures were generated with Sigmaplot 14.0 (Systat Software Inc., San Jose, CA, USA). The level of statistical significance was set at p < 0.05.
3. Results and discussion
3.1. PNC for coughing without face covering
The temporal variations of PNC in a representative sampling session without face covering at three locations (i.e., 0.3, 0.9, and 1.8 m away from the volunteer) are shown in (see SI for data collected in other sampling sessions and SI for PNC ratios of sampling sessions relative to pre-coughing). Without any face coverings, the background-subtracted peak PNC reached up to 372 particles/cm3 at 0.3 m immediately after coughing and decreased to a near-background level within 2–3 s, which is in agreement with previous studies (Bourouiba et al. Citation2014; Nishimura et al. Citation2013). When moving to 0.9 and 1.8 m, the mean PNCs were reduced to 47 ± 7% and 10 ± 5%, respectively, of what was measured at 0.3 m.
Figure 2. Background-subtracted PNCs at 0.3, 0.9, and 1.8 m away from the volunteer under #1 no face covering condition and #2-10 face coverings conditions. Error bars show the standard error of the mean. The Mann-Whitney U test was used to compare the PNC during coughing vs. background level. *p ≤ 0.05, **p ≤ 0.01, ***p ≤ 0.001.
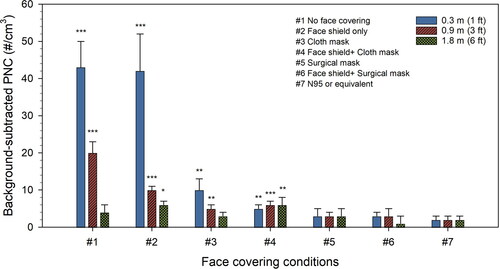
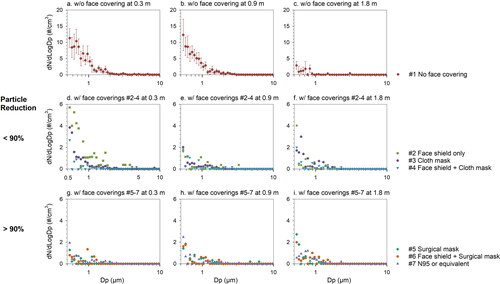
Figure 3. Background-subtracted particle size distributions of cough-generated airborne particles under different face covering conditions at 0.3, 0.9, and 1.8 m away from the volunteer. Error bars show the standard error of the mean. Please note different scale on Y-axis.
The cough-generated particles were shown to travel to 0.9 m within 4–26 s (with an average of 16 ± 7 s) across all 15 coughs generated by the volunteer ( and SI ). This wide time range is likely due to the complexity associated with three factors: (1) how fast the cough droplets evaporate into smaller sizes depends on the initial particle size, room temperature and relative humidity (Morawska Citation2006; Morawska et al. Citation2009; Xie et al. Citation2007), (2) environmental airflow that governs the diffusion of particles that lost their momentum given by the cough immediately (Nishimura et al. Citation2013), and (3) the cough-to-cough variations due to an unstable coughing source. Moreover, it took 10–30 s (with an average of 19 ± 7 s) for the particles to travel from 0.9 to 1.8 m. A previous study reported that cough droplets cannot travel more than 2 m in a space with stagnant surrounding air (Dbouk and Drikakis Citation2020). In this study, however, the central ventilation produced an air exchange rate of 2.3 h−1 in the laboratory room, which was much higher than one would expect in stagnant air, thus it may enhance the transport of cough particles. It should be noted that the average peak flow rate of the cough from the volunteer in this study was 20.5 ± 3.2 L/min, which was considerably lower than that reported in a clinical study of up to 200 L/min (Salam et al. Citation2004). Since the distance traveled by droplets in the indoor environment heavily relies on the initial air jet velocity (Xie et al. Citation2007), the transport of the cough droplets observed in this study may represent a conservative estimate. Should the peak flow rate increase, one would expect cough-generated particles to travel even farther.
3.2. Mitigation by different face coverings indoors
The background-subtracted mean PNC at 0.3 m under each face covering condition and the corresponding percentage of particle reduction are summarized in . Surgical mask with/without the face shield and N95 respirator or KN95 mask reduced cough-generated particles by ≥94%. Because surgical mask have been found to reduce the SARS-CoV-2 virus in respiratory droplets, especially for particles ≤5 µm (Leung et al. Citation2020), we can expect a similar or even better performance using an N95 respirator or KN95 mask. Other face coverings including cloth mask and the combination of face shield and cloth mask provided moderate protection with percentage of particle reduction ranging from 77 to 89%. In contrast, the face shield-only condition had an extremely low percentage of particle reduction (i.e., 4 ± 23%). This is likely because the face shield does not fit the face snugly, and thus, cough droplets can escape from the open gaps around the shield. These escaped droplets representing the cough-to-cough variation are subsequently affected by the changing environmental airflow in the room, leading to even more variations in the performance of the face shield. The filtration efficiencies for face masks made by fabrics were reported to have a wide range depending on the fabric materials and number of layers (Zhao et al. Citation2020). In addition to the filtration capacity relying on the mask material, the “snug fit” of a mask is also important in reducing the leakage of respiratory droplets especially during violent expiratory events like coughing (Kahler and Hain Citation2020; Verma et al. Citation2020). The loose-fitting face coverings such as fabric masks without the adjustable nose clip may lead to more leakage around the nose compared to surgical mask and N95 respirator. Unlike our measurements at 0.3 m in an indoor environment, Fischer et al. (Citation2020) have evaluated the efficacy of various face masks to obstruct speech particles from the source, showing similar results that speech particles escaped through bandana and neck gaiter easily. One potential confounding factor which is worth noting here is particle shedding from the mask. Asadi et al. (Citation2020) found that when masks were hand-rubbed, more particles were coming off home-made ones compared to N95 respirator and surgical mask. The relative contribution of particles from shedding of the mask warrants future studies.
The background-subtracted PNC during coughing at 0.3, 0.9, and 1.8 m under different face covering conditions is presented in (see SI Figure S4 for the comparison between the PNC at the background and during coughing). Compared to the background level, there were no significant PNC increases at all three locations using surgical mask, N95 respirator or KN95 mask, as well as the face shield together with a surgical mask. A previous study found that the inward protection was more efficient than the outward protection for a home-made cloth mask, a surgical mask, and a N95 respirator (van der Sande et al. Citation2008). Thus, it would be reasonable to expect that the inward protection for these face coverings might be higher than the outward protection shown in this study. In contrast, significant increases in PNCs were observed at 0.3 and 0.9 m when the face shield, cloth mask, and their combinations were used. Our results provide evidence showing that these face coverings could not prevent the spreading of cough droplets at 0.9 m, although it was indicated as a safe distance to avoid aerosol transmission by the World Health Organization (WHO Citation2020a). Furthermore, significant increases of ∼6 particles/cm3 at 1.8 m were found under two face covering conditions (i.e., #2 and 4), indicating that the current physical-distancing guideline (i.e., 6 feet) from the U.S. Centers for Disease Control and Prevention may not provide sufficient protection (CDC Citation2020b).
3.3. Cough-generated particle size distributions
The background-subtracted particle size distributions of respiratory droplets due to coughing with and without face coverings at different locations are shown in . Unlike previous studies that reported a larger droplet size with the mode ∼8–15 µm (Bourouiba et al. Citation2014; Duguid Citation1946; Yang et al. Citation2007), about 99% of the cough droplets were found less than 2.5 µm with an average mode diameter of ∼0.6 µm in this study. The scarcity of particles greater than 5 µm detected in this study suggested an instant evaporation of respiratory droplets after released into the indoor environment. Approximately 80% of the particles ≤2.5 µm were able to travel to 0.9 m and 10% of the particles ≤1.1 µm likely reached 1.8 m. The decreasing trend in particle size with increasing distance further confirmed that smaller droplets tend to travel farther away more readily than larger particles (Morawska Citation2006; Morawska et al. Citation2009). Additionally, SARS-CoV-2 aerosols were mainly detected in size ranges of 0.25–1 and 2.5–5 µm, which are similar to the cough-generated particles, in two Wuhan hospitals during the COVID-19 outbreak (Liu et al. Citation2020), demonstrating the potential of virus-laden particles to be suspended in the air and transport to farther distance.
Under condition #2 face shield only, the particle levels at most sizes (i.e., 0.54–5 µm) were higher than those of other face coverings at 0.3 m. In contrast, the cloth mask performed better for particles >1 µm but not for smaller particles. Small particles (i.e., <0.7 µm) were more likely to be observed at 1.8 m using face coverings with particle reduction <90%. Other face coverings with particle reduction >90% showed a near-background size distribution at all three locations. We observed good performance in mitigating particles ≥0.54 µm under conditions #4 (i.e., the combination of face shield and cloth mask) at both 0.9 and 1.8 m. However, this finding contradicts the results in , which shows significant increases in PNCs at 0.9 and 1.8 m. This is presumably because particles smaller than 0.54 µm could not be detected by the APS. Similar results regarding the filtration efficiency have been obtained by Liu and Zhao (Citation2020) that cloth masks showed lower efficiency in both submicron and supermicron regions compared to N95 respirator and surgical masks. Because the cough-generated particles leaking through the face coverings were most abundant in the submicron size range with the virus-laden potential (Liu et al. Citation2020), the different abilities of face coverings to mitigate respiratory droplets should be taken carefully into consideration in order to defend against COVID-19.
There are several limitations in the current study. First, the current findings were obtained under a specific indoor condition. Many recent studies have pointed out that poor exhaust ventilation may contribute to the transmission of the virus (Buonanno et al. Citation2020; Correia et al. Citation2020; Vuorinen et al. 2020). The fate of respiratory droplets in the indoor environment can be affected by a variety of factors such as temperature, relative humidity, and air exchange rate (Morawska Citation2006; Xie et al. Citation2007). Second, there is a large inter-person variability in the respiratory particle concentrations, saliva contents, and expelling speeds of cough droplets (Morawska Citation2006; Yang et al. Citation2007). Thus, results from this study should be generalized with caution. Future research should examine strategic mitigation measures that are explicitly for indoor environments to reduce aerosol transmission (Morawska et al. 2020; Prather et al. Citation2020).
4. Conclusions
This study assessed the effectiveness of different face coverings against the outward transport of respiratory particles in an indoor environment. At 0.3 m from the coughing source, face shield by itself provided the least protection (i.e., 4%). In contrast, cloth mask reduced cough particles by 77%, and the combination of face shield and cloth mask improved the particle reduction to 89%. Surgical mask and N95 respirator/KN95 mask offered excellent protection and substantially reduced cough droplets >94%. Although cloth masks did not perform as well as N95 respirator/KN95 mask and surgical mask, they could still serve as a simple barrier to help reduce the spread of respiratory droplets and likely decrease the infection risk of COVID-19. Respiratory particles generated by coughing, especially small particles, tend to reach 1.8 m away from the source even with face coverings. Thus, to minimize the infection risk of aerosol transmission, stricter mitigation measures should be adopted for indoor environments, which are more likely to be enclosed and crowded.
Supplemental Material
Download MS Word (1.1 MB)Acknowledgments
The authors sincerely thank Dr. Shane Que Hee for providing the hot wire anemometer and the volunteer who participated in the experiments.
Additional information
Funding
References
- Acter, T., N. Uddin, J. Das, A. Akhter, T. R. Choudhury, and S. Kim. 2020. Evolution of severe acute respiratory syndrome coronavirus 2 (SARS-CoV-2) as coronavirus disease 2019 (COVID-19) pandemic: A global health emergency. Sci. TotalEnviron. 730:138996. doi:https://doi.org/10.1016/j.scitotenv.2020.138996.
- Asadi, S., C. D. Cappa, S. Barreda, A. S. Wexler, N. M. Bouvier, and W. D. Ristenpart. 2020. Efficacy of masks and face coverings in controlling outward aerosol particle emission from expiratory activities. Sci. Rep. 10 (1):15665. doi:https://doi.org/10.1038/s41598-020-72798-7.
- Bahl, P., S. Bhattacharjee, C. de Silva, A. A. Chughtai, C. Doolan, and C. R. MacIntyre. 2020. Face coverings and mask to minimise droplet dispersion and aerosolisation: a video case study. Thorax 75:215748.
- Bai, Y., L. Yao, T. Wei, F. Tian, D.-Y. Jin, L. Chen, and M. Wang. 2020. Presumed Asymptomatic Carrier Transmission of COVID-19. JAMA 323 (14):1406–7. doi:https://doi.org/10.1001/jama.2020.2565.
- Batterman, S. 2017. Review and Extension of CO2-Based Methods to Determine Ventilation Rates with Application to School Classrooms. IJERPH 14 (2):145.
- Bourouiba, L., E. Dehandschoewercker, and J. W. M. Bush. 2014. Violent expiratory events: on coughing and sneezing. J. Fluid Mech. 745:537–63.
- Buonanno, G., L. Stabile, and L. Morawska. 2020. Estimation of airborne viral emission: Quanta emission rate of SARS-CoV-2 for infection risk assessment. Environ. Int. 141:105794.
- CDC 2020a. How to Select, Wear, and Clean Your Mask. Centers for Disease Control and Prevention., Centers for Disease Control and Prevention, Centers for Disease Control and Prevention.
- CDC 2020b. Social distancing, quarantine, and isolation. Centers for Disease Control and Prevention. Centers for Disease Control and Prevention
- Chu, D. K., E. A. Akl, S. Duda, K. Solo, S. Yaacoub, H. J. Schünemann, D. K. Chu, E. A. Akl, A. El-Harakeh, A. Bognanni, et al. 2020. Physical distancing, face masks, and eye protection to prevent person-to-person transmission of SARS-CoV-2 and COVID-19: a systematic review and meta-analysis. The Lancet 395 (10242):1973–87. doi:https://doi.org/10.1016/S0140-6736(20)31142-9.
- Correia, G., L. Rodrigues, M. Gameiro da Silva, and T. Gonçalves. 2020. Airborne route and bad use of ventilation systems as non-negligible factors in SARS-CoV-2 transmission. Med. Hypotheses. 141:109781. doi:https://doi.org/10.1016/j.mehy.2020.109781.
- Dbouk, T., and D. Drikakis. 2020. On coughing and airborne droplet transmission to humans. Phys. Fluids(1994)32 (5):053310. doi:https://doi.org/10.1063/5.0011960.
- Duguid, J. P. 1946. The size and the duration of air-carriage of respiratory droplets and droplet-nuclei. J. Hyg.(Lond) 44 (6):471–9. doi:https://doi.org/10.1017/s0022172400019288.
- Fischer, E. P., M. C. Fischer, D. Grass, I. Henrion, W. S. Warren, and E. Westman. 2020. Low-cost measurement of facemask efficacy for filtering expelled droplets during speech. Science Advances:eabd3083.
- Gupta, J. K., C. H. Lin, and Q. Chen. 2009. Flow dynamics and characterization of a cough. Indoor Air. 19 (6):517–25. doi:https://doi.org/10.1111/j.1600-0668.2009.00619.x.
- Johns Hopkins University. 2020. COVID-19 Dashboard by the Center for Systems Science and Engineering (CSSE) at John Hopkins University, Johns Hopkins University. https://coronavirus.jhu.edu/map.html
- Kahler, C. J., and R. Hain. 2020. Fundamental protective mechanisms of face masks against droplet infections. J. Aerosol Sci. 148:105617.
- Konda, A., A. Prakash, G. A. Moss, M. Schmoldt, G. D. Grant, and S. Guha. 2020. Aerosol Filtration Efficiency of Common Fabrics Used in Respiratory Cloth Masks. ACS Nano 14 (5):6339–47.
- Lai, A. C. K., C. K. M. Poon, and A. C. T. Cheung. 2012. Effectiveness of facemasks to reduce exposure hazards for airborne infections among general populations. J. RSoc. Interface 9 (70):938–48. doi:https://doi.org/10.1098/rsif.2011.0537.
- Leung, N. H. L., D. K. W. Chu, E. Y. C. Shiu, K.-H. Chan, J. J. McDevitt, B. J. P. Hau, H.-L. Yen, Y. Li, D. K. M. Ip, J. S. M. Peiris, et al. 2020. Respiratory virus shedding in exhaled breath and efficacy of face masks. Nat. Med. 26 (5):676–80. doi:https://doi.org/10.1038/s41591-020-0843-2.
- Lindsley, W. G., J. D. Noti, F. M. Blachere, J. V. Szalajda, and D. H. Beezhold. 2014. Efficacy of Face Shields Against Cough Aerosol Droplets from a Cough Simulator. J. Occup. Environ. Hyg. 11 (8):509–18. doi:https://doi.org/10.1080/15459624.2013.877591.
- Liu, Y., Z. Ning, Y. Chen, M. Guo, Y. Liu, N. K. Gali, L. Sun, Y. Duan, J. Cai, D. Westerdahl, et al. 2020. Aerodynamic analysis of SARS-CoV-2 in two Wuhan hospitals. Nature 582 (7813):557–60. doi:https://doi.org/10.1038/s41586-020-2271-3.
- Liu, Y., and B. Zhao. 2020. Size-dependent filtration efficiencies of face masks and respirators for removing SARS-CoV-2–laden aerosols. Infect. Control Hospital Epidemiol. 1–2. doi:https://doi.org/10.1017/ice.2020.366
- Ma, J., X. Qi, H. Chen, X. Li, Z. Zhan, H. Wang, L. Sun, L. Zhang, J. Guo, L. Morawska, et al. 2020. Exhaled breath is a significant source of SARS-CoV-2 emission. medRxiv:2020.2005.2031.20115154.
- MacIntyre, C. R., H. Seale, T. C. Dung, N. T. Hien, P. T. Nga, A. A. Chughtai, B. Rahman, D. E. Dwyer, and Q. Wang. 2015. A cluster randomised trial of cloth masks compared with medical masks in healthcare workers. BMJ Open. 5 (4):e006577e006577 doi:https://doi.org/10.1136/bmjopen-2014-006577.
- Mittal, R., R. Ni, and J.-H. Seo. 2020. The flow physics of COVID-19. J. Fluid Mech. 894:F2.
- Morawska, L. 2006. Droplet fate in indoor environments, or can we prevent the spread of infection? Indoor Air. 16 (5):335–47. doi:https://doi.org/10.1111/j.1600-0668.2006.00432.x.
- Morawska, L., and J. Cao. 2020. Airborne transmission of SARS-CoV-2: The world should face the reality. Environ. Int. 139:105730. doi:https://doi.org/10.1016/j.envint.2020.105730.
- Morawska, L., G. R. Johnson, Z. D. Ristovski, M. Hargreaves, K. Mengersen, S. Corbett, C. Y. H. Chao, Y. Li, and D. Katoshevski. 2009. Size distribution and sites of origin of droplets expelled from the human respiratory tract during expiratory activities. J. AerosolSci. 40 (3):256–69.
- Morawska, L., and D. K. Milton. 2020. It is Time to Address Airborne Transmission of COVID-19. Clin Infect Dis. 1–4. doi: https://doi.org/10.1093/cid/ciaa939
- Morawska, L., J. L. W. Tang, W. Bahnfleth, P. M. Bluyssen, A. Boerstra, G. Buonanno, J. J. Cao, S. Dancer, A. Floto, F. Franchimon, et al. 2020. How can airborne transmission of COVID-19 indoors be minimised. Environ. Int. 142:105832.
- Nishimura, H., S. Sakata, and A. Kaga. 2013. A New Methodology for Studying Dynamics of Aerosol Particles in Sneeze and Cough Using a Digital High-Vision, High-Speed Video System and Vector Analyses. Plos One. 8 (11):e80244.
- Prather, K. A., C. C. Wang, and R. T. Schooley. 2020. Reducing transmission of SARS-CoV-2. Science 368 (6498):1422–4. doi:https://doi.org/10.1126/science.abc6197.
- Salam, A., L. Tilluckdharry, Y. Amoateng-Adjepong, and C. A. Manthous. 2004. Neurologic status, cough, secretions and extubation outcomes. Intensive Care Med. 30 (7):1334–9. doi:https://doi.org/10.1007/s00134-004-2231-7.
- Steinle, S.,. A. Sleeuwenhoek, W. Mueller, C. J. Horwell, A. Apsley, A. Davis, J. W. Cherrie, and K. S. Galea. 2018. The effectiveness of respiratory protection worn by communities to protect from volcanic ash inhalation. Part II: Total inward leakage tests. Int. J. Hyg. Environ. Health. 221 (6):977–84. doi:https://doi.org/10.1016/j.ijheh.2018.03.011.
- van der Sande, M., P. Teunis, and R. Sabel. 2008. Professional and Home-Made Face Masks Reduce Exposure to Respiratory Infections among the General Population. Plos One. 3 (7):e2618.
- van Doremalen, N., T. Bushmaker, D. H. Morris, M. G. Holbrook, A. Gamble, B. N. Williamson, A. Tamin, J. L. Harcourt, N. J. Thornburg, S. I. Gerber, et al. 2020. Aerosol and Surface Stability of SARS-CoV-2 as Compared with SARS-CoV-1. N Engl J Med 382 (16):1564–7. doi:https://doi.org/10.1056/NEJMc2004973.
- Verma, S., M. Dhanak, and J. Frankenfield. 2020. Visualizing the effectiveness of face masks in obstructing respiratory jets. Phys Fluids (1994) 32 (6):061708 doi:https://doi.org/10.1063/5.0016018.
- Vuorinen, V.,. M. Aarnio, M. Alava, V. Alopaeus, N. Atanasova, M. Auvinen, N. Balasubramanian, H. Bordbar, P. Erästö, R. Grande, et al. 2020. Modelling aerosol transport and virus exposure with numerical simulations in relation to SARS-CoV-2 transmission by inhalation indoors. Saf. Sci. 130:104866 doi:https://doi.org/10.1016/j.ssci.2020.104866.
- Wang, X., Z. Pan, and Z. Cheng. 2020. Association between 2019-nCoV transmission and N95 respirator use. medRxiv:2020.2002.2018.20021881.
- Weber, A., K. Willeke, R. Marchloni, T. Myojo, R. McKay, J. Donnelly, and F. Liebhaber. 1993. Aerosol penetration and leakae characteristics of masks used in the health care industry. American Journal of Infection Control 21 (4):167–73.
- WHO 2020a. Coronavirus disease (COVID-19) advice for the public, World Health Organization. https://www.who.int/emergencies/diseases/novel-coronavirus-2019/advice-for-public
- WHO 2020b. Coronavirus disease (COVID-19) advice for the public: When and how to use masks, World Health Organization. https://www.who.int/emergencies/diseases/novel-coronavirus-2019/advice-for-public/when-and-how-to-use-masks
- Xie, X.,. Y. Li, A. T. Y. Chwang, P. L. Ho, and W. H. Seto. 2007. How far droplets can move in indoor environments-revisiting the Wells evaporation-falling curve. Indoor Air. 17 (3):211–25. doi:https://doi.org/10.1111/j.1600-0668.2007.00469.x.
- Yang, S., G. W. M. Lee, C.-M. Chen, C.-C. Wu, and K.-P. Yu. 2007. The Size and Concentration of Droplets Generated by Coughing in Human Subjects. J Aerosol Med 20 (4):484–94. doi:https://doi.org/10.1089/jam.2007.0610.
- Ye, F., S. Xu, Z. Rong, R. Xu, X. Liu, P. Deng, H. Liu, and X. Xu. 2020. Delivery of infection from asymptomatic carriers of COVID-19 in a familial cluster. Int. J. Infect. Dis. 94:133–8. doi:https://doi.org/10.1016/j.ijid.2020.03.042.
- Zhao, M., L. Liao, W. Xiao, X. Z. Yu, H. T. Wang, Q. Q. Wang, Y. L. Lin, F. S. Kilinc-Balci, A. Price, L. Chu, et al. 2020. Household Materials Selection for Homemade Cloth Face Coverings and Their Filtration Efficiency Enhancement with Triboelectric Charging. Nano Lett. 20 (7):5544–52. doi:https://doi.org/10.1021/acs.nanolett.0c02211.
- Zhou, S. S., S. Lukula, C. Chiossone, R. W. Nims, D. B. Suchmann, and M. K. Ijaz. 2018. assessment of a respiratory face mask for capturing air pollutants and pathogens including human influenza and rhinoviruses. J. Thorac. Dis. 10 (3):2059–69. doi:https://doi.org/10.21037/jtd.2018.03.103.