
 ?Mathematical formulae have been encoded as MathML and are displayed in this HTML version using MathJax in order to improve their display. Uncheck the box to turn MathJax off. This feature requires Javascript. Click on a formula to zoom.
Abstract
Measuring the aerosol particle size of electronic cigarettes can be particularly challenging due to the volatile and dynamic nature of these aerosols. In particular, electronic cigarette aerosol particle size measurements may be convoluted by evaporation due to the high dilution ratios and coagulation when there are long residence times between sampling and measurement. To address these measurement issues, we have developed a particle size measurement system using a low flow cascade impactor with a sampling system that is capable of generating a puff on an e-cigarette and directly introducing the aerosol into the inlet flow of the impactor. The system has been used to investigate factors that may affect the aerosol size distribution, including puffing conditions, carrier composition and device construction. It was found that decreasing the puff flow rate from 2 to 0.5 L/min at a constant puff duration of 5 s, the mass median aerodynamic diameter (MMAD) of the aerosol size distribution increased from 0.5 to 1.1 µm. Increasing the mass delivery from 0.67 to 6 mg/5 s puff also resulted in increasing MMAD from 0.48 to 0.87 µm. Furthermore, the addition of a small amount of glycerin (1% by weight) to a propylene glycol based flavor formulation caused a decrease in the MMAD, while the other factors studied did not have a significant effect on the MMAD.
Copyright © 2020 American Association for Aerosol Research
EDITOR:
1. Introduction
Electronic cigarettes (ECs) and other e-vapor products produce a highly concentrated inhalation aerosol by an evaporation/condensation process. These products, which are available in a variety of sizes, wick and coil configurations, and flavor formulations, electronically heat a solution consisting primarily of propylene glycol (PG), glycerol (GLY), nicotine, water and flavors. The hot vapor is then rapidly cooled as it is drawn through the device by the user, causing it to nucleate and condense into an aerosol. For inhalation aerosols such as those produced by ECs, the particle size distribution is an important property because it, along with other dynamic properties, determines the probability of particle deposition at different sites within the respiratory tract. Therefore, the particle size distribution is essential to predicting the dose delivered by an EC.
To better understand the deposition in respiratory tract, there has been an increase in the number of published reports on the particle size of “mainstream” EC aerosols (Alderman et al. Citation2014; Alderman and Ingebrethsen Citation2011; Baassiri et al. Citation2017; Dunkhorst, Lipowicz, and Koch Citation2016; Fuoco et al. Citation2014; Ingebrethsen, Cole, and Alderman Citation2012; Manigrasso et al. Citation2015, Citation2017; Mikheev et al. Citation2016; Sundahl, Berg, and Svensson Citation2017; Zhang, Sumner, and Chen Citation2013). Mainstream aerosol refers to the direct introduction of the effluent aerosol from the EC to the user or sampling system. Other researchers collected the aerosol in a chamber prior to sampling into the measurement systems (McAuley et al. Citation2012; Zhao et al. Citation2016). This indirect sampling of the aerosol is less relevant to determining both the particle size of the effluent aerosol and the dose delivered to the user, due to the dynamic nature of the e-vapor aerosol as discussed below.
The studies on mainstream EC aerosols used a variety of measurement methods including commercially available and specially designed laboratory instrumentation, and a wide range of particle size distributions are reported. A number of authors have reported median diameters in the nanometer size range (20–200 nm) (Fuoco et al. Citation2014; Ingebrethsen, Cole, and Alderman Citation2012; Manigrasso et al. Citation2015; Mikheev et al. Citation2016). Fuoco et al. (Citation2014) and Manigrasso et al. (Citation2015, Citation2017) used a fast mobility particle sizer for determining the particle size and condensation particle counter for measuring the particle concentration and found the mode of the count distribution to be between 0.1 and 0.2 μm with particle number concentrations on the order of 109/cm3. Fuoco et al. (Citation2014) also noted a small nanometer sized mode. Mikheev et al. (Citation2016) and Ingebrethsen, Cole, and Alderman (Citation2012) used a similar technology the Differential Mobility Sizer (DMS500). Mikheev et al. (Citation2016) found the size distribution to be bimodal with a nanometer mode (10–25 nm) and a submicron mode (0.1–0.2 μm) both with particle concentrations on the order of 108/cm3, while Ingebrethsen, Cole, and Alderman (Citation2012) reported the diameter of average mass to be between 0.02 and 0.05, corresponding to the nanometer mode observed by Mikheev et al. (Citation2016). Zhang, Sumner, and Chen (Citation2013) used a scanning mobility particle sizer and found peak particle counts between 0.12 and 0.18 μm. Other authors reported EC aerosol size distributions with median particle diameters in the submicron range (0.3 and 1 µm) (Alderman and Ingebrethsen Citation2011; Bertholon et al. Citation2013; Dunkhorst, Lipowicz, and Koch Citation2016; Ingebrethsen, Cole, and Alderman Citation2012; Sundahl, Berg, and Svensson Citation2017). Ingebrethsen, Cole, and Alderman (Citation2012) and Dunkhorst, Lipowicz, and Koch (Citation2016) both described optical methods for measuring EC aerosol size. Ingebrethsen, Cole, and Alderman (Citation2012) used a spectral extinction method and found the diameter of average mass ranged from 0.3 and 0.5, while Dunkhorst, Lipowicz, and Koch (Citation2016) developed a 3 wavelength light extinction setup which found particle sizes between 0.4 and 1 μm depending on the smoking conditions applied. Sundahl, Berg, and Svensson (Citation2017), Bertholon et al. (Citation2013), Alderman et al. (Citation2014), Baassiri et al. (Citation2017), and Oldham et al. (Citation2018) have reported on measurements made with various cascade impactors. Sundahl, Berg, and Svensson (Citation2017) found diameters between 0.6 and 1 μm for with a next generation (NGI) impactor. Bertholon et al. (Citation2013) found a diameter of 0.65 μm with an electrical low pressure impactor. Baassiri et al. (Citation2017) used a California Measurements, Inc 6 stage cascade impactor and found mass median diameters between 2.2 and 3.5 μm. Alderman et al. (Citation2014) and Oldham et al. (Citation2018) used a mini-MOUDI and found particle sizes of 0.5–0.6 μm and 0.9–1.2 μm, respectively.
This great variation in reported particle size distribution for different e-vapor products results from several different factors. One of these is the use of different measuring principles (electrical mobility, inertial impaction and light scattering) which have different size dependent instrument response functions, i.e., mobility-based measurements focus on submicron aerosols, while the mass of nanometer aerosols, even at high concentrations may be too low to measure on the filter stage of a cascade impactor. As described above, Ingebrethsen, Cole, and Alderman (Citation2012) and Baassiri et al. (Citation2017) both applied two different methods with vastly different results. Ingebrethsen, Cole, and Alderman (Citation2012) found a nanometer sized aerosol with the DMS500 and a submicron aerosol with their spectral extinction method. They concluded that there was significant evaporation in the DMS500 method due to the high dilution required. Baassiri et al. (Citation2017) also found a smaller particle with the mobility method that they applied compared to their impactor measurements. They attribute this to different particle sources. Other factors that may account for the varied particle size results include the moment of the distribution being reported (i.e., number or mass), different dilution ratios (from 1:1 to 1:3000 or greater) both in the sampling system and the instrument, and differences in the tested products. While differences in particle size distribution results are to be expected when different measurement principals are used or different moments (i.e., number or mass) of the distribution are reported, the excessive range of reported results suggests that a consistent, reliable, reproducible and precise method must be considered when measuring particle sizing for EC aerosols.
Condensation aerosols, such as those produced by ECs, evolve rapidly due to a number of dynamic processes. Initially, the aerosols form via nucleation from supersaturated vapors and then rapidly grow via condensation. The high nucleation rates produce dense aerosol clouds (on the order of 1010 particles/cm3 or greater), and such aerosols will rapidly grow via coagulation (particle-particle collisions). Since EC aerosols consist largely of the semi-volatile liquids PG and GLY, evaporation will result in a decrease in particle size, particularly in cases were dilution may be occurring. The combination of these processes will result in different aerosol size distributions and compositions at different times during the aerosol lifetime. Therefore, residence time and aerosol dilution are important considerations in selecting an aerosol measurement system.
An additional factor that must be considered if aerosol particle size distribution measurements are to be useful in predicting the dosimetry of the ECs is the intermittent nature of the aerosol generation process. ECs are typically used in short 3–5 s puffs, while commercial aerosol instrumentation, including cascade impactors and electrical mobility sizing systems, typically require steady-state flows for reliable operation. Pulsing or varying the flow at the inlet (or the outlet) of these instruments will lead to changes in the flow within the instrument and unreliable results. If aerosol is generated by ECs using a continuous flow, it is expected that the heating profile and vaporization conditions would be quite different than for the intermittent puffing regime of typical use. For long puffs or continuous flows, the heater of the EC and its surroundings may reach higher temperatures than with shorter intermittent puffs. This would affect the nucleation and condensation processes leading to changes in the final aerosol exiting the EC. Also, many devices are designed to cut off after some fixed puff duration, some at 4 s and some at 7 s, which makes it difficult to compare different ECs. Since ECs require intermittent operation whereas aerosol sizing instruments require continuous steady state flows, it is essential to have a sampling system that is an interface between the EC and the measurement instrument allowing for aerosol puffs from the EC to be introduced into the continuous flow of the measuring instrument.
The reports described above used a variety of sampling systems. Sundahl, Berg, and Svensson (Citation2017) and Dunkhorst, Lipowicz, and Koch (Citation2016) used a method commonly referred to as reverse puffing, where the e-cigarette is activated while puffing air through the air inlet ports of the EC, expelling the effluent aerosol stream into the inlet flow of the measurement instrument. While this type of approach works it may be problematic with some ECs depending on the location of the air inlets and flow sensors. Other researchers (Baassiri et al. Citation2017; Bertholon et al. Citation2013; Zhang, Sumner, and Chen Citation2013) have used smoking machines to draw a puff and then exhaust it into a dilution system. This method is less than ideal as it requires holding the undiluted aerosol for a period of time, which may result in particle size changes due to coagulation. Fuoco et al. (Citation2014) and Manigrasso et al. (Citation2015, Citation2017) drew a sample from the EC directly into the dilution system through a 3 way valve that is toggled between room air for the intrapuff interval and the EC to draw a puff. This type of system risks the size selective loss of particles in the valve. A similar scheme appears to be deployed in the Cambustion SCS (smoking cycle simulator) used by Mikheev et al. (Citation2016) and Ingebrethsen, Cole, and Alderman (Citation2012) in conjunction with the DMS500. This system draws the EC aerosol through a pinch valve and the orifice of a flow meter, which can bias the size distribution results by causing size selective losses. Alderman et al. (Citation2014) employed a sampling system closest to the one described in this work. They directed the flow of two ECs into the impactor, using a solenoid valve to toggle the puff on and off. This system was limited in its ability to set the flow through the EC to a desired value, because the total flow through the ECs must equal the flow through the impactor which was fixed at 2 L/min. The sampling inlet described in this work overcomes that limitation and allows the puff flow rate and puff volume to be set independently.
The purpose of this research is to demonstrate a sampling system for particle size distribution measurements of aerosols from e-vapor products. We describe in detail the layout and operation of a sampling system that can produce a controlled puff on an EC and introduce the aerosol into the particle sizing instrument. Some checks are also provided to ensure the measurement system is providing accurate results. This sampling system has been previously applied in other studies (Kane and Rusyniak Citation2015, Citation2017; Oldham et al. Citation2018). The work described here utilizes a low-flow cascade impactor, but the general approach of the sampling system can be applied to other measurement devices as well. The low-flow impactor system is then used to investigate factors that may affect the aerosol size distribution, including puffing conditions, carrier composition and device construction.
2. Experimental setup
The effects of coagulation and evaporation must be considered when selecting an instrument for measuring EC aerosol size distributions. For this reason, a low-flow cascade impactor (Model #02-007, In-Tox Products, Moriarty, NM, USA) was selected for this study. It is a seven-stage Mercer style cascade impactor with stage cut points of 0.25, 0.40, 0.70, 1.00, 2.00, 3.08, 4.00 μm at a flow rate of 2 L/min. This impactor was also chosen because of its compact nature, ease of use, cut points that are ideal for condensation aerosols and flow rate near that of standard smoking/vaping conditions. The impactor’s low internal volume (36 mL) minimizes the residence time (<1 s) and the low flow rate minimizes the dilution of the aerosol stream. The dilution ratios used in this work range from no dilution at a puff flow rate of 2 L/min to 1:3 at a puff flow of 0.5 L/min, the lowest flow rate found to reliably trigger the ECs studied here.
As previously discussed, cascade impactors require a steady flow of air through the impactor for proper operation, so an interface that can generate puffs on an EC while maintaining a constant flow into the impactor is essential. The puffing and sampling system used to interface between the EC and the impactor is shown in . The puffing interface is a four-way cross with the impactor connected to the opposite side of the cross from the test article. Two flows, controlled by mass flow controllers (Model GE50A, MKS Instruments, Andover, MA, USA) enter the other two ports of the cross. One of the flows, referred to here as the puff flow (B) is toggled off by a 3-way solenoid valve (model MB12-3CSC, Mead Fluid Dynamics, Chicago, IL, USA) to generate a puff on the EC (A). The 3-way valve connects the incoming puff flow either to the sampling inlet or to exhaust. Switching the flow to exhaust keeps pressure from building in the lines during the time the puff flow into the sampling inlet is cut off, which helps to maintain steady flow into the impactor. The second flow, referred to as the makeup flow (C), is set to the impactor flow rate (2 L/min) minus the puff flow rate to maintain the constant flow into the impactor. In operation, the flow rate into the impactor is maintained at a constant 2 L/min by a third mass flow controller (Model GE50A) at the exit of the impactor referred to here as impactor flow (D).
Figure 1. Schematic diagram of the particle sizing system. When the puff flow (B) is toggled off by a solenoid valve, flow (A) is generated at the EC port to create a puff on the EC. The makeup flow (C) is set to maintain the total flow into the impactor (flows C + (B or A)) equal to the flow out of the impactor flow (D).
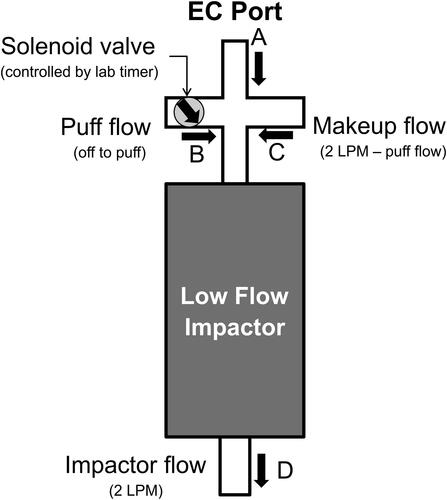
To set up the impactor and sampling system, first the impactor flow D (the flow out of the impactor) is set to 2 L/min. The impactor flow rate D is confirmed by measuring the flow at the inlet of the impactor with an independent flow meter (Gilian Gilabrator-2, Sensidyne, St. Petersburg, FL, USA). Next, with the solenoid valve set to direct the flow to the impactor, the puff flow B is set to the desired flow rate for the puff on the EC. The puff flow rate can be found from the puff volume and duration. Then the makeup flow C is adjusted until the flow at the EC port is 0 as indicated by a lack of movement of the soap bubble in a Soap Bubble Flow Meter (Borgwald-KC, Richmond, VA, USA). After all the flows have been set, the configuration is tested by taking a puff (as described below) to make sure the desired puff volume is taken, as measured with the soap bubble flow meter. The measured puff volume must be ±5% of the target volume for the measurement system to be considered ready for operation. Dry compressed air was used for flows B and C. The EC was puffed in the ambient lab air, which ranged in relative humidity from 30% to 50% during the time these data were collected.
To operate the sampling system, after all the flows have been set, an EC is inserted into the EC port. To take a puff, the puff flow (B) is switched to the exhaust port of the solenoid valve for the duration of the puff. When flow B is stopped the sampling system will draw air through the EC port and flow A is generated to maintain the 2 L/min into the impactor. Since flows C and D are controlled by mass flow controllers flow A will of necessity be equal to flow B. This creates a puff on the EC that lasts until the solenoid valve is switched back. In practice the solenoid valve is controlled by a lab timer (Model 451, Gralab, Centerville, OH, USA). During the initial setup and testing of the sampling system the flow rate through the EC port was observed to be steady by watching the movement of the soap bubble in the soap bubble flow meter. The flow rates from the mass flow controllers into (C) and out of (D) the system were monitored with the MSK software and were found to remain steady through the experiment. This suggests that the flow through the impactor was not disrupted by puffing on the EC.
Immediately after the final puff was collected, the flows through the impactor and sampling system were stopped. The impactor was then disassembled, and the impaction surfaces were massed, typically within 5 min. Prior to weighing, the impactor stages sat in the ambient laboratory air. In preliminary investigations, the stage mass was not observed to vary more than ±0.3 mg during repeated weightings over a 10-minute period, and no systematic trends in the stage mass over time were observed. The lack of a mass change may be the result of combined evaporation and water uptake; this cannot be ruled out. However, the weight changes are unlikely to have a significant impact on the measured distributions. Once the stage weighing was complete and the weights were recorded, the impactor was cleaned, dried, and prepared for the next set of measurements.
When measuring the particle size of EC aerosol, the puffing parameters used for generating the aerosol must be reasonable. A puff on a cigarette or an EC is generally defined by its volume and duration, i.e., a 55 mL, 5 s puff. For smoking machine testing with conventional cigarettes, the puffing parameters vary from a 35 mL, 2 s puff (ISO regime) to a 55 mL, 2 s puff (Health Canada Intense). There is anecdotal evidence that, compared to cigarettes, ECs are vaped with slower, longer puffs. Therefore, puffing conditions typically used for EC testing are between 55 mL, 3 s and 55 mL, 5 s puffs, for example see the CORESTA puffing regimen (CORESTA Recommended Method No 81).
Unless otherwise noted the EC used in testing was a prototype “cig-a-like” device with a flavor formulation consisting of 40% Glycerin and 60% Propylene Glycol by mass and no flavoring or nicotine. Commercial e-cigarettes tested included: MARKTEN Classic (EC1), GREEN SMOKE Signature Red (EC2), NJOY Tobacco (EC3), NJOY Menthol (EC4), NJOY Gold (EC5), BLU Original (EC 6), V2 Tobacco (EC7), VUSE Original (EC8), and, VUSE Menthol (EC9), all products that could be purchased in retail outlets in the US in 2014.
3. Results
Before extensive testing of ECs can be carried out, it is important to verify that the measurement system functions as expected. This might be done in a number of different ways, but here, this was accomplished by measuring the size distribution of smoke from a conventional reference cigarette to test that the system reproduces results that had been obtained previously and comparing the mass of the EC aerosol collected in the impactor to the aerosol mass produced by the same EC collected directly on a Cambridge filter pad.
shows a typical aerosol particle size distribution for a 3R4F Kentucky Reference cigarette (Kentucky Tobacco Research & Development Center, Lexington, KY) as measured with the low-flow impactor system. Here, the data are plotted as a histogram of the mass collected on each stage by impactor cut point diameter. For cigarette smoke, >99% of the mass collected in the impactor was collected below the 1 µm cut point stage. The MMAD for the aerosol particle size distribution can be determined from the impactor data using the cumulative mass distribution. For this report the median diameter was determined using a linear extrapolation between the stages above and below the 50% cumulative mass points. The MMAD for the 3R4F cigarette smoke was found to be 0.4 µm, which is in reasonable agreement with previous measurements (Becquemin et al. Citation2007; Bertholon et al. Citation2013; Kane et al. Citation2010).
Figure 2. Examples of particle size distributions of (a) reference cigarette 3R4F (one puff of 35 mL and 2 s duration) and (b) EC (five puffs of 55 mL and 5 s duration, each) measured with the impactor. Both graphs are data from a single measurement, but representative of the typical histograms.
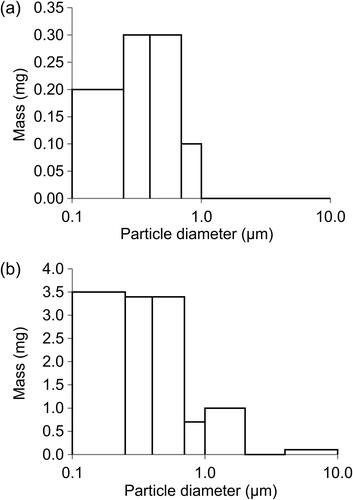
shows a similar histogram of an EC aerosol with a prototype “cig-a-like” device. The particle size distribution is wider than that of a conventional cigarette, and a fraction (∼10%) of the aerosol mass is found on or above the 1.0 µm stage. The MMAD of this EC aerosol was 0.7 µm.
Characterization of losses in the sampling and measurement system is important for any aerosol measurement system. For EC, this can be done by comparing the measured aerosol concentrations to the expected aerosol concentration. The expected concentration can be determined from the aerosol mass delivery of the EC as measured by collecting the EC aerosol generated by a smoking machine on a high efficiency filter pad, i.e., a Cambridge pad (Counts et al. Citation2005). For instruments measuring the aerosol mass distribution, such as the low-flow cascade impactor used here, this mass can be directly compared to the total mass measured by the particle sizing instrument. For instruments that measure other moments of the distribution, one can estimate the particle concentration from the filter aerosol mass delivery and the diameter of average mass. For a lognormal distribution, the diameter of average mass can be determined from median or average diameter in any moment of the aerosol distribution using the Hatch-Choate conversions (Hinds Citation1999, pp. 97–100). This concentration should be comparable to the total concentration found with the particle sizing instrument.
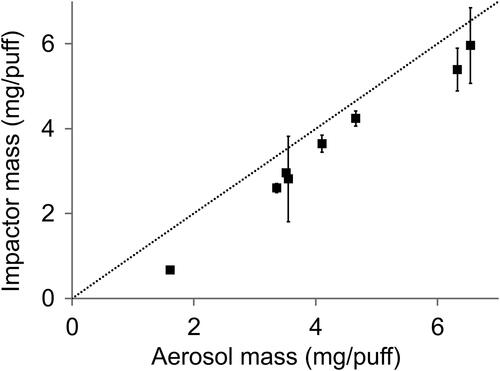
For the low-flow impactor we characterized losses in the sampling and measurement system by comparing the total mass/puff collected in the impactor over 5 puffs of an EC with the mass/puff collected on a filter when the EC is smoked with 20 similar puffs using a smoking machine. These results, plotted on a mass per puff basis, are shown in for the set of commercial ECs. It is apparent that the aerosol mass collected with the impactor is highly correlated (R2=0.986) with the mass collected on the filter. The dotted line represents the theoretical 100% recovery. The data points are slightly below the dotted line indicating approximately 90% of the mass delivered by the EC is collected in the impactor. Numerous processes are possibly responsible for this loss of mass including losses in the transfer lines, evaporation from the impactor surfaces and evaporation of the semivolatile aerosol components following dilution. It is also possible that the mass of the aerosol collected on the filter which is assumed to the mass of the aerosol delivered by the EC could be biased by the uptake of water by the aerosol during puffing that is conducted in the lab air. Of the mechanisms for mass loss in the impactor, evaporation from the suspended droplets is likely the most significant as no buildup of liquid was observed in the sampling system during use and from the initial testing it was observed that the interpuff interval did not have a significant effect on the total impactor mass which suggests minimal evaporation from the surfaces. Assuming that all of the mass not collected in the impactor was lost due to evaporation, this would not have a significant effect on the measured diameter. Since the particle diameter is proportional to the cube root of the mass (Hinds Citation1999), a 10% loss of mass due to evaporation would result in a 2% change in the particle diameter. This change is well below the measurement resolution of the impactor.
Figure 3. Mass recovery in the cascade impactor for the commercial products described in Section 2 puffed under similar conditions (i.e., 55 mL, 5 s puffs). The error bars represent ±1 standard deviation of three or four successive measurements on one device. The dotted line represents 100% recovery.
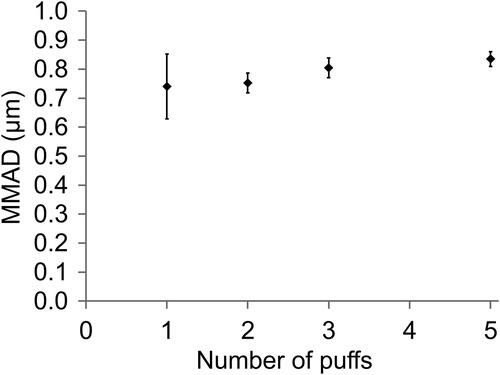
Another important consideration specific to using cascade impactors to measure aerosol size distributions is the impactor loading. Sufficient mass must be collected to make a reasonable measurement of the amount collected on each stage of the impactor. However, if the mass collection on any stage is too high, the cut points of the impactor may be altered making the impactor measurements unreliable. To determine a suitable number of puffs that can be collected with the cascade impactor system, the MMAD was determined for different numbers of puffs collected. The results are shown in . It is apparent that there is no change in the measured median diameter when 1–5 puffs were collected. ANOVA of the data gives a P value of 0.25 rejecting the null hypothesis that the samples are from different distributions which supports the observation that the measured diameter was not affected by collecting between 1 and 5 puffs. This suggests that at mass loadings up to 6 mg per stage (the highest mass deposited on any stage for 5 puffs), the impactor performance will not be adversely affected. When only 1 puff was collected the variability of the measurements was large, as seen in the larger error bars (representing 1 standard deviation of the data) for 1 puff compared to 2 or more puffs. This is caused by the lower mass collected on each stage (typically less than 1 mg on each stage) and the variability of the tested EC. An additional factor that will affect the mass loading of the impactor is the puff duration. It is typical for commercial ECs that the aerosol mass produced is directly proportional to the puff duration. As the puff duration is increased, the aerosol delivery will increase, which can lead to overloading the impactor stages if it is not considered. In order to minimize the variability while ensuring that the impactor performance was not affected, the puff count collected for each measurement was limited to 5 puffs, and the puff duration was fixed at 5 s. At these conditions, the mass collected on each impactor stage was not expected to exceed 6 mg, a mass loading found not to affect the impactor performance. If sampling leads to more than 6 mg on any stage for ECs with higher aerosol mass, the impactor performance needs to be reevaluated to make sure overloading does not occur.
Figure 4. Effect of puff count on the measured MMAD. The error bars represent ±1 standard deviation of three independent measurements.
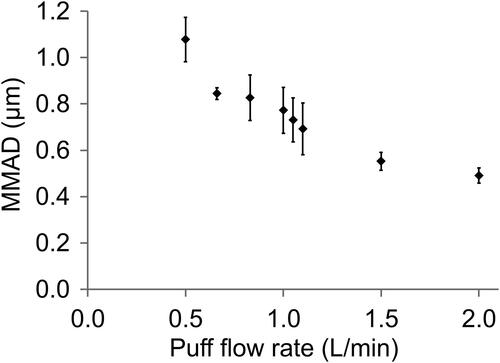
The puff volume can be changed by adjusting either the puff duration or the puff flow rate. The average flow rate of the puff is defined by the puff volume and duration. Note that when a square wave puff profile is used which is recommended by CORESTA, and has been employed in this work, the average puff flow rate is the actual flow rate through the EC during a puff. When puff volume was changed by changing the puff duration at a constant puff flow rate, no change in the MMAD of the aerosol was observed. However, this is not the case when the puff volume was changed by varying the puff flow rate at constant puff duration, as shown in . Here, the MMAD particle size decreases from 1.1 µm to 0.5 µm as the puff flow rate is increased from 0.5 to 2.0 L/min with constant puff duration of 5 s. This corresponds to a puff volume change from 42 mL to 167 mL. The lower end of flow rate is selected to ensure successful activation of the devices. The high end of the flowrate is limited by the operational flow of the impactor used. While the particle size decreased as the flow rate increased, the mass delivery of the aerosol remained essentially constant. Since the aerosol mass delivery did not change significantly with the flow rate this effect on particle size is attributed to the change in the puff flow rate. As the puff flow rate has a significant effect on the measured particle size, a flow rate of 0.67 L/min was used for all the measurements made in the remainder of this study
Figure 5. Effect of the puff flow rate on the aerosol MMAD. The error bars represent ±1 standard deviation of 3–5 measurements.
The low-flow impactor system has been used to study different commercially available ECs as listed in section 2. These devices have different design parameters that might affect the particle size of the aerosol generated by vaping, including a range of device sizes, wick and coil configurations, and flavor formulations. These devices were tested as received without any modification. As shown in , these devices generated aerosol particle sizes between 0.5 and 0.9 µm for the puffing conditions that were tested. Given that these devices all utilize an evaporation-condensation mechanism to generate the aerosol; it is not surprising that the particle sizes are similar. Evaporation-condensation processes typically generate submicron aerosols. Examination of the design factors, such as power of the device, did not reveal any patterns related to the aerosol size. A more thorough investigation of the aerosol size distribution of different EC products can be found in Oldham et al. (Citation2018).
Figure 6. Comparison of particle size of different ECs. The error bars represent ±1 standard deviation of three independent measurements.
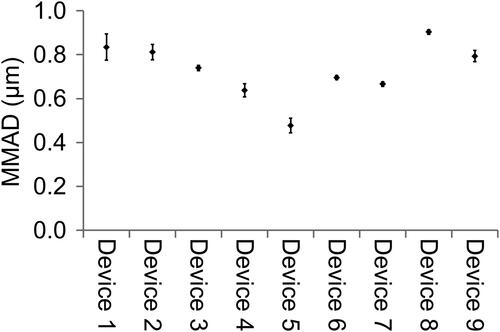
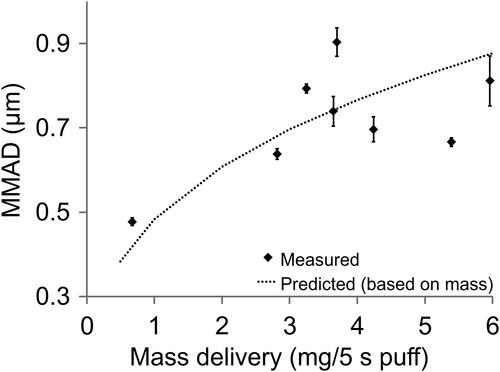
It is apparent that EC 5 produced a smaller particle size then the other ECs in this data set. EC 5 was also noted to have an uncharacteristically low delivery. This may indicate that the product was defective, or the battery not fully charged. It is noted that EC 5, was the same brand although a different flavor from EC 3 and EC 4. Other flavors are not observed to have a major effect on the particle size for example EC 3 and EC 4 are the same brand with different flavors as are EC8 and EC9 and both sets have MMADs within 0.1 µm. This suggests aerosol delivery, may be related to the MMAD. In , the measured MMAD is plotted against the per-puff aerosol delivery for the devices measured in . Two of the devices in this study, the heating coil would remain on for only 4 s, so to be included in this graph, their delivery data were corrected to a 5 s puff (assuming an extra 20% delivery) for the purposes of this comparison. Also included on this graph is a model prediction for the dependence of the particle diameter on the mass delivery assuming a constant number of particles. Since where
is the mass of the particle and
is the diameter, for a collection of particles with a median diameter D and a total aerosol mass m will also be proportional to the diameter D. Then, if the diameter of the particles is increased while the concentration of particles remains constant the mass of the aerosol will increase proportionately. In this case, the diameter of the aerosol is related to the total aerosol mass (or aerosol delivery) by
(1)
(1)
where
and
are the diameter and concentration of the original aerosol. This type of model represents different vapor concentrations condensing into the same concentration of droplets as might occur in a system where the nucleation rate remained constant while the vapor concentration increased. From , it is evident that the particle size roughly follows a m1/3 dependence.
Figure 7. MMAD of different electronic cigarettes compared to mass delivery. The error bars represent ±1 standard deviation of three independent measurements. The dotted line in the graph is the model prediction given by EquationEquation (1)(1)
(1) .
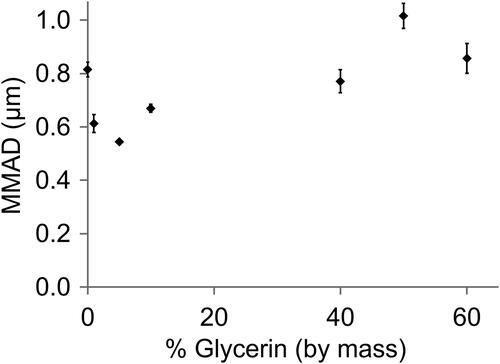
The ratio of PG to GLY in the flavor formulation was another device design factor that was investigated. Commercially available EC flavor formulations have a variety of PG and GLY compositions. shows how the MMAD of an EC aerosol is affected by the PG and GLY composition of the flavor formulation. These data were generated from similar prototype devices. It is apparent that while the aerosol continues to have a submicron particle size, there is a complicated relationship with the amount of GLY in the flavor formulation. Small amounts of GLY produce a dramatic decrease in the particle diameter. But as the GLY concentration increases further, the particle size increases, eventually leveling off at around 0.9 µm. This is behavior that was repeatedly observed in several repeats of this experiment as well as in formulations with nicotine. Presently, no hypothesis has been brought forward to explain this behavior. Unlike the correspondence of the MMAD to the delivery in the case of the different ECs, these changes in MMAD do not correspond to the increases in the mass delivery of the aerosol, which is highest for pure PG aerosol and decreases as the glycerol concentration increases.
Figure 8. Dependence of the particle size on the carrier composition. The error bars represent ±1 standard deviation of 3 independent measurements.
4. Discussion
When developing an aerosol particle sizing method, it is important to consider the nature of the aerosol that will be measured. ECs present a particular challenge in this regard due to the high particle concentration aerosols of semi-volatile components that they produce. Minimizing residence time and dilution are keys to reliable measurement of the particle size distribution. The residence time in the sampling and measurement systems is the time available for coagulation. At particle mass densities on the order of 0.1 mg/mL (the density corresponding to an aerosol mass delivery of 5.5 mg for a 55 mL puff), the number concentration of an aerosol with a median diameter of 0.8 µm would be on the order of 108–109 particles/mL. At this concentration, coagulation should not have a significant effect on the median particle size over a period of seconds, but would on the order of tens of seconds (Hinds Citation1999). However, if the median particle size was 40 nm as some researchers have reported (Mikheev et al. Citation2016), then the number concentrations would be closer to 1012 particles/mL, and the aerosol might be expected to double in size within a few tens of milliseconds (Hinds Citation1999). Unlike coagulation, evaporation is not dependent on the residence time of the aerosol, as the time scale for maintaining the vapor-liquid equilibrium is on the order of 10−6 s. Evaporation is significantly affected by the amount of clean dilution air that is mixed with the aerosol. Since the particles will evaporate to the level required to saturate the environment, the greater the dilution factor the larger the effect on the particle diameter. The sampling system discussed here, in combination with a low-flow impactor, addresses both of these issues by keeping the residence time between generation and measurement at ∼1 s and using a minimal amount of dilution air in the sampling and measurement processes. As noted above, comparing the expected aerosol concentration delivered by an EC using the mass collected on a filter with the total aerosol concentration measured by the sizing instrument is a reliable method for confirming not only particle loss in the system, but also for providing an upper limit of the amount of evaporation occurring during the measurement. The 10% losses shown here are not expected to have a significant effect on the size distribution.
The parameter that had the largest effect on the aerosol size distribution measurement was the puff flow rate. Zhao et al. (Citation2016) have reported a similar effect, although their measured median diameters were in the nanometer size range. They observed the count median diameter (CMD) changing from 15 to 27 nm as the puff flow rate decreased from 2.0 to 0.5 L/min. Since the mass delivery was independent of the puff flow rate, as the flow rate increases, the particle size decreases. Therefore, a possible explanation for the decrease in median particle size is an increase in the nucleation rate as the flow rate increases. The nucleation rate is dependent on the degree of supersaturation that the aerosol experiences, and higher flow rates likely lead to faster cooling rates as the vapor is transported downstream from the heater, which, in turn, leads to higher supersaturations.
The second biggest factor affecting the median aerosol size was the mass delivery of the aerosol. As shown in , the median particle diameter roughly follows the expected dependence on mass assuming that the particle number concentration stays constant. A greater mass divided over the same number of particles means larger particles. As illustrated in , a dependence of the particle size on the PG/GLY ratio was also observed. The effect is most dramatic between 0% and 10% GLY. As the GLY concentration increases above 10%, the particle size begins to level off.
Beyond differences in the particle size related to the aerosol mass delivery of the EC, only small differences (∼0.1 µm) were observed in the particle size distributions of different EC devices. As these “cig-a-like” devices were produced by different manufacturers, different sizes, with different batteries, heaters, wicks and flow paths, it appears that most design parameters of “cig-a-like” devices do not play a significant role in the aerosol particle size.
Here, we presented a sampling system that can be used in conjunction with aerosol sizing instrumentation to measure the particles size distribution of EC from puffs generated at different flow rates and durations. Applying the sampling system with a low-flow cascade impactor that minimizes dilution of the aerosol, we found that the device design and PG/GLY ratio had only a small effect on the median aerosol particle size. However, the puff flow rate used to generate the aerosol from the device was a significant factor in the measured median diameter. Therefore, the puff flow rate needs to be considered when comparing different EC particle size measurements. This should be reported in the measurement, and standard puff parameters for EC particle size measurements should be developed if measurements are to be compared across platforms. While predicting airway deposition involves many factors, including the puffing and inhalation patterns of the user, the dynamics of the aerosol during inhalation and exhalation and numerous other factors if particle size measurements are to be used in airway deposition and dosimetry models, it is important that the measured distribution accounts for both the size and the expected particle density of the aerosol.
Disclosure statement
No potential conflict of interest was reported by the author(s).
References
- Alderman, S. L., and B. J. Ingebrethsen. 2011. Characterization of mainstream cigarette smoke particle size distributions from commercial cigarettes using a dms500 fast particulate spectrometer and smoking cycle simulator. Aerosol Sci. Technol. 45 (12):1409–21. doi:https://doi.org/10.1080/02786826.2011.596862.
- Alderman, S. L., C. Song, S. C. Moldoveanu, and S. K. Cole. 2014. Particle size distribution of e-cigarette aerosols and the relationship to Cambridge filter pad collection efficiency. Beitrage Zur Tabakforschung International/Contributions to Tobacco Research 26:183–90. doi:https://doi.org/10.1515/cttr-2015-0006.
- Baassiri, M., S. Talih, R. Salman, N. Karaoghlanian, R. Saleh, R. El Hage, N. Saliba, and A. Shihadeh. 2017. Clouds and “throat hit”: Effects of liquid composition on nicotine emissions and physical characteristics of electronic cigarette aerosols. Aerosol Sci. Technol. 51 (11):1231–9. doi:https://doi.org/10.1080/02786826.2017.1341040.
- Becquemin, M. H., J. F. Bertholon, M. Attoui, F. Roy, M. Roy, and B. Dautzenberg. 2007. Particle size in the smoke produced by six different types of cigarette. Rev. Mal. Respir. 24 (7):845–52. doi:https://doi.org/10.1016/S0761-8425(07)91386-8.
- Bertholon, J. F., M. H. Becquemin, M. Roy, F. Roy, D. Ledur, I. Annesi Maesano, and B. Dautzenberg. 2013. Comparison of the aerosol produced by electronic cigarettes with conventional cigarettes and the shisha. Rev. Mal. Respir. 30 (9):752–7. doi:https://doi.org/10.1111/j.16002012072.
- Counts, M. E., M. J. Morton, S. W. Laffoon, R. H. Cox, and P. J. Lipowicz. 2005. Smoke composition and predicting relationships for international commercial cigarettes smoked with three machine-smoking conditions. Regul. Toxicol. Pharm. 41 (3):185–227. doi:https://doi.org/10.1016/j.yrtph.2004.12.002.
- Dunkhorst, W., P. Lipowicz, and W. Koch. 2016. Characterization of highly concentrated organic aerosols by optical extinction in the mid infrared regime: Application to e-cigarettes. J. Aerosol Sci. 94:33–42. doi:https://doi.org/10.1016/j.jaerosci.2015.12.004.
- Fuoco, F. C., G. Buonanno, L. Stabile, and P. Vigo. 2014. Influential parameters on particle concentration and size distribution in the mainstream of e-cigarettes. Environ. Pollut. 184:523–9. doi:https://doi.org/10.1016/j.envpol.2013.10.010.
- Hinds, W. C. 1999. Aerosol technology: Properties, behaviors and measurement of airborne particles. New York: John Wiley & Sons, Inc.
- Ingebrethsen, B. J., S. K. Cole, and S. L. Alderman. 2012. Electronic cigarette aerosol particle size distribution measurements. Inhal. Toxicol. 24 (14):976–84. doi:https://doi.org/10.3109/08958378.2012.744781.
- Kane, D. B., B. Asgharian, O. T. Price, A. Rostami, and M. J. Oldham. 2010. Effect of smoking parameters on the particle size distribution and predicted airway deposition of mainstream cigarette smoke. Inhal. Toxicol. 22 (3):199–209. doi:https://doi.org/10.3109/08958370903161224.
- Kane, D., and D. Rusyniak. 2015. Measurement of e-cigarette aerosol particle size with a low flow cascade impactor. Presented at the 69th Tobacco Science Research Conference, Naples, FL, USA, September 20–23.
- Kane, D., and D. Rusyniak. 2017. A low flow cascade impactor system for measurement of e-cigarette aerosol particle size. Presented at the CORESTA Meeting, Smoke Science/Product Technology, Kitzbühel, ST 54, Austria, October 8–12.
- Manigrasso, M., G. Buonanno, F. C. Fuoco, L. Stabile, and P. Avino. 2015. Aerosol deposition doses in the human respiratory tree of electronic cigarette smokers. Environ. Pollut. 196:257–67. doi:https://doi.org/10.1016/j.envpol.2014.10.013.
- Manigrasso, M., G. Buonanno, F. C. Fuoco, L. Stabile, and P. Avino. 2017. Electronic cigarettes: Age-specific generation-resolved pulmonary doses. Environ. Sci. Pollut. Res. Int. 24 (14):13068–79. doi:https://doi.org/10.1007/s11356-017-8914-8.
- McAuley, T. R., P. K. Hopke, J. Zhao, and S. Babaian. 2012. Comparison of the effects of e-cigarette vapor and cigarette smoke on indoor air quality. Inhal. Toxicol. 24 (12):850–7. doi:https://doi.org/10.3109/08958378.2012.724728.
- Mikheev, V. B., M. C. Brinkman, C. A. Granville, S. M. Gordon, and P. I. Clark. 2016. Real-time measurement of electronic cigarette aerosol size distribution and metals content analysis. Nicotine Tob Res 18 (9):1895–902. doi:https://doi.org/10.1093/ntr/ntw128.
- Oldham, M. J., J. Zhang, M. J. Rusyniak, D. B. Kane, and W. P. Gardner. 2018. Particle size distribution of selected electronic nicotine delivery system products. Food Chem Toxicol 113:236–40. doi:https://doi.org/10.1016/j.fct.2018.01.045.
- Sundahl, M., E. Berg, and M. Svensson. 2017. Aerodynamic particle size distribution and dynamic properties in aerosols from electronic cigarettes. J. Aerosol Sci. 103:141–50. doi:https://doi.org/10.1016/j.jaerosci.2016.10.009.
- Zhang, Y., W. Sumner, and D. Chen. 2013. In vitro particle size distributions in electronic and conventional cigarette aerosols suggest comparable deposition patterns. Nicotine Tob Res 15 (2):501–8. doi:https://doi.org/10.1093/ntr/nts165.
- Zhao, T., S. Shu, Q. Guo, and Y. Zhu. 2016. Effects of design parameters and puff topography on heating coil temperature and mainstream aerosols in electronic cigarettes. Atmos. Environ. 134:61–9. doi:https://doi.org/10.1016/j.atmosenv.2016.03.027.