
 ?Mathematical formulae have been encoded as MathML and are displayed in this HTML version using MathJax in order to improve their display. Uncheck the box to turn MathJax off. This feature requires Javascript. Click on a formula to zoom.
Abstract
In this study, we characterized a variety of light-absorbing carbonaceous aerosols generated from a controlled combustion system using two different photoacoustic measurement techniques: the RGB-DPAS instrument operating at 671, 532, and 473 nm with a single optical pass configuration; and the Multi-PAS III instrument operating at 781, 532, and 422 nm with a multiple optical pass configuration. We calibrated the two instruments using Cab-O-Jet aerosols. The two instruments measured similar absorption coefficients at 532 nm for both brown carbon (BrC) and black carbon (BC) aerosols. The linear fit between the determined aerosol absorption coefficients from the two instruments yielded a linear factor of 1.005 ± 0.029, with a correlation coefficient R2 = 0.94. The absorption Ångström exponents (AAE), ranging from 1 to 10, measured by the two instruments also agreed well, with a resulting linear fitting factor of 1.021 ± 0.038 and R2 = 0.92. These results indicate that although the two instruments have significant differences in the acoustic resonator design and optical length within the sample cells, the determined optical properties for BrC and black BC aerosols were nearly identical. We also investigated the effect of difference in calibration scheme on PAS measurements. In addition to Cab-O-Jet, the Multi-PAS III was also calibrated using NO2. We found that NO2 calibration resulted in 24% lower photoacoustic signal response at 532 nm than Cab-O-Jet calibration. The AAE values obtained with NO2 calibration were 16% smaller than with Cab-O-Jet calibration for BC-dominated aerosols (AAE < 2). However, the difference in AAE decreased with increasing AAE, and the two calibrations yielded almost identical AAE values for AAE > 7.
EDITOR:
1. Introduction
Carbonaceous aerosols, including black carbon (BC) and organic aerosols (OA), have significant but poorly characterized impacts on the climate (Bond et al. 2013; Laskin, Laskin, and Nizkorodov Citation2015). BC can absorb incoming solar radiation efficiently and has been established as a leading climate-warming agent, potentially second only to CO2. OA also interacts with solar radiation, but its impact on the climate is more complicated than BC since the chemical structure and optical properties of OA are highly diverse. There are some OA species that can absorb solar radiation and are dubbed brown carbon (BrC) (Andreae and Gelencsér Citation2006). The light-absorption properties of BrC used in the climate calculation are highly variable, thus, leading to significant uncertainties in their climate effects (Saleh Citation2020). One primary reason is the challenge associated with measuring the light-absorption properties of carbonaceous aerosol. Therefore, precise measurements of light absorption of atmospheric carbonaceous aerosols from infrared (IR) to ultraviolet (UV) are critical to our understanding of their contributions to global radiation balance (Carslaw et al. Citation2010; Samset et al. Citation2018).
The photoacoustic spectroscopic (PAS) techniques, which provide high sensitivities and fast responses in real-time, have been applied to measure light absorption of atmospheric aerosols in many research investigations (Arnott et al. Citation2005a; Moosmüller, Chakrabarty, and Arnott Citation2009; Lack et al. Citation2012; Stier et al. Citation2007; Carslaw et al. Citation2010). The responses of the PAS measurement systems, ultimately related to the aerosol light absorption, are the AC signals recording the acoustic pressure of a sound wave, which is created from the non-radiative release of the radiation energy absorbed by the aerosol inside an acoustic resonator. The quality factor of the acoustic resonator, Q, which is defined as the ratio of resonance frequency to full width at half maximum (FWHM) of the acoustic profile, depends on its design. The resonance frequency of a photoacoustic system varies with the composition of carrier air and the sample temperature. Therefore, a response calibration procedure that converts the recorded AC signals of acoustic pressure into light absorption coefficients is necessary for all the PAS measurements.
In this study, we challenged two photoacoustic instruments with combustion-generated light-absorbing carbonaceous aerosols including BC and BrC ranging from very weakly absorbing BrC (VW-BrC) to strongly absorbing BrC (S-BrC) classified based on their light-absorption properties (Saleh Citation2020). The photoacoustic instruments included the single-pass Red-Green-Blue Differential Photoacoustic Spectrometer (RGB-DPAS) instrument operating at 473 nm (blue), 532 nm (green), and 671 nm (red), developed by Aerodyne Research, Inc. (Yu et al. Citation2019); and the multi-pass three-wavelength photoacoustic spectrometer (Multi-PAS III) instrument operating at 422, 532, and 781 nm designed and built by Geoffrey Smith’s group (University of Georgia) following the same design as Fischer and Smith (Citation2018a).
2. Methodology
In this study, light-absorbing carbonaceous aerosols were generated in the laboratory by a combustion source with controlled temperature and equivalence ratio, which allows the real-time fine tuning of optical properties of the generated aerosols. A brief description of the combustion chamber and its operation is presented in Section 2.1. In addition, a custom-made thermodenuder was also applied in some of the experiments to remove the volatile components of the generated aerosols in order to isolate the highly absorptive components (including BC and S-BrC).
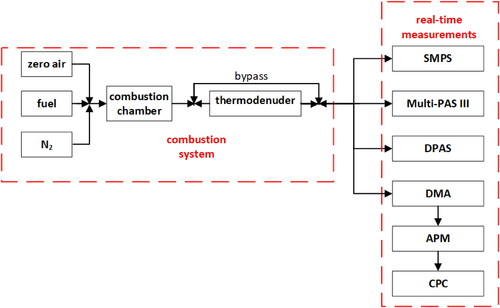
Two photoacoustic instruments were used to investigate optical properties of the aerosols: the DPAS-RGB instrument operating at 473 nm (blue), 532 nm (green), and 671 nm (red) with a single-pass optical configuration, and the Multi-PAS III instrument operating at 422, 532, and 781 nm with a multi-pass design. In addition to the photoacoustic instruments, a scanning mobility particle sizer (SMPS, TSI, Inc., Shoreview, MN, USA) was used to measure particle size distributions of the aerosols. We also utilized a tandem differential mobility analyzer (DMA, TSI, Inc.)—aerosol particle mass analyzer (APM-II, Model 3601, Kanomax USA, Inc., Andover, NJ, USA) to quantify the effective density of the aerosol particles. In the tandem DMA-APM technique, the DMA is used to classify the aerosols at specific size and the APM measures particle mass of the size-selected aerosols. The schematic plot of the experimental setup is shown in .
Figure 1. A schematic plot of the experimental setup and measurement instruments.
2.1. Generation of light-absorbing aerosols from a controlled combustion source
A detailed description of the combustion system used to generate the carbonaceous light-absorbing aerosols in this study can be found in Cheng et al. (Citation2019). Briefly, toluene and 1-butanol were used as the fuels to generate the desired carbonaceous aerosols, including BrC and mixtures of BC and BrC. The controlled combustion was performed in a quartz-made chamber with combustion temperature controlled between 950 and 1000 °C. The vapor of fuel (toluene or butanol) was introduced into the combustion chamber by flowing dry nitrogen through a bubbler containing the fuel, thus saturating the nitrogen flow with the fuel. The flow of fuel-saturated nitrogen, generally at a flow rate of 0.17–0.24 L min−1, was then mixed with two flows: dry nitrogen at a flow rate of 0.00–0.60 L min−1, and dry air at a flow rate of 0.10–0.20 L min−1, before entering the combustion chamber. The dry air provided oxygen to combustion processes. It came from compressed house air, which was conditioned by a filter train including a silica gel column, an activated carbon column and a HEPA filter. By controlling the temperature and relative flowrates of fuel, air, and nitrogen, we generated BrC and BrC + BC mixtures with varying light-absorption properties. Specifically, decreasing the nitrogen flow rate and/or increasing temperature produced larger-molecular size, more-absorbing (darker) BrC (Saleh, Cheng, and Atwi Citation2018). Combustion conditions were fine-tuned using the observed light absorption properties including mass absorption cross-section (MAC) and absorption Ångström exponent (AAE) that were calculated in real-time based on measurements of particle size distributions and light absorption coefficients, as described in Section 3.1. In some of the experiments, we passed the combustion-generated aerosol samples through a custom-designed thermodenuder, controlled at 300–400 °C. By doing so, we exploited the established association between molecular size, volatility, and light-absorption properties (Saleh, Cheng, and Atwi Citation2018) to isolate the highly absorptive BrC fraction. Specifically, heating the BrC in the thermodenuder volatilizes the more volatile, less absorptive fraction, thus leaving the less volatile, more absorptive BrC in the residual aerosol.
2.2. Measurement instruments
In this study, aerosol light absorption of various laboratory-generated carbonaceous aerosols was measured at multiple wavelengths simultaneously by two photoacoustic instruments: the Multi-PAS III and the RGB-DPAS. The specification of both instruments is listed in . Both instruments measure aerosol absorption coefficients (babs, in unit of Mm−1) in real-time, simultaneously at three optical wavelengths in parallel. The main technical difference between the two instruments is that the Multi-PAS III utilizes a multi-pass optical configuration at each wavelength, while the RGB-DPAS has only one optical pass by merging three laser beams into a single, fine light beam via dichroic optics. The Multi-PAS III instrument was built at the University of Georgia, following a similar design of the Multi-PAS IV by Fischer and Smith (Citation2018a). It contains a multi-pass photoacoustic unit operating at three wavelengths: 422, 532, and 781 nm. This design has the advantage that a single wavelength calibration is applicable to all wavelengths. A detailed description of the RGB-DPAS instrument, which operates at 473, 532, and 671 nm in parallel, has been published previously (Yu et al. Citation2019). A comparison of the specifications between the two photoacoustic instruments is presented in . In this study, we used a single photoacoustic cell system for all the RGB-DPAS measurements. We applied filtered air samples to both instruments at each test point in order to obtain background measurements of aerosol light absorption.
Table 1. Specifications of Multi-PAS III and RGB-DPAS photoacoustic instruments.
Particle size distributions of the aerosols within the electrical-mobility size range 10–550 nm were measured by an SMPS system, which consists of a TSI model 3081 differential mobility analyzer (DMA, TSI, Inc.) and a model 3776 condensation particle counter (CPC, TSI, Inc.). We calculated the total particle mass concentrations (mp) by integrating the electrical-mobility particle size distributions in volume domain and multiplying them by the effective densities measured using the tandem differential mobility analyzer—aerosol particle mass analyzer (tandem DMA-APM) technique (McMurry et al. Citation2002; Malloy et al. Citation2009). We used a DMA to classify the aerosols based on their electricity mobility diameter (dm) and used an APM to measure the mass of the selected particles (m). We then calculated the effective density as:
(1)
(1)
For spherical particles, as expected for pure BrC particles (Saleh, Cheng, and Atwi Citation2018), the effective density represents the true material density. On the other hand, BC-containing particles are fractal and their electrical-mobility volumes are larger than the actual volumes, thus their effective densities are smaller than material density (DeCarlo et al. Citation2004).
As the mass distributions of samples containing BC were not adequately captured within the SMPS measurement window, we applied lognormal fits to obtain the missing part of the distributions.
2.3. Calibration of the photoacoustic instruments
The calibration procedure is critical to the accuracy of the photoacoustic measurement of aerosol light absorption. Many calibration techniques have been developed by using either gaseous or particle-based calibration standards. For instance, Arnott, MoosmüLler, and Walker (Citation2000) used NO2 to calibrate their PAS instrument at 532 nm. Lack et al. (Citation2006) utilized high concentrations of ozone (O3), whose optical absorption levels were measured with the CRDS technique (O’Keefe and Deacon Citation1988), to calibrate the PAS instrument at visible wavelengths. Recently, Bluvshtein et al. (Citation2017) used the light-absorbing nigrosin aerosols, a mixture of water-soluble black dyes, to calibrate a multi-pass PAS spectrometer at 404 nm.
In this study, a particle-based approach, recommended by Zangmeister et al. (Citation2019), was applied for the calibration of both the RGB-DPAS and Multi-PAS III instruments. In this approach, a water-dispersible synthetic pigment black (Cab-O-Jet 200 from Cabot Corp., Boston, MA, USA), was used as the calibration standard. Since output power and beam quality of the diode-pumped solid-state (DPSS) lasers, which are used in the RGB-DPAS instrument, are sensitive to ambient conditions such as temperature and humidity, signal response of the RGB-DPAS at each wavelength was calibrated independently in this study. The calibration process involved generating Cab-O-Jet particles from atomizing water suspension of Cab-O-Jet followed by drying in a diffusion dryer. We then size-selected Cab-O-Jet particles of 300 nm in electrical-mobility diameter by using a DMA to minimize the contribution of double charged particle (Zangmeister et al. Citation2019). We varied the sample number concentration by diluting with clean air with variable dilution ratios. The wavelength-dependent absorption coefficients at each dilution ratio were calculated based on the number concentration (measured using a CPC), effective density (0.82 g cm−3, measured using DMA-APM technique), and assuming MAC at 550 nm = 7.89 ± 0.25 m2 g−1 and AAE =1.03 ± 0.09 (You et al. Citation2016). We used linear regression to obtain the calibration coefficient at each wavelength. The calibration results are also listed in Table S1.
To investigate the effect of difference in calibration method (particularly particle-based approach vs gas absorption standards), the Multi-PAS III was also calibrated using NO2 gas (1–5 ppm in dry N2) with the determined NO2 absorption cross-section of (5.93 ± 0.47)×10−19 cm2 mol−1 and (1.49 ± 0.18)×10−19 cm2 mol−1 at 422 nm and 532 nm, respectively (Vandaele et al. Citation2002). The values of absorption cross sections were determined by taking the average of the high-resolution reference results between ±1 nm of the laser wavelength, respectively. The uncertainty represents the fluctuation of NO2 absorption cross section within the averaged spectral range.
During the NO2 calibration, gas density variation due to using N2 or air, which causes a shift of acoustic resonance frequency, has been taken into account by adjusting modulation frequency from scanning acoustic profile in real-time for the Multi-PAS III instrument. Linear regressions of the photoacoustic signal responses at 422 and 532 nm against the absolute absorption calculated from the NO2 absorption cross-section at the same wavelength led to the determination of the PAS cell constant, and the average of the NO2 calibration constants at two wavelength was used as the instrumental calibration coefficient, which was then applied to calculate the real-time babs values from the photoacoustic signal responses at each wavelength. Due to the absence of reliable NO2 absorption cross-section data at 781 nm, we opted to exclude the 781 nm laser from the calibration process. The difference in the two calibration approaches is discussed in Section 3.3.
3. Results and discussion
3.1. Generation of brown carbon and black carbon aerosols
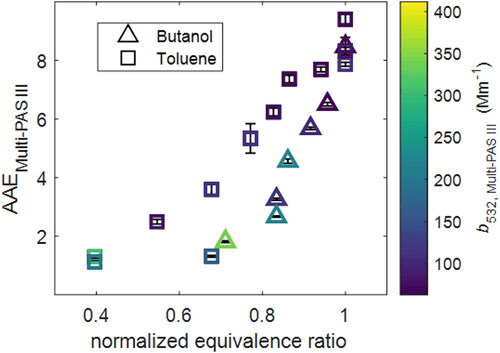
In this study, we controlled combustion conditions (equivalence ratio) based on the real-time light-absorption properties (MAC and AAE) retrieved from Multi-PAS III and SMPS to generate aerosols with our desired light-absorption properties. As shown in , our results show that aerosols generated at more efficient combustion condition (lower equivalence ratio) have higher AAE, indicating they have higher light absorption properties, which is consistent with our previous results in Cheng et al. (Citation2019). By applying the calibration coefficients obtained with the particle-based approach, as described in Section 2.3, photoacoustic signal responses of the Multi-PAS III and RGB-DPAS instruments were converted into aerosol absorption coefficients, in Mm−1, at each wavelength. The zeroing processes of the photoacoustic measurements were performed by flowing the aerosol samples into a high-efficiency-particulate-air (HEPA) filter to remove all the aerosols before entering the photoacoustic instruments. At the beginning of each test point, a zeroing process was taken to provide the baseline information for the photoacoustic measurements at this test point. The averaged babs for each sample was calculated after the zero correction and was used in the following to determine MAC for the aerosols.
Figure 2. Comparison of the AAE values obtained from the Multi-PAS III and normalized equivalence ratio. Symbols are colored by Multi-PAS III measured absorption coefficient at 532 nm (babs,532,Multi-PAS III). Error bars represent measurement uncertainties (see Uncertainty Analysis in SI).
The SMPS instrument measured particle size distributions of the light-absorbing aerosols (presented in the online supplementary information [SI], ), which were later used for the determination of particle mass concentration (mp). mp is calculated by multiplying particle volume concentration (Vp) by ρeff, and Vp was determined by taking integral of the particle size distribution. Particle mass size distributions of the aerosols from 1-butanol are presented in . It shows that particle size decreased with increasing AAE, consistent with previous results in Cheng et al. (Citation2019). However, this should not be taken as indication that AAE and particle size are intrinsically inversely correlated. Particles form as combustion emissions cool down and gaseous species start to condense depending on their volatility and overall concentration of species, according to equilibrium partitioning theory (Donahue et al. Citation2006). Decrease in AAE corresponds to increase in light absorption (darkness) and is correlated with decrease in volatility (Saleh, Cheng, and Atwi Citation2018). Therefore, less light-absorbing BrC (which appears lighter in color) is more volatile and partitions less to the particle phase leading to smaller particles. Note, however, that larger/smaller particles of the same BrC could be produced by increasing/decreasing the overall concentration of the condensing species. To calculate mp from the particle size distributions, we used effective density values obtained as described in Section 2.2. For pure BrC particles, typically with AAE > 3, the measured effective density was approximately 1.2 g cm−3. Since these particles are expected to be near-spherical (Saleh, Cheng, and Atwi Citation2018), the effective density is approximately equal to the actual material density. For particles that had significant BC fraction, typically with AAE < 3, the effective densities ranged between 0.25 and 1 g cm−3, typical for fractal BC-containing particles (Slowik et al. Citation2004). mp values from all experiments are listed in Tables S1 and S2 for the aerosols generated from toluene and 1-butanol respectively.
After the determination of mp for the aerosols, we were able to calculate MAC of the aerosols for each sample as follows:
(2)
(2)
From the Multi-PAS III measurements, we obtained the MAC values at 422, 532, and 781 nm, while from the RGB-DPAS measurements, the MAC values at 473, 532, and 671 nm were determined. All the obtained MAC values are listed in Tables S2 and S3 for the aerosols generated from toluene and 1-butanol, respectively.
We calculated AAE using the obtained absorption coefficient values at multiple wavelengths as follows:
(3)
(3)
where babs,532 is the babs value at 532 nm and λ is the optical wavelength. For each sample, the AAE values from the two photoacoustic measurements were determined via nonlinear regression fits to EquationEquation (3)
(3)
(3) . All the determined AAE values are also listed in Tables S2 and S3.
We have previously shown that MAC532 and AAE are inversely correlated, where strongly light-absorbing carbonaceous aerosols are characterized by larger MAC532 and smaller AAE (Cheng et al. Citation2019). This is consistent with strong carbonaceous aerosol absorption being associated with smaller optical energy gaps that extend its absorption into longer wavelengths, thus resulting in flatter absorption spectra (smaller AAE) (Corbin et al. Citation2019).
The MAC and AAE values ranged from 6.5 ± 0.38 m2g−1 and 1.3 ± 0.05, indicative of BC-dominated aerosol similar to that emitted from internal combustion engines (Bond and Bergstrom Citation2006; Russell et al. Citation2010; Lack et al. Citation2014), to 0.19 ± 0.01 m2g−1 and 9.4 ± 0.16, indicative of weakly absorbing BrC similar to that emitted from low-temperature biomass pyrolysis/smoldering (Chakrabarty et al. Citation2016; Browne et al. Citation2019; Li et al. Citation2016). MAC and AAE values between these limits we obtained in this study cover the range reported in literature for biomass and biofuel combustion emissions (Saleh et al. Citation2013, Citation2014; Kumar et al. Citation2018; Xie et al. Citation2018; Saleh Citation2020).
3.2. Comparison of measurements by the two photoacoustic instruments
The major goal of this study was to compare the performance of the Multi-PAS III and single-pass RGB-DPAS instruments in determining aerosol light-absorption properties. The spectral range of the Multi-PAS III and RGB-DPAS is slightly different, with the RGB-DPAS at the visible 473–671 nm and the Multi-PAS III at the larger range of 422–781 nm.
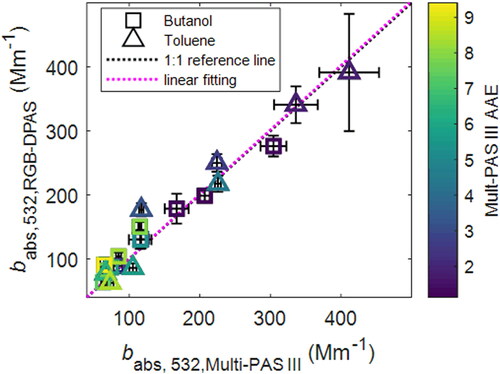
Since both the Multi-PAS III and the RGB-DPAS instruments operate at 532 nm, we compared the aerosol absorption results at this wavelength from the two instruments. A linear correlation plot of babs for all the samples was shown in . The triangles in the figure represent the measurements of the samples from the toluene combustion and the squares represent the samples from 1-butanol combustion. A linear regression fit from 50 to 400 Mm−1 yielded a linear factor of 1.005 ± 0.029, with the correlation coefficient R2 = 0.95, implying an excellent linear correlation between the two instruments at 532 nm.
Figure 3. Comparison of the measured absorption coefficients from the Multi-PAS III and single-pass RGB-DPAS. Black dotted line is 1:1 reference line. The Purple dotted line is the linear fitting (babs,532,RGB-DPAS = 1.005 babs,532,Multi-PAS III, R2 = 0.9437). Symbols are colored by Multi-PAS III measured AAE (AAEMulti-PAS III). Error bars represent measurement uncertainties (see Uncertainty Analysis in SI).
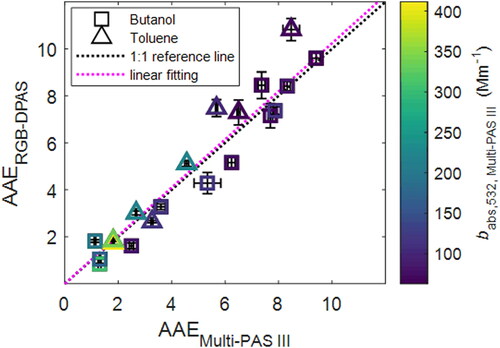
The obtained AAE values from the two photoacoustic measurements on the aerosols were also compared, as demonstrated in . A non-linear regression fit of the AAE values from EquationEquation (3)(3)
(3) led to a linear factor of 1.029 ± 0.038 with R2 = 0.92, indicating a good agreement between the two instruments in the determination of AAE for light-absorbing aerosols. The uncertainties of the AAE results are the standard deviation via the non-linear fit.
Figure 4. Comparison of the AAE values obtained from the Multi-PAS III and single-pass RGB-DPAS. Black dotted line is 1:1 reference line. The Purple dotted line is the linear fitting (AAERGB-DPAS = 1.021 AAEMulti-PAS III, R2 = 0.9171). Symbols are colored by Multi-PAS III measured absorption coefficient at 532 nm (babs,532,Multi-PAS III). Error bars represent measurement uncertainty (see Uncertainty Analysis in SI).
To further verify the agreement between the Multi-PAS III and RGB-DPAS instruments, we used the obtained absorption coefficients at 532 nm on either instrument and the AAE values of the other instrument to determine the predicted absorption coefficients at each other’s wavelengths (e.g., babs,Multi-PAS III,predicted(λ) = babs,532,Multi-PA (532/λ)AAERGB-DPAS). Linear plots of the comparisons are shown in . These comparisons demonstrate good agreement between the two instruments, especially at 473 and 671 nm, implying interpolation of the measurement results generates better agreements than extrapolation.
Figure 5. Comparison between measured and predicted the absorption coefficients at (a) 422 nm and (babs,422,Multi-PAS III) and (b) 781 nm (babs,781,Multi-PAS III) for Multi-PAS III, and (c) 473 nm (babs,473,RGB-DPAS) and (d) 671 nm (babs,671,RGB-DPAS) for RGB-DPAS. Predicted absorption coefficients at each wavelength for Multi-PAS III or RGB-DPAS are calculated using obtained the absorption coefficients at 532 nm on the instrument and the AAE values of the other instrument (e.g., babs,Multi-PAS III (λ) = babs,532,Multi-PAS (532/λ)AAERGB-DPAS). Black dotted line is 1:1 reference line. The Purple dotted line is the linear fitting [(a) babs,Multi-PAS III,422,predicted = 0.9838 babs,Multi-PAS III,422, R2 = 0.8493; (b) babs,Multi-PAS III,781,predicted = 0.8761 babs,Multi-Pas III,781, R2 = 0.9580; (c) babs,RGB-DPAS,473,predicted = 0.9722 babs,RGB-DPAS,473, R2 = 0.8923; (d) babs,RGB-DPAS,671,predicted = 0.9547 babs,RGB-DPAS,671, R2 = 0.9921]. Symbols are colored by Multi-PAS III measured AAE (AAEMulti-PAS III). Error bars represent measurement uncertainties (see Uncertainty Analysis in SI).
![Figure 5. Comparison between measured and predicted the absorption coefficients at (a) 422 nm and (babs,422,Multi-PAS III) and (b) 781 nm (babs,781,Multi-PAS III) for Multi-PAS III, and (c) 473 nm (babs,473,RGB-DPAS) and (d) 671 nm (babs,671,RGB-DPAS) for RGB-DPAS. Predicted absorption coefficients at each wavelength for Multi-PAS III or RGB-DPAS are calculated using obtained the absorption coefficients at 532 nm on the instrument and the AAE values of the other instrument (e.g., babs,Multi-PAS III (λ) = babs,532,Multi-PAS (532/λ)AAERGB-DPAS). Black dotted line is 1:1 reference line. The Purple dotted line is the linear fitting [(a) babs,Multi-PAS III,422,predicted = 0.9838 babs,Multi-PAS III,422, R2 = 0.8493; (b) babs,Multi-PAS III,781,predicted = 0.8761 babs,Multi-Pas III,781, R2 = 0.9580; (c) babs,RGB-DPAS,473,predicted = 0.9722 babs,RGB-DPAS,473, R2 = 0.8923; (d) babs,RGB-DPAS,671,predicted = 0.9547 babs,RGB-DPAS,671, R2 = 0.9921]. Symbols are colored by Multi-PAS III measured AAE (AAEMulti-PAS III). Error bars represent measurement uncertainties (see Uncertainty Analysis in SI).](/cms/asset/35b0a69e-145c-4db8-ab8b-f04eeb13eee5/uast_a_1849537_f0005_c.jpg)
As the photoacoustic techniques start to be widely used for aerosol light absorption measurements in replacing the filter-based methods (Arnott et al. Citation2005b; Moosmüller, Chakrabarty, and Arnott Citation2009; Lack et al. Citation2012; Stier et al. Citation2007), our results from this study demonstrate that even with different optical design and pass-length, if the instruments are calibrated with the same approach, photoacoustic instruments are capable of providing similar results both in direct absorption detection and in wavelength-dependent absorption properties.
3.3. The effect of difference in calibration method
As described in Section 2.3, the Multi-PAS III was calibrated using both NO2 and Cab-O-Jet, which allowed for comparing the dependence of measured carbonaceous aerosol light-absorption properties on the choice of calibration method. Each method has advantages and disadvantages, briefly discussed below.
NO2 has unique broad and discrete absorption features in the entire visible spectral region (Vandaele et al. Citation2002). The approach of using NO2 to calibrate the PAS instruments for aerosol light absorption measurements has technical advantages for atmospheric applications, such as well-known absorption cross section values from ultraviolet to near-infrared, which have been well-documented and can be independently measured (e.g., using cavity ring-down techniques; Fischer and Smith Citation2018b). Furthermore, NO2 can be easily generated at different concentrations from commercially available standards, which are particularly useful for automatic calibration in the field. The major drawback associated with NO2 calibration is the limited range of wavelengths in which it can be applied. The photodissociation threshold of NO2 from ground state is 405 nm. Moreover, dependent on measurement temperature, a portion of the NO2 molecules could allocate to the lowest vibrational excited state, which is 749.6 cm−1 higher than the ground state. Therefore, calibration up to 418 nm could be impacted by the photodissociation of NO2 at ambient condition, thus limiting the applicability of NO2 calibration for short visible and UV wavelengths. Furthermore, the absorption cross section of NO2 drops significantly at long-visible wavelengths (<10−20 cm2 mol−1 for wavelength >650 nm; Vandaele et al. Citation2002), which makes the calibration at this spectral region difficult.
Particle-based calibration techniques have been proposed to overcome some of the shortcomings associated with NO2 (Lack et al. Citation2006, Citation2014; Bluvshtein et al. Citation2017; Fischer and Smith Citation2018a). Although most of the particle-based calibrations approaches assume a known refractive index or MAC, Gyawali et al. (Citation2012) developed a procedure using kerosene soot that didn’t require assumptions about the refractive index. Zangmeister and Radney (Citation2018) introduced a particle-based calibration technique using water-dispersible synthetic carbon black, Cab-O-Jet, which has relatively stable refractive index during production. They have also characterized the physical properties of this standard including light absorption (You et al. Citation2016) to determine MAC and AAE of Cab-O-Jet in the optical spectral region. This method has the technical advantage of applicability from ultraviolet to near-infrared. However, the calibration process is more involved than with gases, which gives rise to compounding uncertainties in number concentration (CPC) and particle size (DMA), as well as the contribution of multiply charged particles of the same electrical mobility. The effect of multiply charged particles can be reduced by selecting particles from the large-end tail of the distribution or using a second electrical-mobility classification step (i.e., a second DMA), but both result in low sample concentrations leading to higher counting uncertainties. Furthermore, the light-absorption properties reported for Cab-O-Jet were measured using PAS systems (each relying on different calibration schemes) (You et al. Citation2016; Zangmeister and Radney Citation2018; Zangmeister et al. Citation2019) and have not been independently verified with other techniques.
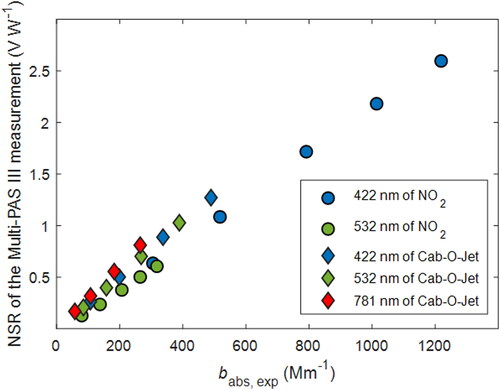
The difference between the two calibration approaches is illustrated in . For NO2 calibration, the calibration coefficients at 422 nm and 532 nm were 0.0021 V W−1 Mm and 0.0019 V W−1 Mm, respectively. The difference between the two might be due to photodissociation of NO2 at the short wavelength. In the subsequent calculations, we applied the average of the two calibration coefficients (0.0020 W V−1 Mm) to all wavelengths. The calibration coefficients for Cab-O-Jet were 0.0026 W V−1 Mm, 0.0026 W V−1 Mm, and 0.0030 V W−1 Mm at 422 nm, 532 nm, and 781 nm, respectively. The different calibration coefficient at 781 nm is due to the difference between assumed Cab-O-Jet AAE of unity (You et al. Citation2016) and the AAE obtained from the normalized signal response (NSR). Note that since the Multi-PAS III utilizes a single cell (Fischer and Smith Citation2018a), AAE measured for an aerosol is not a function of calibration coefficient. For Cab-O-Jet, the AAE obtained from NSR between 532 and 422 nm (AAE532-422) was 0.97, which is close to the assumed AAE, thus the calibration coefficients at 422 and 532 nm are consistent. On the other hand, AAE781-532 was 0.6, thus there is a difference between the calibration coefficient at 532 and 781 nm. As can be inferred from the difference in calibration coefficients, when calibrated by NO2, the Cab-O-Jet MAC532 measured by the Multi-PAS III (10.2 ± 0.3 m2 g−1) is larger than the assumed value from You et al. (Citation2016) (8.1 m2 g−1). Both these values are within the range reported in the inter-laboratory study by Zangmeister and Radney (Citation2018).
Figure 6. Calibration of the Multi-PAS III instrument with NO2 and air-borne Cab-O-Jet aerosols. Y axis represents the obtained normalized signal responses (microphone signal/photodiode signal). X axis represents the expected light absorption coefficient.
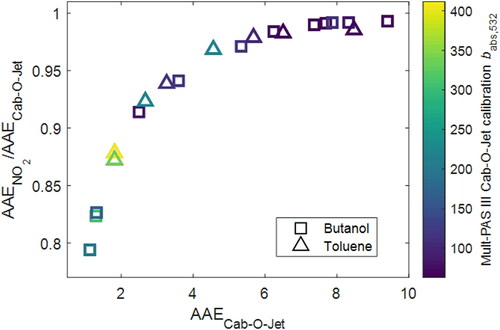
Using NO2 calibration, the measured absorption coefficients of the carbonaceous aerosol (and thus the retrieved MAC values) would be larger than those obtained using Cab-O-Jet by 31% at 422 and 532 nm and by 52% at 781 nm. The difference in AAE, however, depends on the AAE of the sample. As shown in , the AAE obtained using NO2 calibration is smaller than that obtained using Cab-O-Jet by 20% for the samples with smallest AAE. However, the difference between the two calibration methods drops to close to 0% for AAE > 7.
Figure 7. Comparison of carbonaceous aerosol AAE values retrieved from the Multi-PAS III measurements based on NO2 calibration and those based on Cab-O-Jet calibration. Symbols are colored by babs,532 values measured by the Multi-PAS III based on Cab-O-Jet calibration. Error bars represent measurement uncertainties (see Uncertainty Analysis in SI).
Since both the NO2 and the particle-based calibration approaches each have their advantages and disadvantages, selecting a calibration method may depend on technical specifications of the photoacoustic instruments. For the RGB-DPAS instrument, an aluminized thin-film with a 50 nm conductive coating is used to protect the MEMS microphones from particles and humidity in the samples. High concentrations of NO2 can cause chemical etching of the conductive coating and significantly reduce the lifetime of the thin-film. Thus, we recommend using particle-based approaches for the calibration of the RGB-DPAS instrument.
4. Conclusions
In this study, we demonstrated the formation of light-absorbing aerosols with a large variety of optical properties, from a laboratory combustion source, of which combustion temperature and equivalence ratio can be precisely controlled. The generated aerosols were characterized by two different photoacoustic measurement techniques: the RGB-DPAS instrument operating at 671, 532, and 473 nm; and the multi-PAS instrument operating at 781, 532, and 422 nm. Using an aerosol-based calibration scheme, we found that the two photoacoustic instruments yielded nearly identical measurement results on light-absorbing aerosols, in terms of mass absorption cross-section (MAC) and absorption Ångström exponent (AAE), despite different optical designs. However, differences in calibration scheme (NO2 versus Cab-O-Jet in this study) led to significant differences in measured light-absorption properties under certain conditions.
Supplemental Material
Download Zip (94.7 KB)Acknowledgments
The authors thank Drs. Andy Freedman and Richard Miake-Lye at Aerodyne Research, Inc., Drs. Richard Moore and Bruce Anderson at NASA Langley Research Center, and Dr. Geoffrey Smith at the University of Georgia for helpful discussions.
Additional information
Funding
Related Research Data
References
- Andreae, M. O., and A. Gelencsér. 2006. Black carbon or brown carbon? The nature of light-absorbing carbonaceous aerosols. Atmos. Chem. Phys. 6 (10):3131–48. doi:https://doi.org/10.5194/acp-6-3131-2006.
- Arnott, W. P., H. MoosmüLler, and J. W. Walker. 2000. Nitrogen dioxide and kerosene-flame soot calibration of photoacoustic instruments for measurement of light absorption by aerosols. Rev. Sci. Instrum. 71 (12):4545–52. doi:https://doi.org/10.1063/1.1322585.
- Arnott, W. P., B. Zielinska, C. F. Rogers, J. Sagebiel, K. Park, J. Chow, H. Moosmüller, J. G. Watson, K. Kelly, D. Wagner, et al. 2005a. Evaluation of 1047-nm photoacoustic instruments and photoelectric aerosol sensors in source-sampling of black carbon aerosol and particle-bound PAHs from gasoline and diesel powered vehicles. Environ. Sci. Technol. 39 (14):5398–406. doi:https://doi.org/10.1021/es049595e.
- Arnott, W. P., K. Hamasha, H. Moosmüller, P. J. Sheridan, and J. A. Ogren. 2005b. Towards aerosol light-absorption measurements with a 7-wavelength aethalometer: Evaluation with a photoacoutic instrument and 3-wavelength nephelometer. Aerosol. Sci. Technol 39 (1):17–29. doi:https://doi.org/10.1080/027868290901972.
- Bluvshtein, N., J. M. Flores, Q. He, E. Segre, L. Segev, N. Hong, A. Donohue, J. N. Hilfiker, and Y. Rudich. 2017. Calibration of a multi-pass photoacoustic spectrometer cell using light-absorbing aerosols. Atmos. Meas. Tech. 10 (3):1203–13. doi:https://doi.org/10.5194/amt-10-1203-2017.
- Bond, T. C., and R. W. Bergstrom. 2006. Light absorption by carbonaceous particles: An investigative review. Aerosol. Sci. Technol. 40 (1):27–67. [Database] doi:https://doi.org/10.1080/02786820500421521.
- Bond, T. C., S. J. Doherty, D. W. Fahey, P. M. Forster, T. Berntsen, B. J. DeAngelo, M. G. Flanner, S. Ghan, B. Kärcher, D. Koch, et al. 2013. Bounding the role of black carbon in the climate system: A scientific assessment. J. Geophys. Res. Atmos. 118 (11):5380–552. doi:https://doi.org/10.1002/jgrd.50171.
- Browne, E. C., X. Zhang, J. P. Franklin, K. J. Ridley, T. W. Kirchstetter, K. R. Wilson, K. R. Wilson, C. D. Cappa, and J. H. Kroll. 2019. Effect of heterogeneous oxidative aging on light absorption by biomass burning organic aerosol. Aerosol. Sci. Technol. 53 (6):663–74. doi:https://doi.org/10.1080/02786826.2019.1599321.
- Carslaw, K. S., O. Boucher, D. V. Spracklen, G. W. Mann, J. G. L. Rae, S. Woodward, and M. Kulmala. 2010. A review of natural aerosol interaction and feedbacks within the Earth system. Atmos. Chem. Phys. 10 (4):1701–37. doi:https://doi.org/10.5194/acp-10-1701-2010.
- Chakrabarty, R. K., M. Gyawali, R. L. N. Yatavelli, A. Pandey, A. C. Watts, J. Knue, L.-W. A. Chen, R. R. Pattison, A. Tsibart, V. Samburova, et al. 2016. Brown carbon aerosols from burning of boreal peatlands: microphysical properties, emission factors, and implications for direct radiative forcing. Atmos. Chem. Phys. 16 (5):3033–40. doi:https://doi.org/10.5194/acp-16-3033-2016.
- Cheng, Z., K. Atwi, T. Onyima, and R. Saleh. 2019. Investigating the dependence of light-absorption properties of combustion carbonaceous aerosols on combustion conditions. Aerosol. Sci. Technol. 53 (4):419–34. doi:https://doi.org/10.1080/02786826.2019.1566593.
- Corbin, J. C., H. Czech, D. Massabo, F. Buatier de Mongeot, G. Jakobi, F. Liu, P. Lobo, C. Mennucci, A. A. Mensah, J. Orasche, et al. 2019. Infrared-absorbing carbonaceous tar can dominate light absorption by marine-engine exhaust. npj Clim. Atmos. Sci. 2:12.
- DeCarlo, P. F., J. Slowik, D. R. Worsnop, P. Davidovits, and J. L. Jimenez. 2004. Particle morphology and density characterization by combined mobility and aerodynamic diameter measurements. Part 1: Theory. Aerosol. Sci. Technol. 38 (12):1206–22.
- Donahue, N. M., A. L. Robinson, C. O. Stanier, and S. N. Pandis. 2006. Coupled partitioning, dilution, and chemical aging of semivolatile organics. Environ. Sci. Technol. 40 (8):2635–43. doi:https://doi.org/10.1021/es052297c.
- Fischer, D. A., and G. D. Smith. 2018a. A portable, four-wavelength, single-cell photoacoustic spectrometer for ambient aerosol absorption. Aerosol. Sci. Technol. 52 (4):393–406. doi:https://doi.org/10.1080/02786826.2017.1413231.
- Fischer, D. A., and G. D. Smith. 2018b. Can ozone be used to calibrate aerosol photoacoustic spectrometers? Atmos. Meas. Tech. 11 (12):6419–27. doi:https://doi.org/10.5194/amt-11-6419-2018.
- Gyawali, M., W. P. Arnott, R. A. Zaveri, C. Song, H. Moosmüller, L. Liu, M. I. Mishchenko, L.-W. A. Chen, M. C. Green, J. G. Watson, et al. 2012. Photoacoustic optical properties at UV, VIS, and near IR wavelengths for laboratory generated and winter time ambient urban aerosols. Atmos. Chem. Phys. 12 (5):2587–601. doi:https://doi.org/10.5194/acp-12-2587-2012.
- Kumar, N. K., J. C. Corbin, E. A. Bruns, D. Massabó, J. G. Slowik, L. Drinovec, G. Močnik, P. Prati, A. Vlachou, U. Baltensperger, et al. 2018. Production of particulate brown carbon during atmospheric aging of residential wood-burning emissions. Atmos. Chem. Phys. 18 (24):17843–61. doi:https://doi.org/10.5194/acp-18-17843-2018.
- Lack, D. A., E. R. Lovejoy, T. Baynard, A. Pettersson, and A. R. Ravishankara. 2006. Aerosol absorption measurement using photoacoustic spectroscopy; sensitivity, calibration, and uncertainty developments. Aerosol. Sci. Technol. 40 (9):697–708. doi:https://doi.org/10.1080/02786820600803917.
- Lack, D. A., M. S. Richardson, D. Law, J. M. Langridge, C. D. Cappa, R. J. Mclaughlin, and D. M. Murphy. 2012. Aircraft instrument for comprehensive characterization of aerosol optical properties, part 2: Black and brown carbon absorption and absorption enhancement measured with photo acoustic spectroscopy. Aerosol. Sci. Technol. 46 (5):555–68. doi:https://doi.org/10.1080/02786826.2011.645955.
- Lack, D. A., H. Moosmüller, G. R. McMeeking, R. K. Chakrabarty, and D. Baumgardner. 2014. Characterizing elemental, equivalent black, and refractory black carbon aerosol particles: A review of techniques, their limitations and uncertainties. Anal. Bioanal. Chem. 406 (1):99–122. doi:https://doi.org/10.1007/s00216-013-7402-3.
- Laskin, A., J. Laskin, and S. A. Nizkorodov. 2015. Chemistry of atmospheric brown carbon. Chem. Rev. 115 (10):4335–82. doi:https://doi.org/10.1021/cr5006167.
- Li, X., Y. Chen, and T. C. Bond. 2016. Light absorption of organic aerosol from pyrolysis of corn stalk. Atmos. Environ. 144:249–56. doi:https://doi.org/10.1016/j.atmosenv.2016.09.006.
- Malloy, Q., S. Nakao, L. Qi, R. L. Austin, C. Stothers, H. Hagino, and D. R. Cocker. 2009. Real-time aerosol density determination utilizing a modified scanning mobility particle sizer—aerosol particle mass analyzer system. Aerosol. Sci. Technol. 43 (7):673–8. doi:https://doi.org/10.1080/02786820902832960.
- McMurry, P. H., X. Wang, K. Park, and K. Ehara. 2002. The relationship between mass and mobility for atmospheric particles: a new technique for measuring particle density. Aerosol. Sci. Technol. 36 (2):227–38. doi:https://doi.org/10.1080/027868202753504083.
- Moosmüller, H., R. K. Chakrabarty, and W. P. Arnott. 2009. Aerosol light absorption and their measurement: A review. J. Quant. Spectrsc. Radiat. Transfer 110 (11):844–78. doi:https://doi.org/10.1016/j.jqsrt.2009.02.035.
- O’Keefe, A., and D. A. G. Deacon. 1988. Cavity ring-down optical spectrometer for absorption measurements using pulsed laser sources. Rev. Sci. Instrum. 59:2544–54.
- Russell, P. B., R. W. Bergstrom, Y. Shinozuka, A. D. Clarke, P. F. DeCarlo, J. L. Jimenez, J. M. Livingston, J. Redemann, O. Dubovik, and A. Strawa. 2010. Absorption angstrom exponent in AERONET and related data as an indicator of aerosol composition. Atmos. Chem. Phys. 10 (3):1155–69. doi:https://doi.org/10.5194/acp-10-1155-2010.
- Saleh, R. 2020. From measurements to models: Toward accurate representation of brown carbon in climate calculations. Curr. Pollut. Rep. 6 (2):90–104. doi:https://doi.org/10.1007/s40726-020-00139-3.
- Saleh, R., C. J. Hennigan, G. R. McMeeking, W. K. Chuang, E. S. Robinson, H. Coe, N. M. Donahue, and A. L. Robinson. 2013. Absorptivity of brown carbon in fresh and photo-chemically aged biomass-burning emissions. Atmos. Chem. Phys. 13 (15):7683–93. doi:https://doi.org/10.5194/acp-13-7683-2013.
- Saleh, R., E. S. Robinson, D. S. Tkacik, A. T. Ahern, S. Liu, A. C. Aiken, R. C. Sullivan, A. A. Presto, M. K. Dubey, R. J. Yokelson, et al. 2014. Brownness of organics in aerosols from biomass burning linked to their black carbon content. Nature Geosci. 7 (9):647–50. doi:https://doi.org/10.1038/ngeo2220.
- Saleh, R., Z. Cheng, and K. Atwi. 2018. The brown-black continuum of light-absorbing combustion aerosols. Environ. Sci. Technol. Lett. 5 (8):508–13. doi:https://doi.org/10.1021/acs.estlett.8b00305.
- Samset, B. H., C. W. Stjern, E. Andrews, R. A. Kahn, G. Myhre, M. Schulz, and G. L. Schuster. 2018. Aerosol absorption: Progress towards global and regional constraints. Curr. Clim. Change Rep. 4 (2):65–83. doi:https://doi.org/10.1007/s40641-018-0091-4.
- Slowik, J. G., K. Stainken, P. Davidovits, L. R. Williams, J. T. Jayne, C. E. Kolb, D. R. Worsnop, Y. Rudich, P. E. DeCarlo, and J. L. Jimenez. 2004. Particle morphology and density characterization by combined mobility and aerodynamic diameter measurements. Part 2: Application to combustion-generated soot aerosols as a function of fuel equivalence ratio. Aerosol. Sci. Technol. 38 (12):1206–22. doi:https://doi.org/10.1080/027868290903916.
- Stier, P., H. J. Seinfeld, S. Kinne, and O. Boucher. 2007. Aerosol absorption and radiative forcing. Atmos. Chem. Phys. 7 (19):5237–61. doi:https://doi.org/10.5194/acp-7-5237-2007.
- Vandaele, A. C., C. Hermans, S. Fally, M. Carleer, R. Colin, M.-F. Mériemme, A. Jenouvrier, and B. Coquart. 2002. High-resolution Fourier transform measurement of the NO2 visible and near-infrared absorption cross sections: Temperature and pressure effects. J. Geophys. Res. 107 (D18):4348. doi:https://doi.org/10.1029/2001JD000971.
- Xie, M., G. Shen, A. L. Holder, M. D. Hayes, and J. J. Jetter. 2018. Light absorption of organic carbon emitted from burning wood, charcoal, and kerosene in household cookstoves. Environ. Pollut. 240:60–67. doi:https://doi.org/10.1016/j/envpol.2018.04.085.
- You, R., J. G. Radney, M. R. Zachariah, and C. D. Zangmeister. 2016. Measured wavelength-dependent absorption enhancement of internally mixed black carbon with absorbing and nonabsorbing materials. Environ. Sci. Technol. 50 (15):7982–90. doi:https://doi.org/10.1021/acs.est.6b01473.
- Yu, Z., G. Magoon, J. Assif, W. Brown, and R. Miake-Lye. 2019. A single-pass RGB differential photoacoustic spectrometer (RGB-DPAS) for aerosol absorption measurement at 473, 532, and 671 nm. Aerosol. Sci. Technol. 53 (1):94–105. doi:https://doi.org/10.1080/02786826.2018.1551611.
- Zangmeister, C. D., and J. G. Radney. 2018. NIST interlaboratory study of aerosol absorption meausrements using photoacoustic spectroscopy. NIST Technical Note—1989.
- Zangmeister, C. D., C. D. Grimes, R. Russell, R. R. Dickerson, and J. G. Radney. 2019. Characterization and demonstration of a black carbon aerosol mimic for instrument evaluation. Aerosol. Sci. Technol. 53 (11):1322–33. doi:https://doi.org/10.1080/02786826.2019.1660302.