
 ?Mathematical formulae have been encoded as MathML and are displayed in this HTML version using MathJax in order to improve their display. Uncheck the box to turn MathJax off. This feature requires Javascript. Click on a formula to zoom.
Abstract
Innovation and technological development have led to a proliferation of various low-cost air quality monitors, most of which use light scattering techniques to detect airborne particles. As these monitors are used in various environments, their testing should also be performed in diverse environments and with different particle types. This study evaluated three Foobot units and three AirVisual Nodes in two laboratory environments and in one residential apartment when measuring five types of aerosols (0.72 and 2.00 µm polystyrene latex (PSL) spheres, Arizona Road Dust (ARD), nanosilver-based surface cleaner, and particles created by a cooking event). The low-cost monitors were highly correlated with the DustTrak DRX (TSI) for most aerosol types (r > 0.78), except when measuring nanosilver spray, where the r value decreased to 0.55. For PSL spheres, Foobot overestimated DRX PM2.5 concentrations while AirVisual's readings were closer to those of DRX and aligned relatively well with the 1:1 line. Both Foobot and AirVisual underestimated PM2.5 concentrations for ARD, nanosilver spray, and particles from a cooking event. Overall, the Foobots reported higher PM2.5 concentrations than the AirVisuals, except when measuring particles created by the cooking event. The paired monitors' precision error varied between 0.15 and 0.47, depending on the aerosol type and monitor pairs. The coefficient of variation ranged from 15.2% to 21.0% for the Foobots and from 12.5% to 28.7% for the AirVisuals. Both monitors showed high accuracy and precision when measuring temperature and humidity as compared to the IAQ Meter (TSI Inc.). AirVisual showed high accuracy and precision when measuring CO2, as compared to the IAQ meter. Foobot, however, didn't report accurate CO2 concentrations. Additionally, we found the AirVisual is easier to operate, and it provided more options to read, save, and download data.
Copyright © 2020 American Association for Aerosol Research
EDITOR:
1. Introduction
The term PM2.5 refers to airborne particulate matter (PM) with a diameter of 2.5 µm or less. Once inhaled, such particles can deposit in sensitive areas of the respiratory system, including the alveolar region, to a greater extent than larger particles (Antonini Citation2003; Pinkerton et al. Citation2000). Epidemiological and toxicological studies have shown that exposures to PM2.5 are associated with various cardiovascular and respiratory diseases (Balmes, Fine, and Sheppard Citation1987; Dominici et al. Citation2006; Kampa and Castanas Citation2008; Li et al. Citation2015; Polichetti et al. Citation2009; Pope and Dockery Citation2006; Seaton et al. Citation1995; Tecer et al. Citation2008). Sensitive populations, among them elderly, children, and infirm, are particularly affected (Koenig et al. Citation2005; Liao et al. Citation1999; Taylor and Nourbakhsh Citation2015). The negative impacts of PM2.5 on health and the environment make it imperative to control and, ultimately, reduce concentrations of this pollutant.
The continuous monitoring of PM2.5 concentration levels is part of the effort to control ambient PM2.5. The United States Environmental Protection Agency (U.S. EPA) has been monitoring ambient air pollutant levels, including PM2.5, through a nationwide network of sites. The instruments used in such networks must perform according to either the Federal reference method (FRM) or Federal equivalent methods (FEM). Monitoring that adheres to FRM and FEM requirements produces high-quality data, and the EPA, state, tribal and local environmental agencies use these data to ensure that levels of airborne pollutants, including PM2.5, are in compliance with the National Ambient Air Quality Standards (NAAQS) (U.S. EPA Citation2018). However, the expense, time, and effort needed to ensure compliance with the FRM and FEM requirements make the air quality data geographically sparse, thus limiting our ability to characterize spatial and temporal pollutant variability and sources on a finer scale (Jiao et al. Citation2016; Zamora et al. Citation2019).
Recent technological developments have resulted in the arrival of multiple low-cost air quality monitors that promise to democratize air pollution measurements. These low-cost monitors can be widely deployed to report local air pollution data in real-time and have the potential to expand the existing ambient air monitoring networks (Feenstra et al. Citation2019; Wang et al. Citation2015) due to their lightweight, low cost, and ease of operation. The internal PM2.5 sensors in such monitors typically employ a light-emitting diode-based optical detection of particles (Wang et al. Citation2015). And the measured data can be uploaded to the cloud, to a user's smartphone, or to display the readings on a monitor's screen. These features allow the sensors to be widely used in "citizen science" projects. At the same time, while many sensors and monitors are available on the market, evaluation of their accuracy and reliability is ongoing research and discussion subject (AQ-SPEC Citation2019; Holstius et al. Citation2014; Jiao et al. Citation2016; Sousan et al. Citation2017; Wang et al. Citation2015; Zamora et al. Citation2019).
Based on existing literature, the following variables seem to affect the accuracy and precision of low-cost monitors, including the two investigated monitors: (1) particle type and size (Sousan et al. Citation2017; Wang et al. Citation2015), (2) particle concentration (Gao, Cao, and Seto Citation2015; Holstius et al. Citation2014; Sousan et al. Citation2017; Wang et al. Citation2015), and (3) testing environment (Karagulian et al. Citation2019; Papapostolou et al. Citation2017; Polidori et al. Citation2017; Polidori, Papapostolou, and Zhang Citation2016).
First, monitor performance was shown to be affected by particle type. Wang et al. (Citation2015) built self-designed laboratory calibration platforms to test Shinyei PPD42NS (Shinyei Co., Chuo-ku, Kobe, Japan), Samyoung DSM501A (Samyoung Inc., Seoul, South Korea), and Sharp GP2Y1010AU0F (Sharp/Socle Technology. Taiwan, China) sensors using particles produced by atomizing NaCl, sucrose (C12H22O11), and NH4NO3 aqueous solutions. They found that different sensors have different performance depending on particle composition and that the sensor response improved with increasing particle size for the same particle mass concentration. Sousan et al. (Citation2017) observed similar effects when testing Foobot (AirBoxLab, San Francisco, CA, USA), Speck (Airviz Inc., Pittsburgh, PA, USA) with internal Syhitech DSM501A sensor (Syhitech Co., Ltd., Gwangju, South Korea), and AirBeam (HabitatMap, NY, USA) with an internal Shinyei PPD60PV-T2 sensor (Shinyei Co.) using NaCl particles, welding fumes, and Arizona Road Dust. Their results showed that the slope coefficient of linear regression varied substantially depending on the aerosol type.
Second, both laboratory and field experiments have shown that sensor performance can be affected by particle concentration. Wang et al. (Citation2015) found that Shinyei PPD42NS, Samyoung DSM501A, and Sharp GP2Y1010AU0F showed a strong linear relationship (R2 > 0.89) compared to the reference SidePak AM510 (TSI Inc., MN, USA) in laboratory experiments. Still, linear regression parameters, such as intercept, slope, and R-square varied when measuring particle concentration of 0–100 µg/m3 and then 0-300 µg/m3. Additionally, according to Sousan et al. (Citation2017), when testing with Arizona Road Dust, Speck overestimated concentrations when challenged with reference concentrations lower than 200 µg/m3 and underestimated particle concentrations when challenged with higher reference concentrations. Concentration effects were also observed in field studies. The comparison of self-designed measurement platforms built around Shinyei PPD42NS particle sensor (Shinyei Technology Co.) with Met One BAM-1020 (Met One Instruments Inc., Grants Pass, OR, USA) as a reference instrument showed a coefficient of determination R2 = 0.72 at 24 h-measurement scale when ambient PM2.5 concentration in California, USA, ranged from ∼2 to 21 μg/m3; however, the sensor's R2 had a lower value of 0.53 at the same 24 h scale compared with MiniVol Tactical Air Sampler (Airmetrics, Eugene, OR, USA) when PM2.5 concentration was much higher and ranged from ∼330.47 to 413.45 µg/m3 as measured in Xi'an, China (Gao, Cao, and Seto Citation2015; Holstius et al. Citation2014).
Third, the testing environment, including the design of a laboratory experiment and the conditions of field studies, can also affect sensor performance (Karagulian et al. Citation2019; Papapostolou et al. Citation2017; Williams et al. 2019). Since there are no standard conditions for sensor evaluations, the researchers typically design their own test protocols, and different study protocols might affect the result of a comparison. One typical laboratory comparison is a chamber test, where sensors operate side-by-side in a relatively small chamber and are challenged with well-mixed airborne particles (Sousan et al. Citation2017; Wang et al. Citation2015; Zamora et al. Citation2019). Another common design is to simulate indoor conditions in a room-size chamber, in which people might perform typical indoor activities (Manikonda et al. Citation2016; Singer and Delp Citation2018). Additionally, comparisons can be performed in real-world conditions when sensors are deployed either indoors or outdoors (Jiao et al. Citation2016; Manibusan and Mainelis Citation2020; Patel et al. Citation2017).
Besides the accuracy of low-cost monitors, the precision of different units of the same monitor is also an important performance metric. Jiao et al. (Citation2016) found that low-cost monitors might have high-precision regardless of their accuracy. In their long-term (>7 months) field test, both AirBeam (HabitatMap Inc.) with an internal Shinyei PPD60PV sensor (Shinyei Co.) and MetOne Aerocet 831 Handheld Particle Counter (Met One Instruments Inc.) had a near-perfect correlation (Pearson correlation coefficient r = 0.99) within the same monitor type; however, while AirBeam had a relatively high correlation coefficient (r = 0.65–0.66) with Met One BAM-1020 (Met One Instruments Inc.) used as a reference instrument, MetOne Aerocet 831 had a much weaker correlation (r = 0.32–0.41) with the same reference instrument (Jiao et al. Citation2016). Moreover, the precision of low-cost monitors could be affected by particle type. Zamora et al. (Citation2019) challenged three Plantower PMS A003 (Plantower Co., Ltd., Beijing, China) sensors inside a custom-built stainless-steel chamber using particles from incense, talcum powder, NaCl, and oleic acid and calculated their precision error using EquationEquation (1)(1)
(1) . The average precision error between each pair of sensors varied between 9 and 24%, depending on the aerosol type.
(1)
(1)
The study described here was in preparation for a research project to investigate strategies that seniors use to cope with heatwaves, including the effects of heatwaves on indoor air quality in their apartments (Tsoulou et al. Citation2020). The project design called for the use of two dozen air quality monitors in seniors' apartments over the summer of 2017. Therefore, we needed to select a suitable consumer-grade monitor. Here, we compared the Foobot (AirBoxLab, San Francisco, CA, USA) with the internal Sharp GP2Y1010AU0F sensor (Sharp Inc.) and the AirVisual Node (AirVisual, Hong Kong, China) with their proprietary AVPM25b sensor (). Three units of each monitor were tested to determine precision. The Foobot was selected based on previous studies, in which the Foobot demonstrated better performance compared to Speck (Carnegie Mellon University, PA, USA), and the AirBeam (HabitatMap, NY, USA) in laboratory experiments (Sousan et al. Citation2017); it was also more accurate than Air Quality Egg version 2 (Wicked Device, Ithaca, NY, USA), BlueAir Aware (BlueAir Inc., Chicago, IL, USA), and Speck (AirViz Inc., Pittsburgh, PA, USA) in residential apartments (Manibusan and Mainelis Citation2020). Another candidate monitor, the AirVisual Node, was found to have an R2 >0.64 for 5-min averaged PM2.5 in a field study when compared to an FEM device (Beta Attenuation Monitor [BAM], model 1020; Met One Instruments, Inc.), and it had an R2 >0.99 for 5-min averaged PM2.5 in a laboratory testing compared to another FEM device (Grimm Model EDM 180 PM2.5 Monitor; Grimm Technologies, Inc., Douglasville, GA, USA) (AQ-SPEC Citation2017). To compare the performance of Foobot and AirVisual, our study was conducted in two different chambers with four different particle types (i.e., 0.72 and 2.00 µm polystyrene latex spheres (PSL), ISO 12103-1 Arizona Road Dust A2 (ARD) and nano silver-based surface cleaner), and in one residential environment when cooking-generated particles were used to compare the monitors.
Table 1. Specifications of the tested low-cost monitors.
Thus, the overall objective of the study was two-fold: (1) to find out the effect of particle type and concentration on the low-cost monitor performance and (2) to evaluate the accuracy and precision of Foobot and AirVisual low-cost monitors. Also, to account for different environments, our testing was performed in a 1 m3 chamber, a room-size chamber (25 m3), and a residential indoor environment. This data, plus user experience with the two different monitors, helped us select a monitor for a field study where twenty-four units of the same monitor were deployed for a three-months-long campaign.
2. Materials and methods
2.1. Particle monitors
2.1.1. Low-cost monitors
The Foobot uses a light scattering Sharp GP2Y1010AU0F sensor to measure PM2.5 concentrations for particles ranging from 0.3 μm to 2.5 μm. It relies on natural convection to passively move air through the sensor (Sousan et al. Citation2017). The Foobot uploads data to the cloud every 5 min, and the data can be downloaded from the manufacturer's website. The Foobot also measures temperature and relative humidity, as well as the concentration of total volatile organic compounds (TVOCs); it then uses the TVOC data to indicate the carbon dioxide (CO2)-equivalent concentration (Foobot Citation2017). Three Foobot units were included in this study, and they are referred to as F1, F2, and F3.
The AirVisual Node uses laser light and a light scattering sensor AVPM25b to detect particles and reports PM2.5 and PM10 concentrations (AirVisual Citation2016). We investigated its performance when measuring PM2.5 only. The AirVisual Node has a small fan to provide a constant flow of air through the sensing chamber. Each reading reported by the sensor is adjusted by an algorithm that considers temperature and humidity (AirVisual Citation2016). The AirVisual Node provides both internal and remote data storage, and it has two modes to record data: the "Continuous Mode" measures PM every 10 s and the "Default Mode" measures PM every 10 s when being actively used and then reverts to measurements every 5 min after 10 min of inactivity, e.g., when there is no interaction with the node. In addition to PM mass concentrations, it also measures carbon dioxide (CO2) concentration, temperature, and relative humidity. Three AirVisual Node units were included in this study, labeled as A1, A2, and A3.
2.1.2. Instruments used for comparison
DustTrak DRX (Model 8534, TSI Inc., MN, USA) is a light-scattering laser photometer with a size detection limit of 0.1 µm, and it was used as a PM2.5 benchmark monitor throughout our evaluation. The device measures PM1, PM2.5, PM4, PM10, and total suspended particle (TSP) mass concentrations without a size-selective inlet. Although it is not a regulatory-grade monitor, it has been used in prior air quality research studies (Buonanno et al. Citation2010; Buurman et al. Citation2009; Int Panis et al. Citation2010) and indoor air investigations (Wang et al. Citation2016). Wang et al. (Citation2009) suggested that DustTrak DRX could be a useful real-time indicator of short-term variations of aerosol concentrations. The DustTrak DRX is factory-calibrated using Arizona Road Dust.
Since the DustTrak DRX is not an FEM device, and its readings can be affected by the particle type, it has to be calibrated for each aerosol particle (TSI Citation2019; Wang et al. Citation2009). Thus, for all test particles, we compared PM2.5 readings by the DustTrak DRX against a filter-based PM2.5 Personal Modular Impactor (PMI; SKC, Inc., Eighty-Four, PA, USA). Filter-based impactors have been used as reference samplers in other studies investigating low-cost PM2.5 monitors (Manibusan and Mainelis Citation2020; Sousan et al. Citation2017). The measurement procedure and the resulting adjustment equations for the DustTrak DRX are shown in the online supplementary information (SI), and the obtained side-by-side PM2.5 mass concentration data are shown in Figure S1. These equations were used to adjust all DRX measurements in the study.
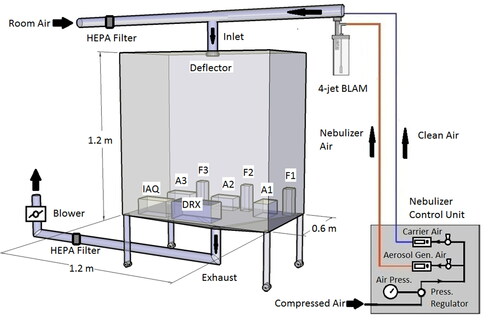
Figure 1. Experimental setup in Aerosol Exposure Chamber at CH Technologies Inc. (Westwood, NJ, USA). For illustration purposes only.
Mini-WRAS (Grimm Technologies, Inc., Minneapolis, MN, USA) is a professional-grade particle spectrometer that uses electrostatic classification to measure particles from 10 nm to 0.25 µm and then optical light scattering to measure particles ranging from 0.25 µm to 35 µm in a total of 41 size channels. We used this instrument during indoor comparison and with nanosilver sprays to gain information about the particle size distributions when testing with particles that could have a substantial ultrafine particle component.
Indoor Air Quality Meter (IAQ 7545, TSI Inc., MN, USA) was in-calibration as defined by the manufacturer, and it was used to measure CO2 concentration, temperature, and relative humidity (RH) during the experiments. It has been used to measure indoor environments in previous studies (Alves et al. Citation2016; Gouveia et al. Citation2019; Kulvinskiene et al. Citation2019; Madureira et al. Citation2015) and was considered as a reference instrument to compare these data with the measurements by Foobot and AirVisual.
2.2. Comparison under controlled conditions
We evaluated the performance of the selected low-cost monitors with different particle types under controlled conditions using an aerosol exposure chamber (AEC) (Lab Products, Inc., Aberdeen, MD, USA, available at CH Technologies, Westwood, NJ, USA) and a room-size (25 m3) Controlled Exposure Facility (CEF) (EOHSI, Rutgers University).
The AEC setup is shown in . The AEC was retrofitted with the appropriate plumbing and wiring for calibration applications. The testing was performed under ambient conditions at the outdoor test facility of CH Technologies. The AEC is constructed of 316 stainless steel sidewalls and polycarbonate door panels. It has a shape of a rectangular cuboid with a pyramid-shaped expansion space at its bottom. The cuboid's internal dimensions are 0.6 m wide x 1.2 m deep x 1.2 m high (860 L), while the total internal volume is 1000 L. The chamber was operated at a negative pressure of ∼1-inch H2O. One horizontal end of a T-connector, equipped with a HEPA filter, provided filtered dilution air for the chamber. A 4-jet Blaustein Atomizer (BLAM) was mounted to the opposite horizontal end of the T-connector, and the resulting aerosol was mixed with the dilution air and delivered into the chamber. The BLAM was operated at 5 L/min aerosolization flow. A uniform aerosol mixing was assured with a Stairmand disk positioned below the inlet (Moss and Briant Citation1983). Aerosol mixing was further enhanced with two 5-inch computer fans on opposing sides of the chamber. The aerosol was exhausted by a vacuum pump and passed through a filter before being vented to outside. Here, a variable DC supply and centrifugal blower were set to deliver a 135 L/min flow rate.
Three pairs of Foobot and AirVisual units were positioned inside the chamber, along with a DustTrak DRX. Since Foobot can report data only every 5 min, the data from all devices were converted to 5-min averages. Three types of particles were tested in this chamber: PSL spheres (Duke Scientific Corp., Palo Alto, CA, USA) with nominal diameters of 0.72 µm and 2.00 µm and ARD ISO 12103-1 A2 dust (Powder Technology Inc., Arden Hills, MN, USA). The PSL was used to evaluate the monitor performance when measuring monodisperse particles, as suggested elsewhere (Zamora et al. Citation2019). The ARD dust was used to represent mineral dust found in environmental and occupational settings (Sousan et al. Citation2017). All three particle types were aerosolized as wet slurries from Milli-Q Water (EMD Millipore, Billerica, MA, USA,USA).
The CEF at Rutgers EOHSI () is designed for exposure conditions that mimic those encountered in both environmental and occupational settings. The CEF is a ∼25 m3 stainless steel-walled chamber with controllable temperature and HEPA-filtered airflow. Its dimensions are 2.2 m high x 4.1 m wide x 2.7 m deep, representing the size of a small room. During the tests, all CEF airflows were turned off. We used this chamber to compare the monitors when measuring aerosol from a nanosilver-based surface cleaner. We chose this particle type given the proliferation of nanotechnology-based consumer products (Fröhlich and Roblegg Citation2012; Newman, Stotland, and Ellis Citation2009; Quadros and Marr Citation2011; Vance et al. Citation2015) and our experience working with such products (Calderón et al. Citation2017; Nazarenko et al. Citation2011; Nazarenko, Lioy, and Mainelis Citation2014).
Figure 2. Experimental setup in the Controlled Exposure Facility (CEF) at Rutgers Environmental and Occupational Health Sciences Institute (EOHSI).
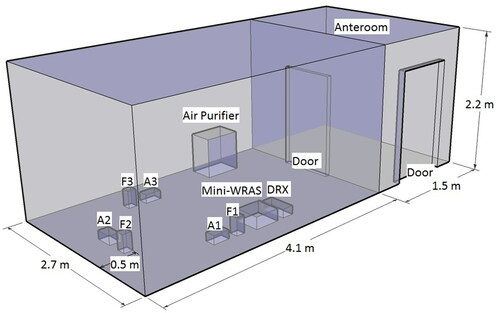
Three Foobot units, three AirVisual units, one DustTrak DRX, and one Mini-WRAS were placed side-by-side at approximately 0.5 m from the chamber walls (). Again, all data were converted to 5-min averages, and the size distributions of the sprayed particle suspension were reported by the Mini-WRAS. The background particles were removed before the experiments by an air purifier (HA202 series, Honeywell Inc., Morris Plains, NJ, USA), and the chamber was sealed during the experiment to minimize particle penetration and make sure only the sprayed particles are observed during the experiment.
The nanosilver surface cleaner was manually sprayed into the CEF air for 5 min at a frequency of about 1 spray per second by an adult wearing protective clothing (Coverall with Hood, DuPont™ Tyvek®), respirator (Model 62023HA1-C, 3 M Company, Maplewood, MN, USA), and foot covers. The experimenter then left the room, and the instruments measured particle concentration as they decayed due to particle settling for about 2 h. The experiment was conducted twice on two different days.
The temperature and humidity were relatively constant in each chamber. The temperature was 11.5 ± 0.5 °C in the AEC and 24.7 ± 1.7 °C in the CEF; the RH was 67.9 ± 5.0% in AEC and 32.1 ± 3.2% in CEF as per IAQ meter. The temperature and RH were recorded by the low-cost monitors as part of their operation, which allowed us to perform a preliminary evaluation of these instruments when measuring temperature and RH.
2.3. Comparison in the indoor environment
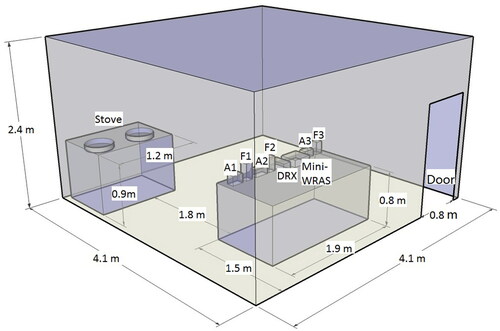
The indoor experiment was performed in a four-bedroom apartment in New Jersey, USA. Three Foobot units, three AirVisual units, one DustTrak DRX, and one Mini-WRAS were placed on a table in the kitchen during a cooking event (Chinese hot pot soup dish that involves boiling meat slices and vegetables with sauce); the monitors were approximately 1.8 m from the stove and more than 1.5 m from the wall (). The comparison lasted 85 min, and all data were reported as 5-min averages, and the size distribution of particles produced during cooking was reported by Mini-WRAS. Windows were closed, and no fans or air conditioners were used during the measurement. The temperature was 23.0 ± 2.5 °C, and the RH was 36.0 ± 2.0% in the indoor environment during the measurement.
Figure 3. Experimental setup for indoor testing of low-cost monitors during cooking.
2.4. Analysis methods
Several metrics were used to compare low-cost monitors with the DustTrak DRX. Pearson correlation coefficient (r) was used to determine the linear correlation between data provided by the DustTrak DRX and the monitors. Linear regression was performed to determine the best-fit line between the readings of the tested monitors and the DRX data and to calculate a slope coefficient and an intercept.
An agreement among the three units of each monitor type was expressed as precision error and coefficient of variation (CV). The precision error was calculated for each possible pair combination of the same monitor type (e.g., F1 vs. F2, F2 vs. F3, and F1 vs. F3) according to Equation Equation(1)(1)
(1) (Zamora et al. Citation2019); in the results, we present the average value for each instrument pair and 5-min measurements. The CV for each 5-min time stamp was calculated according to Equation Equation(2)
(2)
(2) below (Sousan et al. Citation2017; Zamora et al. Citation2019), where σ is the standard deviation, μ is the mean concentration of three units of each monitor type, and t refers to a particular timestamp. The CV was calculated for every 5-min measurement and then averaged for all timestamps using Equation Equation(3)
(3)
(3) , where n is the number of timestamps.
(2)
(2)
(3)
(3)
Additionally, a paired t-test was used to determine if the readings between the pairs of the same type of monitor were statistically significantly different. For these tests, the data were grouped for each 5-min timestamp of the entire measurement period. P-values of 0.05 or less were considered as an indication of a statistically significant difference.
3. Results
3.1. The experiment in the aerosol exposure chamber (AEC)
3.1.1. Effect of particle type on low-cost monitor measurements
The PM2.5 concentrations measured by Foobot and AirVisual units versus the PM2.5 concentrations measured by the DustTrak DRX in the AEC are shown in : (a) 0.72 µm PSL particles, (b) 2 µm PSL particles, and (c) Arizona Road Dust. When PSL particles were used ( and ), the concentrations measured by all AirVisual Nodes were all close to each other and near the 1:1 line, regardless of the size of PSL particles. However, Foobots overestimated PM2.5 concentrations for both 0.72 µm and 2 µm PSL particles. When ARD was used (), both Foobot and AirVisual had regression lines below the 1:1 fit line, i.e., they underestimated the ARD concentration, with a more pronounced underestimation by all three AirVisuals; however, the linear regression lines of the three AirVisual units were close to each other. Although Foobot and AirVisual units recorded different concentration values, they all highly correlated with the DRX-measured concentrations (r > 0.78 for Foobot, and r > 0.92 for AirVisual) (). The linear correlation between the low-cost monitors and the DustTrak DRX depended on the aerosol type and was different for different monitor units (). All three AirVisual Nodes had linear regression slope coefficients close to 1 when tested with both 0.72 µm and 2 µm PSL particles, while the Foobots showed higher slope coefficients.
Figure 4. Performance of low-cost monitors in the Aerosol Exposure Chamber when measuring different particles: (a) 0.72 μm PSL, (b) 2 μm PSL, (c) Arizona Road Dust (ARD).
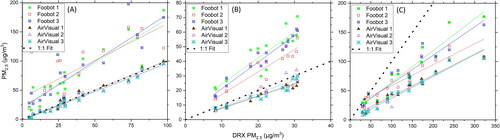
Table 2. Summary of Pearson correlation coefficients (r) and linear regression parameters (intercept value, slope coefficient, and coefficient of determination R2) for the 5 min average PM2.5 concentrations measured by Foobot and AirVisual units compared to TSI DRX, when challenged with 0.72 µm and 2 µm Polystyrene Latex (PSL) spheres and Arizona Road Dust (ARD) (measurements in Aerosol Exposure Chamber [AEC]), nano-silver spray (measurements in the Controlled Exposure Facility), and particles resulting from cooking (measurements in an indoor environment).
Based on the measurements in the AEC (), one can also observe that the data could easily be grouped by the device type. The concentrations measured by all AirVisual Nodes were close to each other regardless of particle type, and the regression lines sometimes even overlapped (e.g., A2 and A3 units when measuring 0.72 µm PSL particles). Similar to AirVisual Nodes, linear regression lines of different Foobot units were close to each other when measuring 0.72 µm PSL, with the regression lines of F1 and F2 practically overlapping, while the regression lines were more spread out when measuring 2 µm PSL particles and ARD. To investigate the agreement of different units of the same monitor type, precision error () and coefficient of variation () were calculated, and a paired t-test for each sensor pair of the same type was applied (). The precision errors ranged from 0.17 to 0.31 for the Foobots and from 0.15 to 0.24 for the AirVisual, depending on the aerosol type and monitor pair. AirVisual Node pairs had lower average values for PSL particles and ARD compared to Foobot. The CV () also varied depending on the aerosol and monitor type. The CV ranged between 16.7% and 21.0% for Foobot and between 12.5% and 17.6% for AirVisual units, with Foobots having higher CV values than AirVisuals for each tested aerosol type. Additionally, as shown in , there was no statistically significant difference between the mean 5-min concentrations measured by AirVisual pairs for all aerosol types tested in the AEC. On the other hand, statistically significant differences were observed for Foobot pairs when measuring 2 µm PSL particles. Here, the mean concentrations measured by F1 and F2, as well as by F2 and F3, were statistically significantly different.
Table 3. The precision error of paired monitor.
Table 4. The coefficient of variation, CV (%), for Foobot and AirVisual when challenged with different aerosols.
Table 5. The p-values resulting from the paired t-test of sensor pairs. *Significant difference (p ≤ 0.05).
3.1.2. Effect of particle concentration on low-cost monitor measurements
As literature shows, particle concentration could affect the performance of low-cost monitors. However, this result was not observed in this study within investigated concentration ranges of 0.72 and 2 µm PSL and ARD (). The PM2.5 concentration ranged from 4 to 98 µg/m3 for 0.72 μm PSL, from 8 to 31 µg/m3 for 2 µm PSL, and from 29 to 323 µg/m3 for ARD, according to the DRX. However, we did not observe the concentration effect on low-cost sensors' performance when different particle concentrations measured. The regression slopes seemed to be constant for both high and low concentration ranges for both monitors. Even if there was a concentration effect on monitor performance, it was obscured by data scatter from individual monitor units.
3.2. Measurement of nanosilver spray by the low-cost monitors in CEF
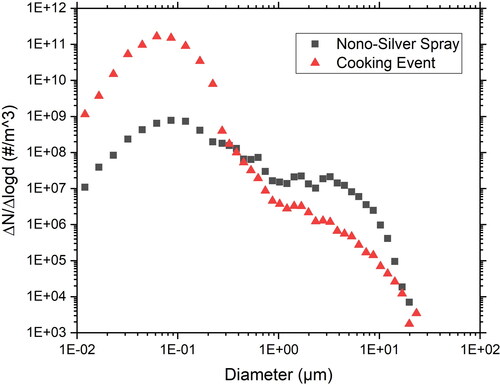
The size distribution of particles produced by the nanosilver spray and measured in the CEF is shown in . The size distribution measured by the Mini-WRAS is an average of 15 min measurement right after completing the spraying. The measured normalized particle number concentration was as high as 109/m3 at approximately 100 nm; the normalized number concentration decreased to 5 × 10⁷/m3 at approximately 2.5 µm. This particular spray has been characterized in our earlier research as Product S13 (Calderón et al. Citation2017): smaller particles are typically individual nanoparticles, while the larger particles are typically particle agglomerates containing the primary particles as well as various elements from the product matrix.
Figure 5. The size distribution of particles produced by nano-silver spray and a cooking event as measured by Grimm Aerosol Mini WRAS 1371 (Grimm Technologies Inc, Douglasville, GA, USA).
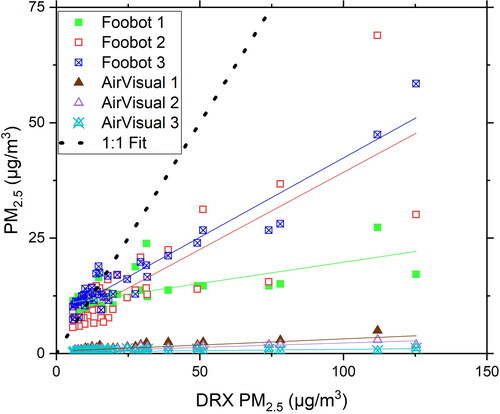
The PM2.5 concentrations of the nanosilver spray measured by Foobot and AirVisual units versus the concentration measured by DRX are shown in . The PM2.5 concentration ranged from ∼5 to 126 µg/m3 according to the DRX, but most data points were concentrations <50 µg/m3. The Foobots showed much higher readings than the AirVisuals, but still underestimated PM2.5 concentrations. In fact, the concentrations measured by the AirVisuals were close to zero over the entire concentration range, and their slope coefficients were less than 0.03. The slope coefficient for the Foobots was a rather moderate 0.33. As shown in , the concentrations measured by the Foobots and the AirVisuals were still correlated with the DRX concentrations (r = 0.68 ∼ 0.96 for the Foobots and r = 0.55 ∼ 0.84 for the AirVisuals), but the coefficient of determination varied substantially depending on individual units. The lowest R2 for a Foobot was 0.46 and 0.30 for an AirVisual, while the highest R2 for a Foobot was 0.91 and 0.71 for an AirVisual. Both device types exhibited relatively high precision errors: from 0.20 to 0.31 for the Foobots and from 0.29 to 0.47 for the AirVisuals (). The CV of 28.7% for the AirVisuals was higher than that for the Foobots (19.0%) (). Statistically significant differences were observed for the concentrations measured by all pairs of the AirVisuals and between F2 and F3 Foobots ().
Figure 6. PM2.5 concentrations measured in the Control Exposure Facility after spraying a nanosilver product.
3.3. Particle measurement indoors
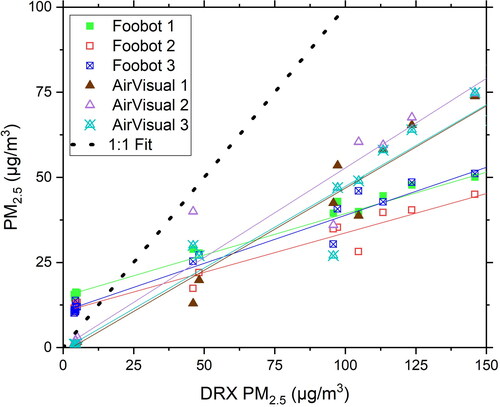
The indoor experiment was performed during a cooking event, and the number concentration and size distribution of particles created during cooking were measured by Mini-WRAS (). The presented size distribution reflects the particle concentration averaged over 10-min when the total particle concentration reached a peak; here, the normalized particle number concentration reached 1011/m3 for 100 nm particles, and the normalized number concentration at 2.5 µm was ∼106/m3. The measurement results of PM2.5 concentration during cooking, as observed by the low-cost monitors and DRX, are shown in . Both the Foobots and AirVisuals underestimated PM2.5 concentrations for the entire concentration range. The regression lines of Foobots and AirVisuals crossed each other at approximately 50 µg/m3: Foobots had higher readings than AirVisuals when the concentration was lower than 50 µg/m3, but they had lower readings than AirVisuals when the concentration was higher than 50 µg/m3. At the same time, according to the data in , the Foobots and AirVisuals were highly correlated with the DRX data (r > 0.98). The precision errors between the Foobots were lower than that between the AirVisuals: from 0.16 to 0.23 for the Foobots and from 0.30 to 0.36 for the AirVisuals (). The CV of the Foobots (15.2%) was lower than that for the AirVisuals (24.0%) (). The results of the paired t-test showed that there were statistically significant differences in concentrations measured by each pair of the Foobots and one pair of AirVisuals (A2 and A3) ().
Figure 7. PM2.5 levels measured in the indoor environment during cooking.
3.4. Measurement of temperature, relative humidity, and carbon dioxide concentration
Although temperature, RH, and CO2 concentrations did not vary substantially during our experiments, all these parameters were measured and recorded, allowing us to compare the data obtained by Foobot and AirVisual units with the IAQ Meter measurements. Pearson correlation coefficient (r), linear regression, precision error, and coefficient of variation were calculated, and all these data are provided in the SI (Tables S1 to S5, Figures S2 to S4).
The temperature during the AEC experiments was in a narrow range from 50.5 °F to ∼54.5 °F, and the readings from low-cost monitors are shown in Figure S2. The regression lines of all monitors are nearly parallel; data from F2 is practically on the 1:1 line, while A1 and A3 overestimated and F1, F3, and A2 units underestimated the temperature. As summarized in Table S1, temperature readings from all low-cost monitors had a nearly perfect correlation with the IAQ Meter readings (r > 0.99). The low precision error (less than 0.12) and low CVs (3.65% for the Foobots and 4.66% for the AirVisuals) showed high precision for both monitors when measuring temperature (Table S4 and S5).
Figure S3 shows the observed RH values, and it ranged from 58% to 75%. The low-cost monitors either overestimated or underestimated the RH, but they all showed a good correlation with the IAQ Meter: r > 0.70. As shown in Table S2, the linearity between monitors varied. F1 and A3 showed the weakest linearity among each device type with R2 = 0.49 for F1 and R2 = 0.74 for A3. The precision error of less than 0.12 for both devices and the CVs of 6.36% for the Foobots and 7.27% for AirVisual indicated good precision for the low-cost monitors (Table S4 and S5).
CO2 was also measured during our experiments, and the data are shown in Figure S4. According to the IAQ Meter, the concentration ranged from 475 to 900 ppm, but all concentrations were under 650 ppm except 2 measurements. Figure S4A shows all CO2 data measured in the AEC, and Figure S4B shows only CO2 concentration under 650 ppm. The AirVisuals showed a nearly perfect correlation with the IAQ Meter (r > 0.98) in both cases, while the Foobots showed a weak correlation (r from −0.21 to 0.56) with the IAQ meter. The linearity is summarized in Table S3. As could be seen, the AirVisuals had slope coefficients close to 1 for both CO2 concentration ranges; the Foobots showed a poor linear relationship with IAQ Meter regardless of the CO2 concentration (R2 < 0.31). Additionally, AirVisuals had precision errors of less than 0.12 and a CV of approximately 4% for both concentration ranges (Table S4 and S5). Although Foobots had poor linearity with IAQ Meter, they had a precision error of less than 0.12 and a CV of approximately 6% regardless of the CO2 concentration range (Table S4 and S5).
4. Discussion
The goal of the study was to investigate the ability of two low-cost monitor types to measure PM2.5 concentrations of different particles relative to a professional-grade particle monitor. As an additional monitor performance component, we also compared temperature, RH, and CO2 value measured by the low-cost monitors and a reference instrument.
Even though temperature and relative humidity were not controlled during the experiments, they were relatively steady at each measurement site. Typically, the temperature has a negligible effect on optical particle monitors (Wang et al. Citation2015), while high relative humidity can result in overestimation of PM2.5 concentrations by light scattering instruments (Crilley et al. Citation2018; Di Antonio et al. Citation2018; Jayaratne et al. Citation2018). The main reason for this effect is the hygroscopic or deliquescent growth of particles resulting in stronger light scattering (Jayaratne et al. Citation2018; Wang et al. Citation2015; Zamora et al. Citation2019). The effect of RH on different DustTrak DRX models was tested by multiple studies: DustTrak DRX model 8532 (TSI Inc.) overestimated PM10 concentrations by a factor of 2.37 compared to standard tapered element oscillating microbalance (TEOM) when RH > 95% (Chang et al. Citation2018); DustTrak II 8530 (TSI Inc.) agreed closely with the TEOM until the relative humidity exceeded about 75% (Jayaratne et al. Citation2018). We could not find studies on the effect of RH on the DustTrak DRX model 8534 but based on studies with other DustTrak models, we assumed a relatively low effect of RH since it was <70%. However, this effect does not affect the low-cost monitors to the same degree. Some low-cost monitors showed a significant decrease in accuracy when RH was higher than 50%, while some were affected only at RH higher than 75%, and the accuracy decreased with increasing RH (Jayaratne et al. Citation2018; Wang et al. Citation2015; Zamora et al. Citation2019). In this study, the RH was 67.9 ± 5.0% in AEC, 32.1 ± 3.2% in CEF, and 36.0 ± 2.0% in the indoor environment. Thus, RH should have had a negligible effect on monitor performance in the CEF and the indoor environment. However, relatively high RH levels in AEC could have led to higher PM2.5 readings measured by the low-cost monitors compared to their performance in lower RH environments.
Feenstra et al. (Citation2019) observed that when measuring ambient PM2.5, AirVisual was minimally impacted by the RH until it reached 80%, while Foobot was strongly affected starting at 50% RH, and the bias by Foobot increased as the RH increased. These observations suggest that RH tends to have a larger effect on Foobot compared to the AirVisual. Additionally, Zamora, Rice, and Koehler (Citation2020) indicated that AirVisual didn't exhibit strong RH dependency when measuring residential air quality at RH ranging from 20% to 80%. The results from our study seem to confirm observations by the cited studies. When the RH was high (in AEC), the Foobot showed much higher readings than the AirVisual Nodes due to a strong RH effect; however, when the RH was relatively low (in the indoor environment), Foobot and AirVisual showed closer readings. However, one has to keep in mind that the particle types in the two environments were different and that likely played a role well. Since studies showed that relative humidity exceeding 50% could be readily encountered in residential environments (Oreszczyn et al. 2006; Patton et al. Citation2016), higher humidity levels could be a challenge for low-cost monitors.
The differences in monitor performance depending on particle type can be explained by particle size and shape, absorption and scattering of light, and differences in the refractive index of the particles (Hinds Citation1999). Thus, low-cost monitors should be calibrated using particles with known characteristics.
On the other hand, the application of low-cost monitors and sensors to measure emerging contaminants, such as particles from nano sprays, could be more challenging. In our experiments, AirVisuals underestimated PM2.5 concentration of nanosilver sprays to a higher degree, with its readings being close to zero; the Foobot fared somewhat better. We acknowledge that neither low-cost monitor was designed to measure nanosized particles and that the detection limit of sensors is a likely reason for their low measurements. While the DustTrak DRX starts sensing particles at 0.1 µm, both AirVisual and Foobot have a lower detection limit of 0.3 µm; thus, it was reasonable to expect that the low-cost monitors will have lower readings compared to DRX. However, the readings were not expected to as low as we observed since there was still a sufficiently high concentration of particles that should have been detected by all low-cost monitors (). Based on the data measured by Mini-WRAS, the mass median diameter for the nanosilver spray was 5.8 µm, and the mass concentration of particles >0.3 µm was only 0.12% lower than particle mass concentration >0.1 µm.
The low concentration measured by the Foobots and the AirVisuals might have been due to particular light scattering properties of the produced particles and how those particles are delivered to sensors of the two devices. Chakrabarti et al. (Citation2004) found that optical sensors' response to smaller particles within PM2.5 tends to be weaker with decreasing particle size. Thus, both the Foobot and AirVisual could have underestimated smaller particles, of which there were substantial quantities (Figure S2). Particle refractive index could also have played a role (Hinds Citation1999). The organic compounds in the nanosilver spray might have absorbed some of the light, thus reducing the amount of light scattered (Wang et al. Citation2015). In addition, the AirVisual uses an active airflow to deliver the air stream to its sensor, while the Foobot relies on particle diffusion. Thus, the active airflow of the AirVisual helped remove the volatile components on the produced spray, which resulted in more particles below its detection limit, while the passive diffusion in Foobot did not have that effect and Foobot measured larger particles. Differences in scattered light wavelengths and detection angles also affect the performance of light scattering sensors (Hinds Citation1999), and likely contributed to the difference between the two devices.
Given the proliferation of nanotechnology-based consumer products and the potential to aerosolize particles from such products, consumers might be tempted to utilize low-cost monitors to measure their exposures due to the use of various consumer products. At the same time, our data showed that low-cost monitors' performance should be thoroughly investigated before they are used; otherwise, their application might lead to a false-negative determination of exposures. Thus, further work is needed to determine why the low-cost monitors substantially underestimated the concentration of nanosilver particles, including the investigation of nanosilver particle refractive index, their light absorbance, or other particle properties.
We compared our observed monitor performance with other studies. The performance of AirVisual Node and Foobot when measuring particles produced during cooking agreed with observations from Singer and Delp (Citation2018), who indicated that both AirVisual and Foobot data correlated well with the Grimm OPC (Model 1.371) when measuring most of the cooking activities involving frying or heating oil. Additionally, our observed Foobot performance was similar to that reported by Sousan et al. (Citation2017), where Foobot had a strong correlation with a reference Scanning Mobility Particle Sizer (SMPS) and Aerodynamic Particle Sizer (APS) (both by TSI, Inc., Shoreview, MN, USA), but had a relatively high intercept of 17 ± 9.1 µg/m3 when measuring the ARD. Both their data and our data showed that Foobot underestimated concentrations for ARD. Although the results from our study and Sousan et al. (Citation2017) look similar, there are differences. When measuring Arizona Road Dust, Sousan et al. (Citation2017) found that Foobot had a slope coefficient of 0.7 while the slope coefficients observed in our study were lower and varied between 0.39 to 0.59; the CV of Foobot in their study was 8.0% while in our study it was 19.2%. These differences could be due to (1) differences in test aerosol distribution because different aerosolization methods were used: we used a 4-jet BLAM, and Sousan et al. used a fluidized bed aerosol generator (3400 A, TSI Inc., Shoreview, MN, USA); and (2) different instruments used for reference, where we used a filter-calibrated DustTrak DRX and Sousan et al. (Citation2017) used a filter-calibrated SMPS and APS.
Particle concentration did not appear to be a factor affecting monitors' performance, at least not within the investigated concentration ranges and observed data scatter. Future studies should investigate the performance of these low-cost monitors in a wider range of concentrations.
Besides PM2.5 concentrations, temperature, relative humidity, and CO2 were also measured. Even though the observed temperature and humidity ranges were narrow, both Foobot and AirVisual showed high accuracy compared with the IAQ Meter and showed high precision within the same monitor type. When it comes to CO2 measurements, Foobot didn't produce accurate CO2 concentrations, while AirVisual data showed a strong linear relationship with the CO2 data measured by the IAQ Meter. The difference in performance is most likely due to different techniques used by AirVisual and Foobot to measure CO2 concentrations. AirVisual measures CO2 concentrations directly using a CO2 sensor composed of an infrared source, a reflective gas cell, and infrared-filtered detectors (AirVisual Citation2016). On the other hand, Foobot does not have an actual CO2 sensor, but instead, it calculates and reports a CO2-equivalent concentration using its total volatile organic compounds (TVOC) sensor (Foobot Citation2017). The lack of an actual CO2 sensor explains why Foobot had low accuracy when providing CO2 values. Similar results were observed by Moreno-Rangel et al. (Citation2018), where Foobot showed a weak correlation (R2 = 0.180) with a GrayWolf IQ-410 sensor (GrayWolf Sensing Solutions, LLC., Shelton, CT, USA) when measuring CO2 concentration in residential environments.
In addition to measuring PM2.5 concentration and environmental parameters, we also considered the convenience of operating both devices. AirVisual shows its readings on the screen and can run on a battery and store data without Wi-Fi. Its data can be easily accessed via Wi-Fi through the AirVisual website (e.g., 1-hour averaged data or 1-min averaged data) or directly downloaded from the instrument (e.g., data for every 10 s). On the other hand, Foobot doesn't have internal data storage and can record data only when connected to Wi-Fi. The data measured by Foobot can be downloaded via Wi-Fi from the company's website, which only provides data averaged over 5 min. AirVisual can also display readings from the nearest outdoor monitoring station, thus giving the ability to compare conditions indoors and outdoors in terms of PM2.5 concentrations and the Air Quality Index (AirNow Citation2016).
5. Conclusions
Both investigated low-cost monitors - Foobot and AirVisual - showed good linearity with the DustTrak DRX when measuring most test aerosol particles, except when measuring the nanosilver spray with a high presence of ultrafine particles. In general, the PM2.5 concentrations measured by the Foobots were higher than the AirVisual measurements. As far as environmental parameters, both monitors showed strong linearity with the IAQ Meter when measuring temperature and relative humidity, although they were investigated in a narrow range of values. However, Foobot didn't produce accurate CO2 readings, while AirVisual showed strong linearity with the IAQ Meter when measuring CO2. Additionally, AirVisual showed better precision than Foobot for most of the measurements. At the same time, we found that AirVisual was easier to operate, and it provided more options on how to download the data, including data with shorter averaging.
It was obvious that both monitors struggled with aerosols that had a substantial ultrafine particle component. Given the negative health effects caused by ultrafine aerosols and their presence in indoor environments due to various combustion sources, such as smoking, candles, or incense (Thomas et al. Citation2019), as well as the proliferation of nanotechnology-based consumer products (Calderón et al. Citation2017; Fröhlich and Roblegg Citation2012; Nazarenko et al. Citation2011; Nazarenko, Lioy, and Mainelis Citation2014; Newman, Stotland, and Ellis Citation2009; Quadros and Marr Citation2011; Vance et al. Citation2015) and home and office use of 3 D printers that are known to release ultrafine particles (Steinle Citation2016; Stephens et al. Citation2013; Yi et al. Citation2016), it would be worthwhile to investigate thoroughly low-cost monitor performance when measuring various ultrafine particles.
Given the positive and challenging aspects of both investigated low-cost monitors, their selection for a particular project should depend on the projects' objectives, measured particle types, and the protocol for instrument handling and data download. If possible, monitors should be calibrated with particular aerosol types and in particular environments.
Supplemental Material
Download MS Word (1.2 MB)Disclosure statement
The authors declare that they have no conflict of interest.
Additional information
Funding
References
- AirNow 2016. Air Quality Index (AQI) Basics. Last Modified August 31, 2016. Accessed March 26, 2019. https://airnow.gov/index.cfm?action=aqibasics.aqi.
- AirVisual 2016. How do the PM2.5 sensor and CO2 sensor work? Accessed March 26, 2019. http://support.airvisual.com/knowledgebase/articles/1136839-how-do-the-pm2-5-sensor-and-co2-sensor-work.
- Alves, C., M. Duarte, M. Ferreira, A. Alves, A. Almeida, and Â. Cunha. 2016. Air quality in a school with dampness and mould problems. Air Quality Atmos Health 9:107–15.
- Antonini, J. M. 2003. Health effects of welding. Crit. Rev. Toxicol. 33 (1):61–103. doi:https://doi.org/10.1080/713611032.
- AQ-SPEC. 2017. PM sensor evaluations: evaluation of IQAir AirVisual Pro sensors. Last Modified 2017. Accessed March 5, 2019. http://www.aqmd.gov/docs/default-source/aq-spec/summary/iqair-airvisual-pro—summary-report.pdf?sfvrsn = 12.
- AQ-SPEC 2019. Air quality sensor performance evaluation center. Last Modified March 12, 2019. Accessed March 26, 2019. http://www.aqmd.gov/aq-spec.
- Balmes, J. R., J. M. Fine, and D. Sheppard. 1987. Symptomatic bronchoconstriction after short-term inhalation of sulfur dioxide1, 2. Am. Rev. Respir. Dis. 136 (5):1117–21. doi:https://doi.org/10.1164/ajrccm/136.5.1117.
- Buonanno, G., L. Morawska, L. Stabile, and A. Viola. 2010. Exposure to particle number, surface area and PM concentrations in pizzerias. Atmos. Environ. 44 (32):3963–9. doi:https://doi.org/10.1016/j.atmosenv.2010.07.002.
- Buurman, M., K. Henneböhl, H. Fritze, C. Malewski, E. J. Pebesma, and L. E. Gerharz. 2009. Spatial and temporal variation of PM10 concentrations at the street level: a case study for the city of Münster. Proceedings of the conference of Geoinformatik 2009—Benefits for environment & society, 187–193, Osnabruck, Germany, March 31–April 1 2009.
- Calderón, L., T. T. Han, C. M. McGilvery, L. Yang, P. Subramaniam, K.-B. Lee, S. Schwander, T. D. Tetley, P. G. Georgopoulos, M. Ryan, et al. 2017. Release of airborne particles and Ag and Zn compounds from nanotechnology-enabled consumer sprays: Implications for inhalation exposure. Atmos. Environ. 155:85–96. doi:https://doi.org/10.1016/j.atmosenv.2017.02.016.
- Chakrabarti, B., P. M. Fine, R. Delfino, and C. Sioutas. 2004. Performance evaluation of the active-flow personal DataRAM PM2.5 mass monitor (Thermo Anderson pDR-1200) designed for continuous personal exposure measurements. Atmos. Environ. 38 (20):3329–40. doi:https://doi.org/10.1016/j.atmosenv.2004.03.007.
- Chang, L. T.-C., J. Leys, S. Heidenreich, and T. Koen. 2018. Determining aerosol type using a multichannel DustTrak DRX. J. Aerosol Sci. 126:68–84. doi:https://doi.org/10.1016/j.jaerosci.2018.08.009.
- Crilley, L. R., M. Shaw, R. Pound, L. J. Kramer, R. Price, S. Young, A. C. Lewis, and F. D. Pope. 2018. Evaluation of a low-cost optical particle counter (Alphasense OPC-N2) for ambient air monitoring. Atmos. Meas. Tech. 11 (2):709–20. doi:https://doi.org/10.5194/amt-11-709-2018.
- Di Antonio, A.,. O. A. M. Popoola, B. Ouyang, J. Saffell, and R. L. Jones. 2018. Developing a Relative Humidity Correction for Low-Cost Sensors Measuring Ambient Particulate Matter. Sensors 18 (9):2790. doi:https://doi.org/10.3390/s18092790.
- Dominici, F., R. D. Peng, M. L. Bell, L. Pham, A. McDermott, S. L. Zeger, and J. M. Samet. 2006. Fine Particulate Air Pollution and Hospital Admission for Cardiovascular and Respiratory Diseases. JAMA 295 (10):1127–34. doi:https://doi.org/10.1001/jama.295.10.1127.
- Feenstra, B., V. Papapostolou, S. Hasheminassab, H. Zhang, B. D. Boghossian, D. Cocker, and A. Polidori. 2019. Performance evaluation of twelve low-cost PM2.5 sensors at an ambient air monitoring site. Atmos. Environ. 216:116946. doi:https://doi.org/10.1016/j.atmosenv.2019.116946.
- Foobot. 2017. CO2 - eq vs CO2 explained - Why we chose CO2 - eq. https://help.foobot.io/hc/en-us/articles/115001483184-CO2-eq-vs-CO2-explained-Why-we-chose-CO2-eq.
- Fröhlich, E., and E. Roblegg. 2012. Models for oral uptake of nanoparticles in consumer products. Toxicology 291 (1-3):10–7. doi:https://doi.org/10.1016/j.tox.2011.11.004.
- Gao, M., J. Cao, and E. Seto. 2015. A distributed network of low-cost continuous reading sensors to measure spatiotemporal variations of PM2.5 in Xi'an, China. Environ. Pollut. 199:56–65. doi:https://doi.org/10.1016/j.envpol.2015.01.013.
- Gouveia, P., F. Felgueiras, Z. Mourão, E. D. O. Fernandes, A. Moreira, and M. F. Gabriel. 2019. Predicting health risk from exposure to trihalomethanes in an Olympic-size indoor swimming pool among elite swimmers and coaches. J. Toxicol. Environ. Health Part A 82 (9):577–90. doi:https://doi.org/10.1080/15287394.2019.1634383.
- Hinds, W. C. 1999. Aerosol Technology: Properties, Behavior, and Measurement of Airborne Particles.
- Holstius, D. M., A. Pillarisetti, K. R. Smith, and E. Seto. 2014. Field calibrations of a low-cost aerosol sensor at a regulatory monitoring site in California. Atmos. Meas. Tech. 7 (4):1121–31. doi:https://doi.org/10.5194/amt-7-1121-2014.
- Int Panis, L., B. de Geus, G. Vandenbulcke, H. Willems, B. Degraeuwe, N. Bleux, V. Mishra, I. Thomas, and R. Meeusen. 2010. Exposure to particulate matter in traffic: A comparison of cyclists and car passengers. Atmos. Environ. 44 (19):2263–70. doi:https://doi.org/10.1016/j.atmosenv.2010.04.028.
- Jayaratne, R., X. Liu, P. Thai, M. Dunbabin, and L. Morawska. 2018. The influence of humidity on the performance of a low-cost air particle mass sensor and the effect of atmospheric fog. Atmos. Meas. Tech. 11 (8):4883–90. doi:https://doi.org/10.5194/amt-11-4883-2018.
- Jiao, W., G. Hagler, R. Williams, R. Sharpe, R. Brown, D. Garver, R. Judge, M. Caudill, J. Rickard, M. Davis, et al. 2016. Community Air Sensor Network (CAIRSENSE) project: Evaluation of low-cost sensor performance in a suburban environment in the southeastern United States.
- Kampa, M., and E. Castanas. 2008. Human health effects of air pollution. Environ. Pollut. 151 (2):362–7. doi:https://doi.org/10.1016/j.envpol.2007.06.012.
- Karagulian, F., M. Barbiere, A. Kotsev, L. Spinelle, M. Gerboles, F. Lagler, N. Redon, S. Crunaire, and A. Borowiak. 2019. Review of the Performance of Low-Cost Sensors for. Air Quality Monitoring. Atmosphere 10 (9):506. doi:https://doi.org/10.3390/atmos10090506.
- Koenig, J. Q., T. F. Mar, R. W. Allen, K. Jansen, T. Lumley, J. H. Sullivan, C. A. Trenga, T. Larson, and L. J. S. Liu. 2005. Pulmonary effects of indoor- and outdoor-generated particles in children with asthma. Environ. Health Perspect. 113 (4):499–503. doi:https://doi.org/10.1289/ehp.7511.
- Kulvinskiene, I., J. Raudoniute, E. Bagdonas, D. Ciuzas, K. Poliakovaite, I. Stasiulaitiene, D. Zabulyte, D. Bironaite, P. Rimantas Venskutonis, D. Martuzevicius, et al. 2019. Lung alveolar tissue destruction and protein citrullination in diesel exhaust-exposed mouse lungs. Basic Clin Pharmacol Toxicol 125 (2):166–77. doi:https://doi.org/10.1111/bcpt.13213.
- Li, H., M. Hedmer, M. Kåredal, J. Björk, L. Stockfelt, H. Tinnerberg, M. Albin, and K. Broberg. 2015. A Cross-Sectional Study of the Cardiovascular Effects of Welding Fumes.
- Liao, D., J. Creason, C. Shy, R. Williams, R. Watts, and R. Zweidinger. 1999. Daily variation of particulate air pollution and poor cardiac autonomic control in the elderly. Environ Health Perspect 107 (7):521–5. doi:https://doi.org/10.1289/ehp.99107521.
- Madureira, J., I. Paciência, J. C. Rufo, C. Pereira, J. P. Teixeira, and E. de Oliveira Fernandes. 2015. Assessment and determinants of airborne bacterial and fungal concentrations in different indoor environments: Homes, child day-care centres, primary schools and elderly care centres. Atmos. Environ. 109:139–46. doi:https://doi.org/10.1016/j.atmosenv.2015.03.026.
- Manibusan, S., and G. Mainelis. 2020. Performance of four consumer-grade air pollution measurement devices in different residences. Aerosol Air Qual Res 20 (2):217–30. doi:https://doi.org/10.4209/aaqr.2019.01.0045.
- Manikonda, A., N. Zíková, P. K. Hopke, and A. R. Ferro. 2016. Laboratory assessment of low-cost PM monitors. J. Aerosol Sci. 102:29–40. doi:https://doi.org/10.1016/j.jaerosci.2016.08.010.
- Moreno-Rangel, A., T. Sharpe, F. Musau, and G. McGill. 2018. Field evaluation of a low-cost indoor air quality monitor to quantify exposure to pollutants in residential environments. J. Sens. Sens. Syst. 7 (1):373–88. doi:https://doi.org/10.5194/jsss-7-373-2018.
- Moss, O. R., and J. K. Briant. 1983. Exposure chamber, Google Patents.
- Nazarenko, Y., T. W. Han, P. J. Lioy, and G. Mainelis. 2011. Potential for exposure to engineered nanoparticles from nanotechnology-based consumer spray products. J. Expo. Sci. Environ. Epidemiol. 21 (5):515–28. doi:https://doi.org/10.1038/jes.2011.10.
- Nazarenko, Y., P. J. Lioy, and G. Mainelis. 2014. Quantitative assessment of inhalation exposure and deposited dose of aerosol from nanotechnology-based consumer sprays. Environ. Sci: Nano 1 (2):161–71. doi:https://doi.org/10.1039/c3en00053b.
- Newman, M. D., M. Stotland, and J. I. Ellis. 2009. The safety of nanosized particles in titanium dioxide- and zinc oxide-based sunscreens. J. Am. Acad. Dermatol. 61 (4):685–92. doi:https://doi.org/10.1016/j.jaad.2009.02.051.
- Oreszczyn, T., I. Ridley, S. H. Hong, P. Wilkinson, and W. F. S. Group. 2006. Mould and winter indoor relative humidity in low income households in England. Indoor Built Environ. 15 (2):125–35. doi:https://doi.org/10.1177/1420326X06063051.
- Papapostolou, V., H. Zhang, B. J. Feenstra, and A. Polidori. 2017. Development of an environmental chamber for evaluating the performance of low-cost air quality sensors under controlled conditions. Atmos. Environ. 171:82–90. doi:https://doi.org/10.1016/j.atmosenv.2017.10.003.
- Patel, S., J. Li, A. Pandey, S. Pervez, R. K. Chakrabarty, and P. Biswas. 2017. Spatio-temporal measurement of indoor particulate matter concentrations using a wireless network of low-cost sensors in households using solid fuels. Environ. Res. 152:59–65. doi:https://doi.org/10.1016/j.envres.2016.10.001.
- Patton, A. P., L. Calderon, Y. Xiong, Z. Wang, J. Senick, M. Sorensen Allacci, D. Plotnik, R. Wener, C. J. Andrews, U. Krogmann, et al. 2016. Airborne particulate matter in two multi-family green buildings: concentrations and effect of ventilation and occupant behavior. IJERPH 13 (1):144. doi:https://doi.org/10.3390/ijerph13010144.
- Pinkerton, K. E., F. H. Green, C. Saiki, V. Vallyathan, C. G. Plopper, V. Gopal, D. Hung, E. B. Bahne, S. S. Lin, M. G. Ménache, et al. 2000. Distribution of particulate matter and tissue remodeling in the human lung. Environ Health Perspect 108 (11):1063–9. doi:https://doi.org/10.1289/ehp.001081063.
- Polichetti, G., S. Cocco, A. Spinali, V. Trimarco, and A. Nunziata. 2009. Effects of particulate matter (PM10, PM2.5 and PM1) on the cardiovascular system. Toxicology 261 (1-2):1–8. doi:https://doi.org/10.1016/j.tox.2009.04.035.
- Polidori, A., V. Papapostolou, B. Feenstra, and H. Zhang. 2017. Field Evaluation of Low-Cost Air Quality Sensors.
- Polidori, A., V. Papapostolou, and H. Zhang. 2016. Laboratory evaluation of low-cost air quality sensors. Diamond Bar, CA: South Coast Air Quality Management District.
- Pope, C. A., and D. W. Dockery. 2006. Health Effects of Fine Particulate Air Pollution: Lines that Connect. J Air Waste Manag Assoc 56 (6):709–42. doi:https://doi.org/10.1080/10473289.2006.10464485.
- Quadros, M. E., and L. C. Marr. 2011. Silver nanoparticles and total aerosols emitted by nanotechnology-related consumer spray products. Environ. Sci. Technol. 45 (24):10713–9. doi:https://doi.org/10.1021/es202770m.
- Seaton, A., D. Godden, W. MacNee, and K. Donaldson. 1995. Particulate air pollution and acute health effects. The Lancet 345 (8943):176–8. doi:https://doi.org/10.1016/S0140-6736(95)90173-6.
- Singer, B. C., and W. W. Delp. 2018. Response of consumer and research grade indoor air quality monitors to residential sources of fine particles. Indoor Air. 28 (4):624–39. doi:https://doi.org/10.1111/ina.12463.
- Sousan, S.,. K. Koehler, L. Hallett, and T. M. Peters. 2017. Evaluation of consumer monitors to measure particulate matter. J. Aerosol Sci. 107:123–33. doi:https://doi.org/10.1016/j.jaerosci.2017.02.013.
- Steinle, P. 2016. Characterization of emissions from a desktop 3D printer and indoor air measurements in office settings. J. Occup. Environ. Hyg. 13 (2):121–32. doi:https://doi.org/10.1080/15459624.2015.1091957.
- Stephens, B., P. Azimi, Z. El Orch, and T. Ramos. 2013. Ultrafine particle emissions from desktop 3D printers. Atmos. Environ. 79:334–9. doi:https://doi.org/10.1016/j.atmosenv.2013.06.050.
- Taylor, M., and I. Nourbakhsh. 2015. A low-cost particle counter and signal processing method for indoor air pollution. Air Pollution XXIII 198:337. doi:https://doi.org/10.2495/AIR150291.
- Tecer, L. H., O. Alagha, F. Karaca, G. Tuncel, and N. Eldes. 2008. Particulate matter (PM2.5, PM10-2.5, and PM10) and children's hospital admissions for asthma and respiratory diseases: a bidirectional case-crossover study. J. Toxicol. Environ. Health Part A 71 (8):512–20. doi:https://doi.org/10.1080/15287390801907459.
- Thomas, N. M., L. Calderón, J. Senick, M. Sorensen-Allacci, D. Plotnik, M. Guo, Y. Yu, J. Gong, C. J. Andrews, and G. Mainelis. 2019. Investigation of indoor air quality determinants in a field study using three different data streams. Build. Environ. 154:281–95. doi:https://doi.org/10.1016/j.buildenv.2019.03.022.
- TSI 2019. Aerosol Monitor Model 8533/8534/8533EP Operation and Service Manual.
- Tsoulou, I., C. J. Andrews, R. He, G. Mainelis, and J. Senick. 2020. Summertime thermal conditions and senior resident behaviors in public housing: A case study in Elizabeth, NJ, USA. Build. Environ. 168:106411. doi:https://doi.org/10.1016/j.buildenv.2019.106411.
- U.S. EPA. 2018. Particulate Matter (PM2.5) Trends.
- Vance, M. E., T. Kuiken, E. P. Vejerano, S. P. McGinnis, M. F. Hochella, Jr., D. Rejeski, and M. S. Hull. 2015. Nanotechnology in the real world: Redeveloping the nanomaterial consumer products inventory. Beilstein J Nanotechnol 6:1769–80. doi:https://doi.org/10.3762/bjnano.6.181.
- Wang, Z., L. Calderón, A. P. Patton, M. Sorensen Allacci, J. Senick, R. Wener, C. J. Andrews, and G. Mainelis. 2016. Comparison of real-time instruments and gravimetric method when measuring particulate matter in a residential building. J Air Waste Manag Assoc 66 (11):1109–20. doi:https://doi.org/10.1080/10962247.2016.1201022.
- Wang, X., G. Chancellor, J. Evenstad, J. E. Farnsworth, A. Hase, G. M. Olson, A. Sreenath, and J. K. Agarwal. 2009. A Novel Optical Instrument for Estimating Size Segregated Aerosol Mass Concentration in Real Time. Aerosol Sci. Technol. 43 (9):939–50. doi:https://doi.org/10.1080/02786820903045141.
- Wang, Y., J. Li, H. Jing, Q. Zhang, J. Jiang, and P. Biswas. 2015. Laboratory evaluation and calibration of three low-cost particle sensors for particulate matter measurement. Aerosol Sci. Technol. 49 (11):1063–77. doi:https://doi.org/10.1080/02786826.2015.1100710.
- Williams, R., R. Duvall, V. Kilaru, G. Hagler, L. Hassinger, K. Benedict, J. Rice, A. Kaufman, R. Judge, G. Pierce, et al. 2019. Deliberating performance targets workshop: Potential paths for emerging PM2.5 and O3 air sensor progress. Atmos. Environ. X 2:100031. doi:https://doi.org/10.1016/j.aeaoa.2019.100031.
- Yi, J., R. F. LeBouf, M. G. Duling, T. Nurkiewicz, B. T. Chen, D. Schwegler-Berry, M. A. Virji, and A. B. Stefaniak. 2016. Emission of particulate matter from a desktop three-dimensional (3D) printer. J. Toxicol. Environ. Health Part A 79 (11):453–65. doi:https://doi.org/10.1080/15287394.2016.1166467.
- Zamora, M. L., J. Rice, and K. Koehler. 2020. One year evaluation of three low-cost PM2.5 monitors. Atmos. Environ. 235:117615. doi:https://doi.org/10.1016/j.atmosenv.2020.117615.
- Zamora, M. L., F. Xiong, D. Gentner, B. Kerkez, J. Kohrman-Glaser, and K. Koehler. 2019. Field and Laboratory Evaluations of the Low-Cost Plantower Particulate Matter Sensor. Environ. Sci. Technol. 53 (2):838–49. doi:https://doi.org/10.1021/acs.est.8b05174.