
 ?Mathematical formulae have been encoded as MathML and are displayed in this HTML version using MathJax in order to improve their display. Uncheck the box to turn MathJax off. This feature requires Javascript. Click on a formula to zoom.
Abstract
A short distance between infected persons and exposed persons can probably result in a high risk of respiratory infection. This work experimentally investigated the short-range bioaerosol deposition and inhalation by a healthy person (HP) and the effect of a personalized ventilation (PV) on the HP, who was exposed to cough droplets from an infected person (IP) over a short distance between 0.5 m and 1.2 m. Benign E. coli was employed to represent the pathogen from the respiratory droplets. The microorganism deposition on different locations of the HP’s body (shoulder, chest and body back) and face (forehead, cheek, and chin) as well as inhalation were characterized by a cultivation method. It was found that the inhalation and deposition of vital pathogens on the face and body surface of the HP increased as the distance between the HP and the IP decreased. PV has been showed to reduce exposure by inhalation, while this is the first time to demonstrate that PV can also significantly reduce the number deposition. By optimizing the velocity of PV flow with respect to the distance, the bioaerosol deposited on the face and body and inhaled could be reduced by a maximum of 98%, 85% and 100%, respectively. For short-range disease transmission, physical barriers, e.g., mask and partition, are the conventional and believed to be the only intervention measures. The current results indicate that PV can be a potential method for infection control in the area of disease transmission in close contact situations.
Copyright © 2021 American Association for Aerosol Research
EDITOR:
1. Introduction
Due to the outbreaks of severe acute respiratory syndrome (SARS), H1N1 influenza, Meningitis, Pertussis, Diphtheria, and recently COVID-19 pandemic, the control and prevention strategy of respiratory disease transmission has become a global issue and concern. In indoor environments, exposed persons have a high possibility to be infected when facing expiratory activities (breathing, talking and coughing) from infected persons (Morawska et al. Citation2020; Park et al. Citation2015; Raja et al. Citation2010). Plenty of pathogen-laden droplets, as the major source of disease transmission, are generated by infected persons (Lindsley et al. Citation2010; Milton et al. Citation2013; Stelzer‐Braid et al. Citation2009). Some of the exhaled droplets directly spray on the mucous membrane of exposed persons over a short distance, called the large droplet route (Hall Citation2007); some of them are inhaled by exposed persons either at a short or long range, called the airborne transmission route (Chen et al. Citation2018; Mui et al. Citation2009; Wei and Li Citation2016); some of them deposit on exposed persons’ body and environmental surfaces. Then, the deposited droplets are possibly contacted by hands of the exposed persons that spread or transfer the pathogens to their mucous membranes. This is called fomite transmission (Boone and Gerba Citation2007).
In close contact situations, the deposited droplets, as the source of fomite transmission and large droplet route, contribute substantially to respiratory disease transmission. It was reported that 20%–40% of nosocomial infections were caused by contaminated hands of healthcare workers (Kundrapu et al. Citation2012; Weber et al. Citation2010) and high frequency touched environmental surfaces (Otter, Yezli, and French Citation2014).
Studies also showed that people touch their private surfaces (e.g., their own faces and bodies, nearby computers, etc.) by hands are more frequently than touching public surfaces (Zhang, Li, and Huang Citation2018) and pathogens deposited on surfaces can survive from hours to weeks (Greatorex et al. Citation2011; Walther and Ewald Citation2004). There is a high infection risk for the exposed person by fomite transmission when exhaled droplets deposited on the body and clothes. Liu et al. (Citation2020) investigated the bioaerosol transport released from a lying patient in a two-bed hospital ward. Results showed that 1.11%–3.33% of bioaerosol deposited on the two patients and health care workers. Shi and Zhao (Citation2013) investigated the deposition of airborne particles in diameter from 0.01 μm to 5 μm on exposed persons. Results indicated that direct deposition of particles (diameter < 0.05 μm and diameter > 0.5 μm) on body surfaces was more important than that of particles ranging from 0.05 μm to 0.5 μm in diameter. Sze To et al. (Citation2009) and Wan et al. (Citation2009) studied the deposition of cough droplets from an infected person in an aircraft cabin. Results showed that most of droplets deposited on the nearby seats, passengers and ground. The passenger on the seat immediately in front of the infected person had much larger deposited mass fraction than other passengers. In these studies, the exposed persons were thought as a unit and only an overall deposition value was obtained. The detailed bioaerosol distribution on the exposed person was ignored. While, it has been reported that the touch frequency by the exposed people is different on their own different body and face parts (Zhang, Li, and Huang Citation2018). Meanwhile, the viability of pathogens on the skin and clothing is different. Therefore, the bioaerosol depositions and initial viable pathogen distributions on the different parts of the exposed person, such as, face and clothes surfaces, are essential information for accurate infection risk analysis, while the related information is limited.
Personalized ventilation (PV) has been suggested to be a disease transmission control method. PV supplies fresh air directly to the inhalation zone of the PV user, diluting the contaminants (Cermak et al. Citation2004; Melikov, Cermak, and Majer Citation2002) and making a clean and healthy microenvironment (Fanger Citation2000; Faulkner et al. Citation1999). Pantelic et al. (Citation2009) and Pantelic, Tham, and Licina (Citation2015) investigated the protection of the user by PV flow, who suffered cough droplets from different distances (between 1 and 4 m) and different orientations. Results showed that PV was able to reduce the exposure time, peak value, and personal exposure substantially. Yang et al. (Citation2013) evaluated the combined effect of a PV system with a personalized exhaust (PE) and indicated that the properly designed PV-PE system was able to protect the user and minimize the spread of contaminated air. Shen, Gao, and Wang (Citation2013) indicated that the protection of PV airflow was highly affected by the PV airflow rate, PV terminal and background ventilation systems. Lipczynska, Kaczmarczyk, and Melikov (Citation2015) reported that PV airflow combined with chilled ceiling could substantially reduce the exposure to infectious air at workstations and meet the requirement of thermal comfort simultaneously. Liu et al. (Citation2017) compared the importance of the long-range airborne route and short-range airborne route, and suggested that PV could be an effective intervention for the short-range airborne route.
Although properly designed PV has been demonstrated to be an effective way to control airborne disease transmission by reducing the inhalation exposure, few studies have investigated the impact of PV flow on pathogen-laden droplet deposition on exposed persons. The above mentioned studies focus on the effect of PV on reducing the HP’s exposure to airborne droplets. However, poly dispersed cough droplets, containing more pathogens due to their large volume, are released with a high velocity. The projectile characteristic makes them easy to deposit on the front exposed persons over a short distance. The detailed cough droplet deposition onto an exposed person in front, over a short distance and the effect of PV flow are still unknown. Therefore, besides the effect of PV flow on the inhalation, it is essential to investigate whether reducing the droplet deposition by PV flow on the exposed person during close contact with the infected person is an additional function of PV flow.
Thus, the objectives of this work were to investigate the short-range bioaerosol deposition and inhalation of a healthy person who was exposed to cough droplets over a short distance, and the effect of PV flow on the deposition and inhalation of bioaerosol. Benign Escherichia coli was used to represent the pathogen inside the expiratory droplets. Bioaerosol was released by a cough generator and the deposition and inhalation were assessed by a cultivation method.
2. Experimental instruments and methods
2.1. Bioaerosol generation
In this work, simulated saliva solution was made by dissolution of 76 g of glycerin and 12 g of salt (NaCl) in 1 liter of sterilized distilled water according to the nonvolatile content in the respiratory fluid (Sze To et al. Citation2009). Benign E. coli (ATCC 11303), with a safety level of one, was used to represent the respiratory microorganisms (Kunkel et al. Citation2017; Leung et al. Citation2013). The nutritious solution used for the growth of E. coli was composed of 30 g of Tryptone Soya Broth (TSB) powder and 1 L of distilled water and was sterilized at 121 °C for 20 min in an autoclave. A colony forming unit (CFU) of E. coli obtained by the streak plate method was transferred to the nutritious solution and an incubator was used to cultivate the E. coli in the nutritious solution at 37 °C for around 24 h. Then, a centrifuge was used to separate the E. coli from the solution, after which, the E. coli pellet was resuspended in the simulated saliva solution by vibration. The initial concentration of the E. coli was prepared between 1 × 10⁶ and 2 × 10⁶ CFU/mL by serial dilution (Nicas and Best Citation2008; Nicas and Sun Citation2006).
A custom-built cough generator with an atomization nozzle was used to generate the cough droplets using the prepared saliva solution with E. coli. The size distribution of generated droplets was similar to those exhaled by people. The detailed description of the cough generator can be found in our previous work (Sze To et al. Citation2009). The release rate of the solution was 0.075 ml/s and the flow rate of compressed air for atomization was 308 ml/s for a cough activity. The air-atomizing nozzle of the cough generator was positioned at the mouth of a thermal manikin, which was labeled as the infected person (IP). The aerosolized droplets were released horizontally to simulate a cough activity.
2.2. Experimental setup
The experiment was performed in a chamber of 4.0 m (length) * 2.6 m (width) * 2.3 m (height). During the experiment, the room temperature and relative humidity were maintained at 24 ± 1 °C and 65 ± 5%, respectively. A window-type air conditioner unit, widely used in Hong Kong (Bojic, Yik, and Lo Citation2002; Lin and Deng Citation2006), was used to control the air temperature. The air supply flow rate was 290 m3/h, which was measured by a capture hood (Model 8380, TSI, USA) with a resolution of 1 m3/h. Two identical seated male-shaped thermal manikins, with a height of 1.4 m and a heat release rate of 70 W for moderate office work (ASHRAE Citation2009), were used to simulate the IP and the healthy person (HP) who was exposed to cough droplets from the IP, as shown in . The clothing insulation for each thermal manikin was around 0.46 clo. The two thermal manikins were placed in a face-to-face situation and the distance between the HP and IP was 0.5 m, 0.8 m, and 1.2 m. The situation was used to represent a case of a relatively short distance between two people during close contact. Such cases might occur when two people have face-to-face conversations, such as, people in an office, public transport (e.g., buses or trains) or during doctor-patient interaction in a hospital.
Figure 1. (a) Schematic diagram of the experimental setup in the chamber. (b) Air flows for the background ventilation and the exhaust.
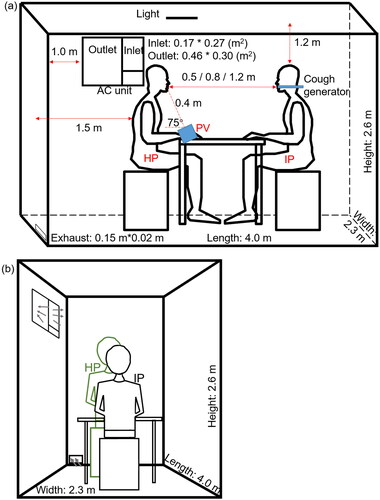
The nozzle of the cough generator positioned at the mouth of the IP manikin was used to simulate coughing. The HP thermal manikin was seated on a chair in front of a desk, where a PV terminal with a honeycomb flow straightener was placed facing the HP. The diameter of the PV terminal was 0.108 m. The angle between PV terminal and the table was 75°. The distance between the PV terminal and the mouth of the HP was 0.4 m, as shown in . The PV system was connected to another chamber so that fresh air was supplied from the PV directly to the HP. The exhaust was only operated when PV was used.
The experiment was performed under different PV velocities and different distances between the IP and the HP (0.5 m, 0.8 m, and 1.2 m). An anemometer (Swema 03, Sweden) with velocity measuring range of 0.05–3.0 m/s and an accuracy error of ±3% was used to measure the flow velocity around the HP’s inhalation zone. At each distance, three PV velocities of 0.75 m/s, 1.2 m/s, and 1.6 m/s, measured around the inhalation zone of the HP, were investigated. The corresponding flow rate of PV was 10 L/s, 16 L/s and 23 L/s, respectively. During each distance, the performance of PV airflow with three different velocities was compared.
Three coughing activities were generated lasting for one second with an interval of 30 s in the experiment. Both of the bioaerosol deposition and inhalation by the HP were measured. Control cases were conducted without turning on the PV. Each measurement was repeated three or four times. After each measurement, two ultraviolet light ozone generators were activated for 30 min for sterilization. Then, sufficient time was given for ventilation to clean the chamber before the next measurement.
2.3. Measurement of bioaerosol deposition on the HP manikin
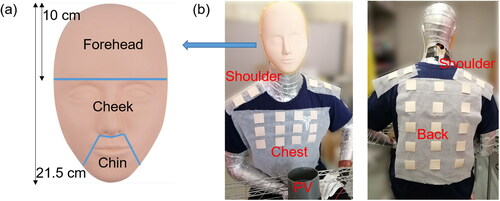
Deposition of bioaerosol was measured on the HP’s face and body parts. A 3-D silicone mask with a plastic support (Xuanhui trading company, Guangzhou, China) was used to cover the HP’s face before the experiment, as shown in . The face was divided into three areas: forehead, cheek and chin. The measurement on the body parts of the HP included chest, back and shoulder. For these measurements, square pieces of silicone sheets (4 cm * 4 cm) were used for sampling. Silicone sheets were positioned on the chest (12 pieces), back (15 pieces) and shoulders (8 pieces) of the HP before the experiment (). The silicone mask and silicone sheets made from the same material were used to eliminate the effect of surface properties on the deposition and survivability of the microorganisms. After the experiment, the silicone mask was cut into corresponding parts, all silicone sheets on every body parts were removed from the HP, and they were sealed into separate bottles with 50 ml of saline solution. The bottles were shaken by hands for five minutes in order to disperse the deposited bioaerosol into the saline solution. The concentration of E. coli bacteria from each part of the body and face was determined by the cultivation method at 37 °C for 24 h in the incubator, based on colony-forming unit (CFU).
Figure 2. Sampling measurements (a) at the HP’s face and (b) body surfaces.
The deposition density on each part was calculated using the following EquationEquation (1)(1)
(1) :
(1)
(1)
where Asampling (cm2) was the surface area of the silicone sheets for sampling on each individual parts of the HP. The (Number deposition)sampling (CFU) was the total number of deposited viable E. coli on the silicone sheets of each part. The unit of the Deposition density was CFU/cm2.
The number deposition of E. coli on the HP’s body surfaces was determined by the product of deposition density and total area of each part via EquationEquation (2)(2)
(2) :
(2)
(2)
where Apart (cm2) was the surface area of chest (770 cm2), back (1575 cm2) and shoulder (512 cm2) on the thermal manikin (the HP). The number deposition (CFU) on the face was equal to the (number deposition)sampling caused by the cough activities. The term ‘number deposition’ means the number of deposited viable bacteria on each part. In the following, the term of ‘deposition’ was used to represent the ‘number deposition’.
2.4. Measurement of inhalation of bioaerosol
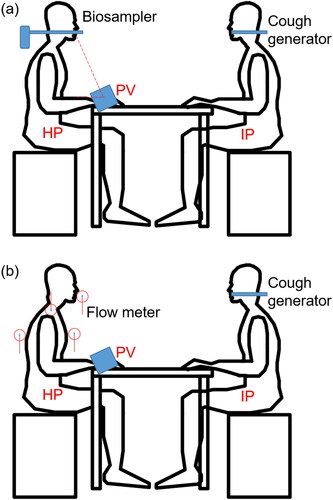
A biosampler (SKC, Eighty Four, PA, USA) was used to measure the inhalation of bioaerosol of the HP in the inhalation zone, as shown in . The biosampler was connected to the HP’s mouth through a short metal tube. Airborne pathogen-laden droplets were trapped by the biosampler by swirling liquid. The standard sampling flow rate of 12.5 L/min was used to simulate the inhalation phase of human respiration (Tang et al. Citation2014). The average human breathing rate from 9.90 L/min to 13.8 L/min was widely used (Olmedo et al. Citation2012; Liu et al. Citation2017; Environmental Protection Agency Citation1997) to represent the breathing process in light activities. It was reasonable to use the SKC biosampler to simulate the breathing process. There was 20 ml sterilized saline solution in the collection vessel to collect airborne droplets. The biosampler started to operate 10 s ahead of the generation of cough droplets. The measurement time was 100 s, which covered the three coughing activities and allowed the concentration of cough droplets in the inhalation zone to decay into the background concentration as checked by an optical particle sizer (Model 3330, TSI, Shoreview, MN, USA). After the experiment, the collection vessel was sealed by the Parafilm (Bemis). Then the cultivation method was used to acquire the concentration of the viable bacteria in the solution and overall inhaled number of viable bacteria.
Figure 3. Schematic showing the measurements of (a) bioaerosol inhalation by SKC Biosampler and (b) cough air jet velocity.
2.5. Velocity of cough air jet
It has been found that during the release of coughing activities the cough droplets first followed the exhaled air puff, then, large droplets gradually settled down due to gravity effect and deposited on some surfaces, while small droplets remained suspended in the exhaled air, and then dispersed in the environment (Pantelic et al. Citation2009; Sze To et al. Citation2009; Xie et al. Citation2007), so in order to understand the droplet dynamics, it is important to measure the air velocity caused by the cough. Since the solution release rate was much smaller than that of the compressed air in the cough generator, in order to avoid the high concentration of droplets damaging the measuring instrument, without loss of the accuracy, the saliva solution valve was closed during the measurement of the velocity distribution around the HP. This cough release without solution was called cough air jet.
The velocity of cough air jet around the face, chest, and shoulder was measured by the anemometer (Swema 03, Sweden) as shown in . For the velocity of the cough air jet at the shoulder, the probe of the anemometer was placed vertical to the surface of the shoulders. When the velocity on the face was measured, the probe was placed with the protection cage of the anemometer touching the mouth. The radius of the protection cage was 4.4 cm. For the chest, the probe was positioned at the center of the sampling area with the protection cage touching the chest. To measure the velocities caused by background ventilation around the HP (i.e., no cough air jet), the probe was set at the same positions as before.
3. Results
3.1. Short-range bioaerosol exposure
The short-range bioaerosol deposition on the HP and inhalation by the HP were influenced by distance effect (0.5 m, 0.8 m and 1.2 m). The effect of PV flow with three different velocities (0.75 m/s, 1.2 m/s and 1.6 m/s) was also investigated in this study.
3.1.1. Short-range bioaerosol deposition on the HP
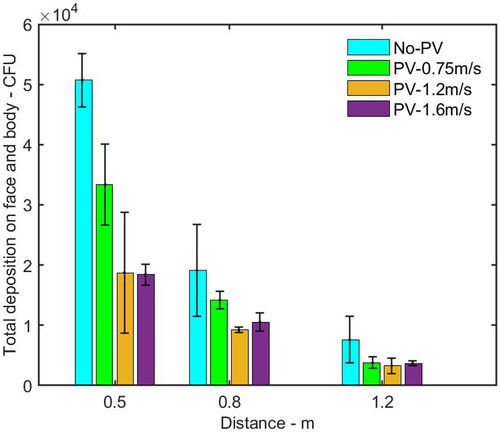
When PV was off, the velocity around the HP manikin caused by the background ventilation was between 0.06 m/s to 0.1 m/s, as shown in . The total deposition of microorganism on the HP’s face and body surfaces without PV were plotted in . The average number and standard deviation were calculated based on three repeated experiments. Increasing the distance between the HP and the IP from 0.5 m to 0.8 m and 1.2 m reduced the total deposition on the HP from 5.1 × 10⁴ to 1.9 × 10⁴ and 7.6 × 10³ CFU, respectively.
Figure 4. Total number of bacteria deposited on the HP (the face and body surfaces) and number of bacteria deposited on the HP’s face and body surfaces at different distances from the IP. The average and standard deviation (error bar) of deposition from three repeated experiments were reported in each histogram.
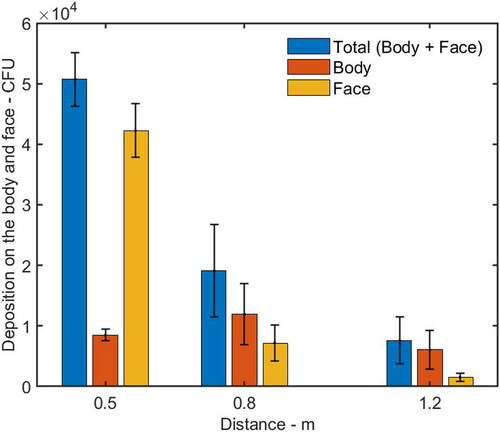
Table 1. The velocity of cough air around the face, chest, left shoulder and right shoulder on the HP without PV when the IP was located at distances of 0.5 m (HP-0.5 m), 0.8 m (HP-0.8 m) and 1.2 m (HP-1.2 m).
When the HP was located at a distance of 0.5 m from the IP, the number of deposition on the HP’s face (including forehead, cheek and chin) was 4.6 times as high as that on the body parts (including chest, shoulder, and back), as shown in . For the individual parts of the HP, the deposition on the shoulder, chin, cheek, and forehead was higher than that on the back and chest, as shown in . The cough droplets containing bacteria had a high initial velocity around 11.7 m/s. The air velocity from the cough, reaching the HP’s face, was around 1.61 m/s which was much higher than the background velocity of 0.08 m/s (). It was suggested that most of the cough droplets followed the cough air jet and directly impinged on the HP’s face because of the high inertia, while some of the droplets settled on the body surfaces.
Figure 5. Number of bacteria deposited on individual parts of the HP’s face and body surfaces at different distances from the IP. The average and standard deviation (error bar) of deposition from three repeated experiments were reported in each histogram.
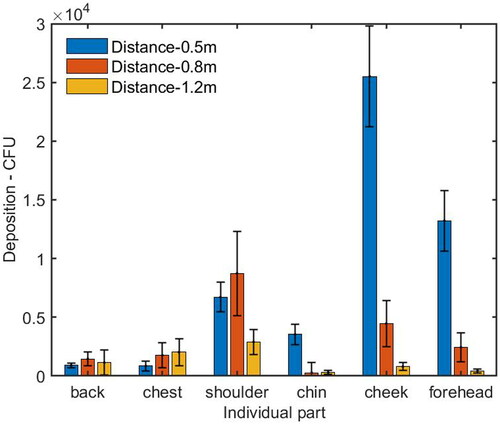
When the HP was moved farther away at a distance of 0.8 m from the IP, the deposition on the forehead and cheek was reduced dramatically, while the deposition on the shoulder was increased and it was higher than that on the forehead and cheek (). The deposition on the HP’s body surfaces was 1.6 times as high as that on the face, as shown in . Since the velocity caused by the cough air jet around the face, chest, and left/right shoulder are 0.93 m/s, 0.18 m/s and 0.26/0.30 m/s, respectively, the reduced deposition and decayed velocity reflected the fact that more large droplets did not follow the horizontal cough air jet because the trajectory of the large droplets went downward, to some extent, due to gravity effect, and deposited on the area of the HP’s chest.
When the HP was positioned at a distance of 1.2 m from the IP, the deposition on the HP’s body surfaces was around 3.9 times higher than that on the face, as shown in . The cough velocity caused by the cough air jet on the face, chest and left/right shoulder was around 0.46 m/s, 0.18 m/s, and 0.45/0.43 m/s, respectively (), which were further reduced by comparing with the case at a distance of 0.8 m. The deposition on the HP’s body and face were also reduced significantly. There are three possible reasons. First, as the cough jet traveled forward, it went further downward and deposited on the lower part of the HP’s body surface. Second, the cough jet became wider and dispersed over a larger area, resulting in a lower number density reaching the HP. Third, the dispersed droplets were more easily influenced by air motion caused by background ventilation so that some droplets were observed to be deposited on the back of the body.
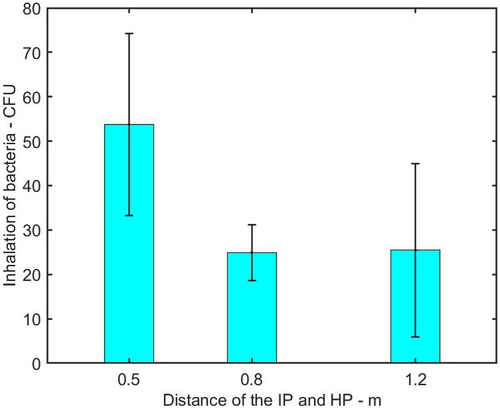
3.1.2. Inhalation of bioaerosol by the HP
shows the inhalation of bioaerosol by the HP at different distances from the IP. It was found that the distance between the IP and HP was an important factor on the inhalation of pathogen-laden droplets. Increasing the distance from 0.5 m to 0.8 m reduced the inhalation of microorganisms from 54 CFU to 25 CFU, resulting in a reduction of 54%. Moreover, the number of inhaled microorganisms was almost the same when the IP was at a distance of 0.8 m and 1.2 m.
Figure 6. Inhalation of bacteria of the HP measured by SKC Biosampler at different distances from the IP. The average and standard deviation (error bar) of deposition from three repeated experiments were reported in each histogram.
3.2. Performance of PV
3.2.1. Bioaerosol deposition on the HP with PV
In this section, the deposition of bioaerosol on the HP with the effect of PV is discussed. Three PV velocities measured around the HP’s inhalation zone, 0.75 m/s, 1.2 m/s, and 1.6 m/s were examined. By comparing with the cases without PV, it was found that the total number of deposition influenced by PV flow was reduced by up to 63.7%, 51.7%, and 57.1%, respectively when the HP was located at distances of 0.5 m, 0.8 m and 1.2 m from the IP, as shown in .
Figure 7. Total number of bacteria deposited on the HP including face and body surfaces with and without PV at different distances from the IP. The average and standard deviation (error bar) of deposition from three repeated experiments were reported in each histogram.
When the HP was located at a distance of 0.5 m from the IP, by comparing the case without PV, the depositions on the HP’s face and body parts influenced by PV flow was reduced by up to 63% and 79%, respectively, as shown in . shows that PV flow reduced the deposition on almost all the individual parts. It was likely that when the cough flow and PV flow collided, the cough flow probably blown off PV flow. After a while, PV flow reestablished and blew off the droplets or changed their trajectory (Pantelic, Tham, and Licina Citation2015). When the HP was at a distance of 0.8 m from the IP, as shown in , the deposition on the face and body surfaces under the PV flow was reduced by up to 39% and 69%, respectively. As shown in , the number of microorganisms deposited on most of the individual parts under PV flow was lower than that without PV, except for the forehead, when the PV velocity was 1.6 m/s, the number of deposition on the forehead was higher than that without using PV. Since the PV flow was pointing upward in the current design, it is suspected that if the PV velocity is too high, it would enhance the inertia impaction effect of the droplet deposition. When the HP was moved to a distance of 1.2 m from the IP, the PV can still reduce the deposition on the body and face surfaces, as shown in . Comparing with the case without PV, the reduction of deposition on the body was between 60% and 55%, and the reduction on the face was between 18% and 47%. indicates that PV flow also reduced the deposition on the back, chest, and shoulder significantly.
Figure 8. Number of bacteria deposited on the HP’s face and body surfaces with and without PV at a distance of (a) 0.5 m, (b) 0.8 m, and (c) 1.2 m from the IP. The average and standard deviation (error bar) of deposition from three repeated experiments were reported in each histogram.
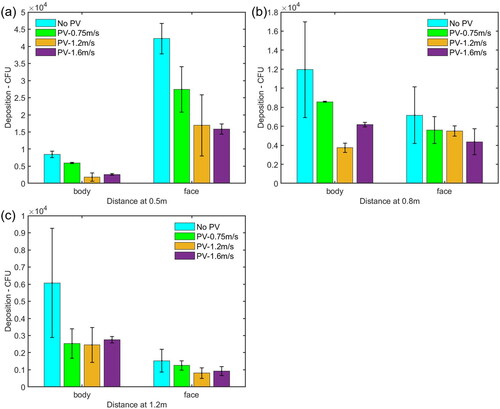
Figure 9. Number of bacteria deposited on individual parts of the HP’s face and body surfaces with and without PV at a distance of (a) 0.5 m, (b) 0.8 m, and (c) 1.2 m from the IP. The average and standard deviation (error bar) of deposition from three repeated experiments were reported in each histogram.
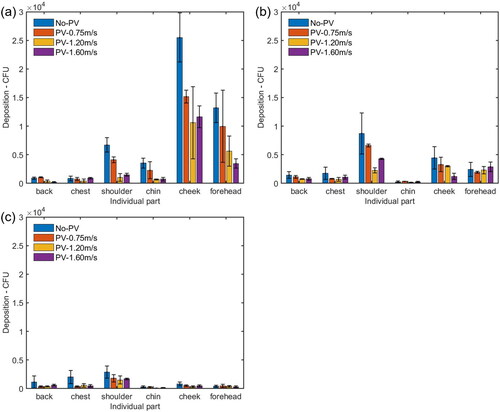
In this work, the number of bacteria deposited on the HP’s face and body parts was reduced by up to 98% and 85% respectively by considering the velocity of PV flow (0.75–1.6 m/s) with the distance between the HP and IP (0.5–1.2 m). As mentioned before, it was found that, in some cases, PV flow with a velocity of 1.6 m/s slightly increased the deposition on some of the individual parts of the HP compared with that of PV flow with a lower velocity of 1.2 m/s. It indicates that an optimal PV velocity should be sought for the best protection. But the velocity is also limited by the user perspective, because a high velocity of PV airflow around the face may result in discomfort and eye blink for the HP (Nan Citation2006).
Deposition on the body back was also observed and it indicated that airborne droplets from coughing activities could be influenced by the air motion caused by background ventilation and vortices created by the cough jet going around the face. Similar results were also found in the previous research (Kunkel et al. Citation2017) where microorganism deposition was found at locations of 0.5 m, 3 m, and 5 m from the release point in an apartment with a recirculating HVAC system. However, when PV was used, the deposition on the body back was reduced in most cases, which shows the effect of dilution provided by the PV flow.
3.2.2. Inhalation of bacteria by the HP with PV
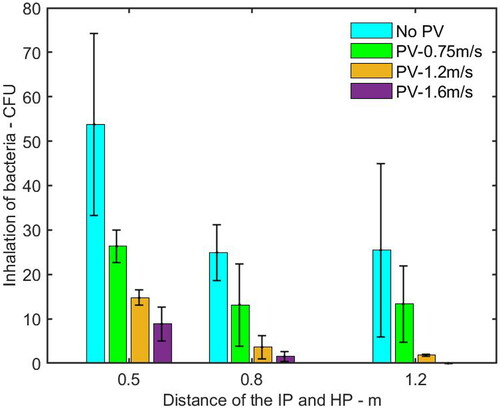
shows the inhalation of pathogen-laden droplets by the HP with PV flow at different distances from the IP. The inhalation was decreased dramatically when the PV velocity increased from 0.75 m/s to 1.6 m/s. Compared with the case without PV, the reduction of inhalation influenced by PV was up to 83%, 94%, and 100% when the IP was located at a distance of 0.5 m, 0.8 m, and 1.2 m, respectively. Especially, when the IP was located at a distance of 1.2 m from the HP with PV at a velocity of 1.6 m/s, there was no inhaled microorganism detected by cultivation.
Figure 10. Inhalation of bacteria of the HP with and without PV measured by SKC Biosampler at different distances from the IP. The average and standard deviation (error bar) of deposition from three repeated experiments were reported in each histogram.
4. Discussion
The present work investigated the short-range bioaerosol deposition and inhalation of the HP exposed to cough droplets and the performance of PV flow on protection for the HP. Without PV, large number of pathogens were found deposited on the face suggests that coughing from the IP in a short distance poses a high threat on the HP. Apart from the direct spray on the mucous membranes, e.g., eyes, nose and mouth, the deposited droplets on the face (except for mucous membranes) and clothes are possibly touched by the hands of the person and then transferred to the mucous membranes, resulting in an infection. Moreover, washed hands become dirty again by unconsciously touching their bodies. The deposited pathogens on the body could contaminate chairs and tables when people are working, possibly resulting in a surface touch network that contaminates more places in the environment (Lei et al. Citation2017; Zhang, Li, and Huang Citation2018). Results in this work suggest that coughing from the IP in a short distance poses a high threat on the HP. The detail distributions of the deposited bioaerosol on different parts of the face and body found in this work could help modeling the infection risk via the contact route. The current finding could be integrated into the model of infection risk assessment, working as the initial bioaerosol concentration in different touching positions.
This work demonstrates that PV not only effectively reduces inhalation of airborne droplets, but also has the potential to decrease the bioaerosol deposition on the HP. During close contact, conventionally, physical barriers, such as surgical masks, face shields or partitions, are the only effective intervention methods to prevent pathogens depositing on the HP. The current finding proposes to consider PV as one of the infection prevention strategies.
However, there are some limitations in this study. This work investigated two seated people in face-to-face scenarios. When the coughing IP released the droplets, it was assumed that the IP was stationary and in a fixed orientation with respect to the HP. It may deviate slightly from realistic situations. During close contact, people would like to turn left, turn right, lower or raise the heads from time to time which are not considered in this study. Further studies have been conducting to investigate the IP with different head postures and at different orientations during coughing activities. The measurement of bioaerosol deposition on the body and face surfaces was performed on silicone samples and silicone masks in order to eliminate the effect of surface properties on the survivability of the bacteria. In reality, people wear different types of clothing and this will affect the deposition and survivability of the bacteria. The bioaerosol deposition on the mucous membranes of the eyes, mouth, and nose was not considered separately in this work. Future work has been performing to investigate the deposition on the mucous membranes. The reduced bioaerosol deposition indicates that PV airflow has a potential to reduce the droplet deposition. But the information about the diameter of reduced droplets is lacking. It is necessary to investigate the dominant size range of the droplets, which is mainly affected by the PV flow. The high velocity of PV airflow around the face may cause eye irritation or draught risk for the PV users. Further studies are needed to investigate the suitable air velocity range for PV to meet the requirement of thermal comfort and indoor air quality simultaneously. Moreover, the supply flow rate corresponded to circulation rates of 12 per hour in the experimental design. This kind of high supply flow rate is usually used in hospitals and clean rooms.
E. coli was used to represent the bacterial pathogens inside cough droplets, while some infectious diseases are transmitted via virus laden aerosols. The study from Wang, Fu, and Chao (Citation2020) found that bacteria or viruses inside cough droplets did not affect the short-range bioaerosol deposition and distribution on the front surfaces. Thus, it was expected that the results of this work based on bacterium E.coli could represent both the bacterium and virus laden droplet deposition on front person. However, Kunkel et al. (Citation2017) indicated that virus-laden airborne droplets had different performance from the bacteria-laden airborne droplets in the bioaerosol transport in indoor environments. Therefore, the impact of microorganisms on aerodynamics will be more pronounced from short-range to long-range and future studies about the inhalation of virus-laden droplets by the exposed persons are needed for a complete picture.
5. Conclusions
The present study investigated the short-range bioaerosol deposition and inhalation by the HP, and the ability of PV flow to protect the HP, who was exposed to cough droplets from the IP over a short distance between 0.5 m and 1.2 m. The key findings of this study are summarized as follows:
The exhaled cough droplets can directly deposit on the healthy person’s face and body when the IP is at distance of 0.5 m and 0.8 m. When the HP is at a distance of 1.2 m from the IP, the number of deposited pathogens is significantly reduced. Increasing distance to 1.2 m results in a reduction of deposition and inhalation of up to 85% and 54% on the HP, respectively, but the deposition is not low enough for 1.2 m as a safe distance.
The deposition and inhalation can be substantially reduced by turning on the PV when the IP is at close distance. Considering the optimized PV flow with the distance between the HP and the IP, the maximum reduction in the number of deposition and inhalation of pathogens is up to 94% and 100%, respectively. A larger PV flow performs better to prevent the inhalation of airborne pathogen-laden droplets, but it is not the case for droplet deposition, where an optimal PV flow velocity should be sought. PV airflow has the potential to be a useful method to reduce the bioaerosol deposition on the healthy person and inhalation by the healthy person simultaneously.
The current finding of bioaerosol deposition could be integrated into the model of infection risk assessment, working as the initial bioaerosol concentration in different touching positions.
Additional information
Funding
References
- ASHRAE. 2009. ASHRAE handbook fundamentals. Atlanta, GA: ASHRAE.
- Bojic, M., F. Yik, and T. Lo. 2002. Locating air-conditioners and furniture inside residential flats to obtain good thermal comfort. Energy Build. 34 (7):745–51. doi: https://doi.org/10.1016/S0378-7788(01)00143-8.
- Boone, S. A., and C. P. Gerba. 2007. Significance of fomites in the spread of respiratory and enteric viral disease. Appl. Environ. Microbiol. 73 (6):1687–96. doi: https://doi.org/10.1128/AEM.02051-06.
- Cermak, R., A. K. Melikov, L. Forejt, and O. Kovar. 2004. Distribution of contaminants in the occupied zone of a room with personalized and displacement ventilation. In 9th International Conference on Air Distribution in Rooms, University of Coimbra, Coimbra, Portugal.
- Chen, C., B. Zhao, D. Lai, and W. Liu. 2018. A simple method for differentiating direct and indirect exposure to exhaled contaminants in mechanically ventilated rooms. Build. Simul. 11 (5):1039–51. doi: https://doi.org/10.1007/s12273-018-0441-0.
- Environmental Protection Agency. 1997. Exposure factors handbook. Vol. 1, EPA/600/P-95/002F a-c. Washington, DC: Environmental Protection Agency.
- Fanger, P. O. 2000. Human requirements in future air-conditioned environments: A search for excellence. In IVth International Building Installation, Science and Technology Symposium, 13–22: Turkish Society of HVAC and Sanitary Engineers, Istanbul, Turkey.
- Faulkner, D., W. J. Fisk, D. P. Sullivan, and D. P. Wyon. 1999. Ventilation efficiencies of desk-mounted task/ambient conditioning systems. Indoor Air. 9 (4):273–81. doi: https://doi.org/10.1111/j.1600-0668.1999.00007.x.
- Greatorex, J. S., P. Digard, M. D. Curran, R. Moynihan, H. Wensley, T. Wreghitt, H. Varsani, F. Garcia, J. Enstone, and J. S. Nguyen-Van-Tam. 2011. Survival of influenza A(H1N1) on materials found in households: implications for infection control. PLoS One. 6 (11):e27932. doi: https://doi.org/10.1371/journal.pone.0027932.
- Hall, C. B. 2007. The spread of influenza and other respiratory viruses: Complexities and conjectures. Clin. Infect. Dis. 45 (3):353–9. doi: https://doi.org/10.1086/519433.
- Kundrapu, S., V. Sunkesula, L. A. Jury, B. M. Sitzlar, and C. J. Donskey. 2012. Daily disinfection of high-touch surfaces in isolation rooms to reduce contamination of healthcare workers' hands. Infect. Control Hosp. Epidemiol. 33 (10):1039–42. doi: https://doi.org/10.1086/667730.
- Kunkel, S., P. Azimi, H. Zhao, B. Stark, and B. Stephens. 2017. Quantifying the size-resolved dynamics of indoor bioaerosol transport and control. Indoor Air. 27 (5):977–87. doi: https://doi.org/10.1111/ina.12374.
- Lei, H., Y. Li, S. Xiao, X. Yang, C. Lin, S. L. Norris, D. Wei, Z. Hu, and S. Ji. 2017. Logistic growth of a surface contamination network and its role in disease spread. Sci. Rep. 7 (1):1–10. doi: https://doi.org/10.1038/s41598-017-13840-z.
- Leung, W. T., G. N. Sze‐To, C. Y. H. Chao, S. C. T. Yu, and J. K. C. Kwan. 2013. Study on the interzonal migration of airborne infectious particles in an isolation ward using benign bacteria. Indoor Air. 23 (2):148–61. doi: https://doi.org/10.1111/j.1600-0668.2012.00797.x.
- Lin, Z., and S. Deng. 2006. A questionnaire survey on sleeping thermal environment and bedroom air conditioning in high-rise residences in Hong Kong. Energy Build. 38 (11):1302–7. doi: https://doi.org/10.1016/j.enbuild.2006.04.004.
- Lindsley, W. G., F. M. Blachere, R. E. Thewlis, A. Vishnu, K. A. Davis, G. Cao, J. E. Palmer, K. E. Clark, M. A. Fisher, R. Khakoo, et al. 2010. Measurements of airborne influenza virus in aerosol particles from human coughs. PLoS One 5 (11):e15100. doi: https://doi.org/10.1371/journal.pone.0015100.
- Lipczynska, A., J. Kaczmarczyk, and A. K. Melikov. 2015. Thermal environment and air quality in office with personalized ventilation combined with chilled ceiling. Build. Environ. 92:603–14. doi: https://doi.org/10.1016/j.buildenv.2015.05.035.
- Liu, Z. J., L. Q. Wang, R. Rong, S. F. Fu, G. Q. Cao, and C. C. Hao. 2020. Full-scale experimental and numerical study of bioaerosol characteristics against cross-infection in a two-bed hospital ward. Build. Environ. 186:107373. doi: https://doi.org/10.1016/j.buildenv.2020.107373.
- Liu, L., Y. Li, P. V. Nielsen, J. Wei, and R. L. Jensen. 2017. Short-range airborne transmission of expiratory droplets between two people. Indoor Air. 27 (2):452–62. doi: https://doi.org/10.1111/ina.12314.
- Melikov, A. K., R. Cermak, and M. Majer. 2002. Personalized ventilation: Evaluation of different air terminal devices. Energy Build. 34 (8):829–36. doi: https://doi.org/10.1016/S0378-7788(02)00102-0.
- Milton, D. K., M. P. Fabian, B. J. Cowling, M. L. Grantham, and J. J. McDevitt. 2013. Influenza virus aerosols in human exhaled breath: Particle size, culturability, and effect of surgical masks. PLoS Pathog. 9 (3):e1003205. doi: https://doi.org/10.1371/journal.ppat.1003205.
- Morawska, L., J. W. Tang, W. Bahnfleth, P. M. Bluyssen, A. Boerstra, G. Buonanno, J. Cao, S. Dancer, A. Floto, F. Franchimon, et al. 2020. How can airborne transmission of COVID-19 indoors be minimised? Environ. Int. 142:105832. doi: https://doi.org/10.1016/j.envint.2020.105832.
- Mui, K., L. Wong, C. Wu, and A. C. Lai. 2009. Numerical modeling of exhaled droplet nuclei dispersion and mixing in indoor environments. J. Hazard. Mater. 167 (1–3):736–44. doi: https://doi.org/10.1016/j.jhazmat.2009.01.041.
- Nan, G. 2006. Human perception of local air movement in the tropics. PhD diss., National University of Singapore.
- Nicas, M., and D. Best. 2008. A study quantifying the hand-to-face contact rate and its potential application to predicting respiratory tract infection. J. Occup. Environ. Hyg. 5 (6):347–52. doi: https://doi.org/10.1080/15459620802003896.
- Nicas, M., and G. Sun. 2006. An integrated model of infection risk in a health-care environment. Risk Anal. 26 (4):1085–96. doi: https://doi.org/10.1111/j.1539-6924.2006.00802.x.
- Olmedo, I., P. V. Nielsen, M. Ruiz de Adana, R. L. Jensen, and P. Grzelecki. 2012. Distribution of exhaled contaminants and personal exposure in a room using three different air distribution strategies. Indoor Air. 22 (1):64–76. doi: https://doi.org/10.1111/j.1600-0668.2011.00736.x.
- Otter, J. A., S. Yezli, and G. L. French. 2014. The role of contaminated surfaces in the transmission of nosocomial pathogens. In Use of biocidal surfaces for reduction of healthcare acquired infections, ed. G. Borkow, 27–58. Switzerland: Springer International Publishing. https://www.springer.com/gp/book/9783319080567.
- Pantelic, J., G. N. Sze-To, K. W. Tham, C. Y. Chao, and Y. C. Khoo. 2009. Personalized ventilation as a control measure for airborne transmissible disease spread. J. R. Soc. Interface 6 (Suppl 6):S715–S726. doi: https://doi.org/10.1098/rsif.2009.0311.focus.
- Pantelic, J., K. W. Tham, and D. Licina. 2015. Effectiveness of a personalized ventilation system in reducing personal exposure against directly released simulated cough droplets. Indoor Air. 25 (6):683–93. doi: https://doi.org/10.1111/ina.12187.
- Park, K.-T., D.-G. Cho, J.-W. Park, S. Hong, and J. Hwang. 2015. Detection of airborne viruses using electro-aerodynamic deposition and a field-effect transistor. Sci. Rep. 5:17462. doi: https://doi.org/10.1038/srep17462.
- Raja, S., Y. Xu, A. R. Ferro, P. A. Jaques, and P. K. Hopke. 2010. Resuspension of indoor aeroallergens and relationship to lung inflammation in asthmatic children. Environ. Int. 36 (1):8–14. doi: https://doi.org/10.1016/j.envint.2009.09.001.
- Shen, C., N. Gao, and T. Wang. 2013. CFD study on the transmission of indoor pollutants under personalized ventilation. Build. Environ. 63:69–78. doi: https://doi.org/10.1016/j.buildenv.2013.02.003.
- Shi, S., and B. Zhao. 2013. Deposition of indoor airborne particles onto human body surfaces: a modeling analysis and manikin-based experimental study. Aerosol Sci. Technol. 47 (12):1363–73. doi: https://doi.org/10.1080/02786826.2013.843772.
- Stelzer‐Braid, S., B. G. Oliver, A. J. Blazey, E. Argent, T. P. Newsome, W. D. Rawlinson, and E. R. Tovey. 2009. Exhalation of respiratory viruses by breathing, coughing, and talking. J. Med. Virol. 81 (9):1674–9. doi: https://doi.org/10.1002/jmv.21556.
- Sze To, G., M. Wan, C. Chao, L. Fang, and A. Melikov. 2009. Experimental study of dispersion and deposition of expiratory aerosols in aircraft cabins and impact on infectious disease transmission. Aerosol Sci. Technol. 43 (5):466–85. doi: https://doi.org/10.1080/02786820902736658.
- Tang, J. W., C. X. Gao, B. J. Cowling, G. C. Koh, D. Chu, C. Heilbronn, B. Lloyd, J. Pantelic, A. D. Nicolle, C. A. Klettner, et al. 2014. Absence of detectable influenza RNA transmitted via aerosol during various human respiratory activities-experiments from Singapore and Hong Kong. PLoS One. 9 (9):e107338. doi: https://doi.org/10.1371/journal.pone.0107338.
- Walther, B. A., and P. W. Ewald. 2004. Pathogen survival in the external environment and the evolution of virulence. Biol. Rev. Camb. Philos. Soc. 79 (4):849–69. doi: https://doi.org/10.1017/s1464793104006475.
- Wan, M. P., G. N. Sze To, C. Y. H. Chao, L. Fang, and A. K. Melikov. 2009. Modeling the fate of expiratory aerosols and the associated infection risk in an aircraft cabin environment. Aerosol Sci. Technol. 43 (4):322–43. doi: https://doi.org/10.1080/02786820802641461.
- Wang, C. T., S. C. Fu, and C. Y. Chao. 2020. Short-range bioaerosol deposition and recovery of viable viruses and bacteria on surfaces from a cough and implications for respiratory disease transmission. Aerosol Sci. Technol. 55 (2):215–230.
- Weber, D. J., W. A. Rutala, M. B. Miller, K. Huslage, and E. Sickbert-Bennett. 2010. Role of hospital surfaces in the transmission of emerging health care-associated pathogens: Norovirus, clostridium difficile, and acinetobacter species. Am. J. Infect. Control. 38 (5 Suppl 1):S25–S33. doi: https://doi.org/10.1016/j.ajic.2010.04.196.
- Wei, J., and Y. Li. 2016. Airborne spread of infectious agents in the indoor environment. Am. J. Infect. Control. 44 (9 Suppl):S102–S8. doi: https://doi.org/10.1016/j.ajic.2016.06.003.
- Xie, X., Y. Li, A. Chwang, P. Ho, and W. Seto. 2007. How far droplets can move in indoor environments-revisiting the Wells evaporation-falling curve. Indoor Air. 17 (3):211–25. doi: https://doi.org/10.1111/j.1600-0668.2007.00469.x.
- Yang, J., C. Sekhar, D. C. K. Wai, and B. Raphael. 2013. Computational fluid dynamics study and evaluation of different personalized exhaust devices. HVAC&R Res. 19 (8):934–46. doi: https://doi.org/10.1080/10789669.2013.826066.
- Zhang, N., Y. Li, and H. Huang. 2018. Surface touch and its network growth in a graduate student office. Indoor Air. 28 (6):963–72. doi: https://doi.org/10.1111/ina.12505.