
 ?Mathematical formulae have been encoded as MathML and are displayed in this HTML version using MathJax in order to improve their display. Uncheck the box to turn MathJax off. This feature requires Javascript. Click on a formula to zoom.
Abstract
The recently developed aerosol sampler called mini particle sampler (MPS), which is equipped with a porous transmission electron microscopy (TEM) grid, renders nanoparticle sampling convenient. The present study aims to improve the nanoparticle sampling efficiency and to optimize the sampling technology. The sensitivity of the parameters in the whole set-up is estimated by the Taguchi method. The effects of the main parameters on the collection efficiency are compared between experiments and theories. The sampling efficiencies are determined for particles with mobility diameters ranging from 5 to 100 nm. The results show that parameters: salt concentration of the atomizer, high-voltage polarity in the differential mobility analyzer (DMA), sampling efficiency assessment method, sampling temperature, and porosity of the porous TEM grid minimally affect the collection efficiency. Small filter pore size and high flowrate promote particle capturing, but may aggravate the burden on the TEM grid. Denser particles increase the deposition possibility due to impaction, and thereby increasing the overall collection efficiency. The minimum collection efficiency is up to 40% by adjusting the parameter settings of the sampling system. The results are of immediate importance for assessing nano-exposure using the MPS sampling system.
Copyright © 2021 American Association for Aerosol Research
EDITOR:
1. Introduction
Nanoparticles negatively affect human organs and tissues directly or by carrying toxic components (Elsaesser and Howard Citation2012; Shatkin Citation2017). Nano exposure and assessment have been widely investigated. The high-resolution TEM (Mathis et al. Citation2004; Maynard et al. Citation2004; Chen et al. Citation2005; Ku and Maynard Citation2005) coupled with associated techniques enables nanomaterial physical, chemical, morphological characterization, and individual particle analysis. For this technique, preparing well-dispersed particles for analysis is critical but time-consuming.
To facilitate sampling, airborne nanoparticles can be collected on the TEM grid by electrostatic precipitation (Miller et al. Citation2010; Fierz et al. Citation2015), thermophoretic precipitation (Lyyränen et al. Citation2009; R’mili et al. Citation2011; Leith et al. Citation2014), Brownian diffusion (Tsai et al. Citation2009; Tsai and Theisen Citation2018) and impaction (Birch et al. Citation2011). Sharma et al. (Citation2020) proposed a method to increase the overall charge fraction by increasing the plasma power of the electric field for the radio-frequency plasma, which assisted particle capturing for TEM analysis. Jiang, Hogan, et al. (Citation2007) validated the efficient charging of photoionization and diffusion for 6–15 nm silver and sucrose nanoparticles, which contributed to the improvement of particle capture efficiency.
Recently, a TEM grid-equipped sampler MPS (R’mili et al. Citation2013) was developed by Institute National de l’Environnement Industrial et des Risques (INERIS) and commercialized by the company Ecomesure (R’mili et al. Citation2013; Shandilya et al. Citation2015). This technique has turned out to be portable, low cost, and easier to use (Bressot et al. Citation2015, Citation2018a) than a sampling system based on electrostatic precipitation or thermophoretic precipitation, which are more cumbersome and require energy-consuming tools to prior charge particles or to create a thermal gradient (Bau et al. Citation2010; Li, Liu, and Zhu Citation2010). It can be employed in the field of occupational hygiene and consumer exposure assessment since the TEM grid is directly ready for TEM analysis once sampled (R’mili et al. Citation2013) and just a few minutes of sampling is required. Researches on nanoparticle exposure assessment (Fonseca et al. Citation2018; Morgeneyer, Aguerre-Chariol, and Bressot Citation2018; Bressot et al. Citation2018b; Zhao and Zhang Citation2019) and powder structure characterization (Le Bihan et al. Citation2016; Chakravarty et al. Citation2017; Bourrous et al. Citation2018) have validated the applicability of the MPS.
The sampling efficiencies of the TEM grid-equipped MPS have been determined by R’mili et al. (Citation2013) and Ogura et al. (Citation2014). Operating with different types of TEM grids, the minimum efficiencies are below 20% in the size range of 5–300 nm. A higher sampling efficiency is expected to collect airborne nanoparticles for subsequent analysis to prevent underestimating exposure and to facilitate sampling campaigns.
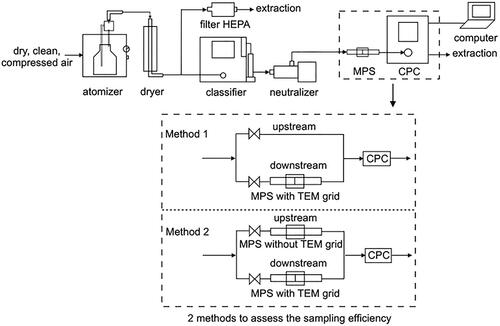
The set-up for evaluating the nanoparticle collection efficiency comprises an aerosol generator, an electrostatic classifier, an MPS, and some types of particle measurement devices, in this case a CPC (R’mili et al. Citation2013; Ogura et al. Citation2014). The parameter settings may have impacts on the collection efficiency. On the one hand, according to the theoretical models, the sampling efficiency is related to the properties of the TEM grid, particle, and flow (R’mili et al. Citation2013). The relationship requires estimations for effective particle collection. On the other hand, besides the filter, factors involved in other parts of the set-up contain possibilities of affecting efficiency. For example, evaluating the sampling efficiency of a membrane requires the determination of the fraction of trapped particles when the aerosol passes through. The particle loss of different efficiency assessment methods () is different and may affect the collection efficiency. Generally, one TEM grid-equipped MPS is utilized (method 1). Valves are utilized for inducing the flow to a condensation particle counter (CPC) directly, or via the MPS. Another method employs two parallel MPSs (method 2) (Innocentini et al. Citation2015). Both MPSs are connected to the CPC, and one is equipped with a TEM grid. Some authors recommended this method (Heim et al. Citation2005) because the particle loss in the tubes is similar when measuring the particle concentration upstream and downstream. Here, downstream refers to the flow with the TEM grid; while upstream refers to the other, as shown in . However, the difference between these two methods remains unclear. The sampling technology requires optimization by adjusting parameters to improve the sampling efficiency.
Figure 1. Concept diagram of the experimental set-up.
Traditional full factorial experiments require lots of tests to explore the effects of parameters. The Taguchi method is used to design experiments for reducing experimental costs (Albetran, Dong, and Low Citation2015). It is an optimization method which conducts and evaluates the results of matrix experiments to determine the best levels of control factors. It keeps the output variance very low even in the presence of noise inputs.
The objective of this study is to improve the nanoparticle collection efficiency of a TEM grid-equipped sampling system and evaluate how collection efficiency varies with parameter settings. The Taguchi method is used for tracking the sensitivities of parameters in the whole set-up, which is a first attempt. For understanding the effects of the parameters involved in the theoretical models, the experimental and theoretical collection efficiencies are compared.
2. Materials and method
2.1. Experimental set-up
The design of the experimental set-up is shown in . Polydisperse aerosols were generated by an atomizer (AGK 2000). After removing moisture by two silica gel driers, monodisperse aerosols were mostly produced by an electrostatic classifier (3082, TSI) comprising a neutralizer (3088) and a nano DMA (3085A). The neutralizer was utilized first to establish an equilibrium charge state on the particles, with known percentages of particles carrying no charge, single charge, and multiple charges associated with positive and negative polarities entering the DMA (Givehchi, Li, and Tan Citation2015; Chen et al. Citation2018). The DMA was used to remove the residuals of ultrapure water and to choose particles within a narrow range of electrical mobility. Besides the mobility, particle diameters removed from the DMA also depend on the number of charges on the particles. That means singly charged particles with the chosen mobility diameter and bigger particles with multiply charges were generated. However, for particles smaller than 100 nm, the singly charged particles were much more than the multiply charged particles (Wiedensohler Citation1988), thus majority of the generated particles were monodisperse. The aerosolized particles were neutralized by a second radioactive source (TSI 3087) upstream of the filter to avoid unwanted electrostatic effects on the filtration (Romo-Kröger Citation1989; Chen et al. Citation2013). Finally, the particle number concentration was measured by a CPC (3787, TSI). The sampling efficiency Eexp of each selected particle size was calculated based on the particle number concentration (Hinds Citation1999):
(1)
(1)
where and
are particle number concentrations downstream and upstream.
2.2. Parameters analysis
The sensitivities of parameters involved in the filtration theory were analyzed under the sampling conditions listed in . NaCl (ρNaCl=2165 kg·m−3) and CsCl (ρCsCl=3988 kg·m−3) particles were captured by three kinds of 400 mesh Copper TEM grids: S143-3 Quantifoil 1.2/1.3, S173-3 Quantifoil 2/2, and S174-3 Quantifoil 2/1 at flowrates of 0.4 and 0.6 L·min−1 and flow temperatures of 290 and 300 K. The nominal values of the filter parameters were similar to the measured data. Particle mobility diameters were set as: 5, 7, 10, 20, 30, 40, 60, 80, and 100 nm. It is worth noting that the used TEM grid consists of a “Quantifoil” holey carbon film and a copper mesh, as shown in (R’mili et al. Citation2013; Ogura et al. Citation2014). Ogura et al. (Citation2014) studied the overall sampling efficiency considering the porosity of carbon film and copper mesh. The theoretical calculation indicated that only a small number of particles were collected on the copper mesh and very few particles were observed on the copper mesh during SEM analysis. The pore size of carbon film (<2 µm) was much smaller than that of copper mesh (>40 µm), and majority of the particles were captured by the holey carbon film. The collection efficiency of the copper mesh can be ignored.
Figure 2. Concept diagram of the MPS.
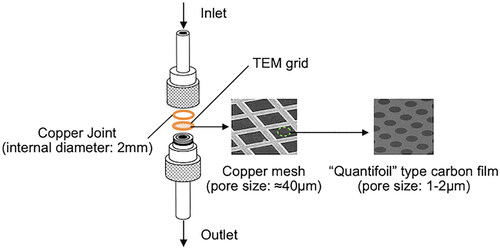
Table 1. Setting of parameters involved in the theoretical models: particle type, flow conditions as well as structural characteristics of the carbon film.
In addition to those parameters involved in the filtration theory, the effects of factors associated with other parts of the set-up including the atomizer, DMA and CPC were evaluated through the Taguchi experimental results. Among these, the generated particle concentration increases with the applied pressure and salt concentration of the atomizer within a range. Salt concentration was chosen to investigate the impact of particle concentration on the sampling efficiency. 0.8 bar of applied pressure was used for the tests since very few particles were generated when the pressure was below 0.6 bar. Positive or negative high-voltage (HV) polarity can be added on the center rod of DMA to provide an electric field. If the negative polarity is used, positively charged particles within a narrow range of electrical mobility can exit from the small slit of the collector rod. Even if the built-in 3088 neutralizer was reported to yield a high charge efficiency (Lee et al. Citation2005; Jiang, Lee, et al. Citation2007; Mamakos Citation2016), there is still a difference between negatively and positively charging efficiency because of the different ion mobilities (Jiang et al. Citation2014; Charan et al. Citation2018), especially for submicrometer particles. The charged particle concentration varies with HV polarity, which may have an impact on the sampling efficiency. In addition, the different efficiency assessment methods may affect the collection efficiency, as explained in the introduction. A value of 10 was chosen for the sheath aerosol flowrate ratio in DMA due to its improved monodispersity (Sachinidou, Bahk, and Wang Citation2017). The maximum resolution, 64 channels, was selected to enhance the accuracy of the measured values. The scan time of 40 s was selected for monodisperse particle measurement.
2.3. Taguchi experimental design
In the Taguchi method, the signal-to-noise ratio (SNR) measures the quality characteristic deviating from the desired value. It is performed to get the best parameter combination. Statistical analysis of variance is used to figure out the statistically significant factors with P values less than 0.05. Besides salt concentration, efficiency assessment method, and HV polarity, a parameter involved in the theoretical models: flowrate was added for comparison. For pursuing a higher efficiency, a larger SNR was better. The SNR can be calculated by:
(2)
(2)
where n is the replication number of the experiment, and is the characteristic property.
Five factors with 2 levels were chosen:
Factor A: Salt concentration. Two levels of NaCl concentration were determined: 0.2 and 20 mmol·L−1. Excessive particles can block the filter and change its properties. Particle concentration and filter property may affect the collection efficiency.
Factor B: HV polarity. Positive and negative HV polarity were set to measure negatively-charged and positively charged particles, respectively.
Factor C: Sampling efficiency assessment method. Two common methods were utilized, one-MPS utilized method and two-MPS utilized method, as explained in the introduction.
Factor D: Flowrate. Two types of flowrate were selected as 0.4 and 0.6 L·min−1. The pressure drop of the TEM grid increased with flowrate when capturing particles. It was close to the maximum limit of the CPC entrance when the flowrate was 0.6 L·min−1. Meanwhile, the inlet flowrate of DMA 3085 must be higher than 0.2 L·min−1, and the propositional flowrate range of the neutralizer is 0.3–5 L·min−1 (Mitchell et al. Citation2001).
Factor E: Particle mobility diameter. 10 and 100 nm was chosen.
For five factors with two levels tests, the L12 (2^5) orthogonal array has been selected using MINITAB 18. Compared with the 32 full factorial experiments, 12 tests were required for exploring the impacts of these five factors on the collection efficiency using the Taguchi method. 1.2/1.3 carbon film TEM grids were used and the flow temperature was set as 300 K.
2.4. Sobol sensitivity analysis
The sensitivity analysis of parameters involved in the theoretical models was carried out by the Sobol method using Monte-Carlo based integration. Working within a probabilistic framework, it decomposes the variance of the model output into fractions attributed to individual parameters and the interactions between the parameters (Sobol Citation2001; Saltelli et al. Citation2008). The total-effect index measures the total contribution to the output variance of the factor.
3. Theoretical sampling efficiency
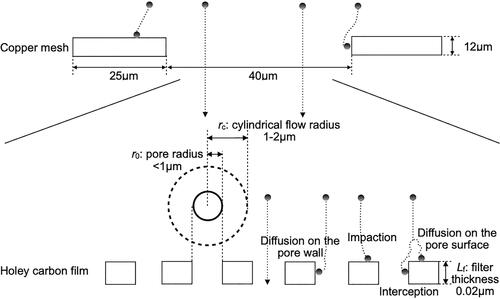
It’s a good way to evaluate the filter collection efficiency by investigating the sampling mechanisms. For the “Quantifoil” type grids, pores are distributed with equal spaces on the filter surface and are uniform in size, like the Nuclepore filters. Their sampling mechanisms are the same and the capillary tube model can be used. The aerodynamic and capture mechanisms of the TEM grid were modeled in . Since the collection efficiency of the copper mesh can be ignored according to Ogura et al. (Citation2014), the carbon film was taken into account in the theoretical calculation. The number of pores per surface unit of the carbon film is expressed as The pore radius is
and the pore area is
The ratio of pore area to carbon film surface area is porosity P:
(Manton Citation1978, Citation1979). The filter thickness is
Cylindrical aerosol stream with radius
passed through a unitary pore,
(Manton Citation1978, Citation1979). Particles were collected onto the filter surface or deposited on the wall of filter pores. Distinct capture mechanisms were found: a) capture of small particles by Brownian diffusion to the pore wall of filter, and b) by Brownian diffusion on the surface of filter, c) capture of large particles by impaction, and d) interception (Spurny et al. Citation1969; Rubow Citation1981; Bulejko Citation2018). Gravity sedimentation can be neglected for particle size smaller than 500 nm (Zhu et al. Citation2017).
Figure 3. Aerodynamics and capture mechanisms of the filter.
Many theoretical models have been developed to calculate the collection efficiency due to individual capture mechanisms. Appropriate models should be chosen according to the filter structural characteristics and the flow conditions. The Reynolds number is calculated for determining the flow type:
(3)
(3)
where
is the kinematic fluid viscosity (≈1.5 × 10⁻⁵ m2·s−1 for air) and
is the flow face velocity given by the flowrate Q and the section area of carbon film:
(4)
(4)
where df is the diameter of carbon film, here is 2 mm.
The airflow has low Reynold numbers under the sampling conditions we used (<1), and the samplings are carried out in thin circular pipes, the flow type can be considered as laminar, or Poiseuille flow. Considering that flow slip at the filter pore wall could affect the filtration mechanism and enhance the sampling efficiency in the intermediate crossover regime between Brownian diffusion and direct interception (Marre and Palmeri Citation2001), the model of Marre and Palmeri (Citation2001) to calculate the combined efficiency of wall diffusion and interception was chosen (Xiang et al. Citation2020).
(5)
(5)
(6)
(6)
(7)
(7)
(8)
(8)
(9)
(9)
(10)
(10)
(11)
(11)
(12)
(12)
(13)
(13)
(14)
(14)
(15)
(15)
For >100, and
(16)
(16)
For <100.
Where lg, the slip length, is equal to 1.126 (Marre et al. Citation2004).
is the particle radius, and
is the fluid molecule mean free path, ≈0.069 µm.
is a parameter related to the diffusion coefficient
given by:
(17)
(17)
D can be calculated by the Stokes–Einstein equation (Hinds Citation1999; Li et al. Citation2002):
(18)
(18)
is the fluid dynamic viscosity, 1.85 × 10⁻⁵ kg·m−1·s−1; KB is the Boltzmann constant, 1.381 × 10⁻²³ J· K−1 for air; T is the temperature; Cc is the Cunningham correction factor which related to
Knudsen’s number (
):
(19)
(19)
where a = 1.165, b = 0.483, and c = 0.997 are experimentally determined coefficients given by Kim et al. (Citation2005) with the help of a nano DMA (Coquelin et al. Citation2018).
For the diffusion efficiency due to particle deposition on the filter surface the model of Manton (Citation1979) was selected:
(20)
(20)
where =4.5,
is the normalized diffusion coefficient,
is a parameter determined by the least-squares fitting, which related to the filter porosity:
(21)
(21)
For impaction efficiency, the model of Pich (Citation1964) fitted our sampling conditions. Laminar flow with parabolic streamlines and constant flow velocity in the flow direction are supposed in this model. The impaction efficiency is calculated as:
(22)
(22)
(23)
(23)
(24)
(24)
Stk is the Stokes number, which is given by:
(25)
(25)
where ρp is the particle density.
The overall collection efficiency can be calculated by individual sampling mechanisms (Hinds Citation1999):
(26)
(26)
In summary, parameters KB, T, η, λ, Lf, r0, P, Q, df, and ρp are involved in the theoretical models, with KB, η, λ, Lf, and df being constant. Values of r0, P, Q, ρp, and T can be altered during samplings. The settings of these five parameters are shown in .
4. Results and discussion
Each test was repeated three times to have an average efficiency and a standard deviation.
4.1. Parameter sensitivity by Taguchi method
The experimental results of the Taguchi method for each parameter combination are shown in . The responses include sampling efficiency and standard deviation (STDEV).
Table 2. Orthogonal array and experimental results of Taguchi method.
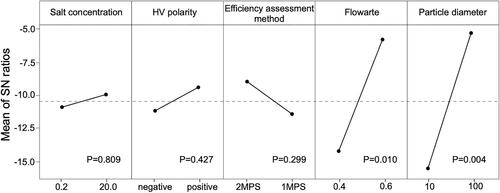
displays the main effects plot for SNR. P values resulted from variance analysis are also shown in the figure. Particle diameter and flowrate have large effects on the SNR, with P values of 0.004 and 0.01. Particle size is a crucial factor involving different particle collection mechanisms. Experiment runs with 100 nm has much higher SNR than experiment runs with 10 nm. The sampling efficiency of the TEM grid for the 100 nm particles is higher. It is attributed to a better capturing ability due to individual collection mechanisms. The change of flowrate alters the most penetrating particle size (MPPS), where the total collection efficiency is the lowest (Smith, Phillips, and Melo Citation1976; Yamamoto et al. Citation2004). Experiment runs with 0.6 L·min−1 flowrate has higher SNR than 0.4 L·min−1, hence high flowrate is recommended for capturing nanoparticles. Parameters: salt concentration, sampling efficiency assessment method, and HV polarity have small effects on the SNR, with high P values of 0.809, 0.209, and 0.427 respectively. According to Amaral et al. (Citation2010), NaCl concentration less than 5 g·L−1 significantly affected the size distribution of generated particles. However, our results demonstrate that its impact on the collection efficiency is minor. It could be that the salt concentration influences both the particle concentration upstream and downstream. The results indicate that characterizing exposure to low aerosol concentration is possible. The impact of the particle charging efficiency of different polarities on the sampling efficiency is also minor. In addition, the particle loss of both efficiency assessment methods is similar. Consequently, the sampling efficiency is most impacted by the parameters involved in the theoretical models.
Figure 4. Main effects plot for SN ratios of the Taguchi method.
4.2. Comparison of experimental and theoretical collection efficiency
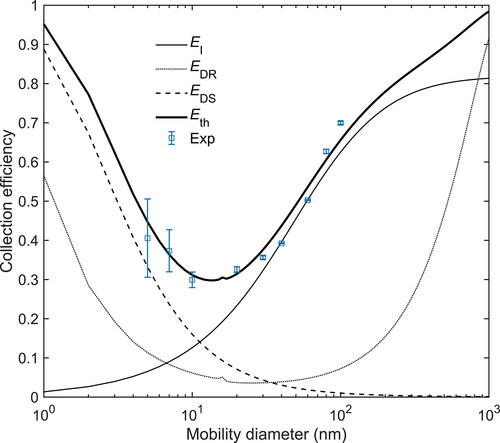
Individual sampling mechanisms should be combined to discuss the effects of parameters involved in the theoretical models on the overall efficiency. Here, the sampling condition 1 in is chosen as an example. The comparison of experimental and theoretical collection efficiency is shown in . The experimental overall collection efficiencies (Eexp) are described as mean ± standard deviation. Eth is the overall theoretical collection efficiency. Diffusion efficiency due to pore wall deposition (EDW), due to surface deposition (EDS), impaction efficiency (EI), and interception efficiency (ER) are shown in the figure respectively. The experimental collection efficiency ranges from 32% to 70% with a minimum at particle diameter of 20 nm. The relative standard deviations are mostly less than 0.01, which validate the reproducibility of the set-up. For 5 nm particles, the number concentration is too low to keep constant. The minimum efficiency calculated by the theoretical models is about 30% at particle diameter around 14 nm. This is consistent with the experimental results. For particles smaller than 10 nm, the diffusion efficiency due to surface deposition is high. For particles larger than 20 nm, impaction is an essential mechanism. The combined efficiencies of diffusion and interception due to filter pore wall deposition are smaller than 10% for the particle size range of 5–100 nm. Few particles are captured by the pore wall since the ratio of pore length and pore size is small (Smith, Phillips, and Melo Citation1976).
Figure 5. Comparison of experimental (Eexp) and theoretical (Eth) collection efficiency.
4.3. Sensitivity analysis of parameters involved in the theoretical models
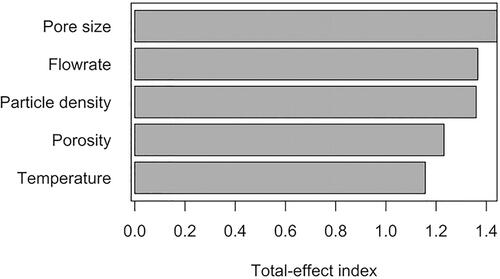
According to the results of the Taguchi analysis, the sampling efficiency is most affected by the parameters involved in the theoretical models. Theoretical models indicate that the sampling efficiency depends on the filter pore size, filter porosity, flowrate, temperature, and particle density. shows the total-effect indices of these five parameters using Sobol sensitivity analysis method. Considering that the input parameters are uniformly distributed, a ±10% value change is applied to these parameters under the sampling condition 1. The results show that for the same excursion, pore size, flowrate, and particle density contribute in changing the collection efficiencies more than porosity and temperature. In addition, under the operating conditions, altering the temperature in kelvin by 10% is unnecessary. The impact of temperature should be less.
Figure 6. Sensitivity analysis of parameters involved in the theoretical sampling efficiency models.
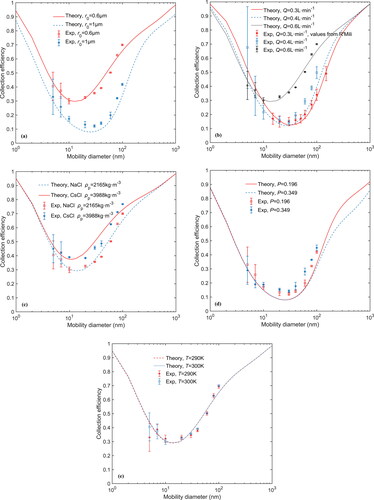
Samplings () were carried out to explore the influences of these parameters on the sampling efficiency. 0.2 mmol·L−1 NaCl was used, 2 MPS used method was chosen, and negative HV polarity was set here. shows the comparison of experimental and theoretical approaches to assess the collection efficiency using MPS sampling system with different particle types, TEM grids, and flow conditions. The theoretical efficiencies calculated by models fit well with the experimental values. The results confirm that the pore size, flowrate, and particle density exert the most significant influence on the sampling efficiency. Comparing sampling conditions 1 and 5, shows that the overall collection efficiency decreases with the pore size. With the pore size decreases from 1 to 0.6 µm, the minimum efficiency enhances from 10% to 30%. A small pore size increases the collection efficiency due to diffusion and impaction and they are required to effectively capture nanoparticles. depicts the impact of the flowrate on the sampling efficiency by comparing sampling conditions 1 and 4. Results of sampling at the flowrate of 0.3 L·min−1 by R’mili et al. (Citation2013) (sampling with “Quantifoil 1.2/1.3” TEM grid) were compared since the same particle type and TEM grid were used. For flowrate ranging from 0.3 to 0.6 L·min−1, the minimum collection efficiency increases from 13% to 30% and the MPPS moves toward a smaller diameter (35–14 nm). For particle sizes larger than the MPPS, a higher flowrate produces a higher overall collection efficiency; while for small particles, lower efficiencies are observed when increasing the flowrate. By increasing the flowrate, the probability of particle deposition because of inertial impaction also increases. This enhances the collection efficiency of large particles; but is less likely to capture particles due to diffusion, thereby decreasing the collection efficiency for small particles (Gentry, Spurny, and Schoermann Citation1982), as reported in the previous studies (Yamamoto et al. Citation2004). Comparing sampling conditions 1 and 2, particle type also emerged as a significant factor for capturing particles. With particle density increases from 2165 to 3988 kg·m−3, the minimum efficiency enhances from 30% to 40%. According to the theoretical models, high particle density changes the value of Stk and thereby increasing the impaction efficiency for CsCl particles. According to , the efficiencies of different TEM grid porosities (0.2–0.35) exhibit minor differences, especially for particles with diameters smaller than 100 nm. A low porosity increases the impaction efficiency only for particles larger than 100 nm. The effect of the temperature on the collection efficiency is also marginal and limited by the small range, although a high temperature can alter the D value and enhances the diffusion efficiency according to the theoretical models.
Figure 7. The effects of (a) pore size; (b) flowrate; (c) particle type; (d) porosity; and (e) temperature on the theoretical and experimental collection efficiency.
5. Conclusion
In this study, sampling technology involving a TEM grid was optimized to elevate the nanoparticle sampling efficiency. Using Taguchi method, the effects of parameters in the set-up on the collection efficiency were evaluated. In contrast to parameters in theoretical efficiency models, parameters: salt concentration, HV polarity, and efficiency assessment method displayed minor impacts on the collection efficiency. Salt concentration of the atomizer may impact the generated particle size distributions, but an inconspicuous effect was observed for the collection efficiency. The impact of the particle charging efficiency on the sampling efficiency was also minor. Considering the cost, the particle concentration measurement using one MPS is acceptable.
The effects of the influential parameters from the theoretical models were also compared using experimental and theoretical data for particles with diameters between 5 and 100 nm, and the data were consistent. Small pore size and high flowrate promoted particle capturing but aggravated the burden of the TEM grid, with a potential to damage the CPC. Also, denser particles increased the deposition probability due to impaction, thereby enhancing the overall collection efficiency. They can be chosen preferentially as references for exploring pollution characterization methods. The collection efficiency decreased with porosity (0.2–0.4), but increased with temperature, though the effects of both were marginal.
Compared to the 15% proposed in R’Mili’s study, the minimum collection efficiency of this sampling system was improved to 40% by increasing the flowrate (0.3–0.6 L·min−1) and choosing denser material (2165–3988 kg·m−3). Using filters with smaller pore size and choosing denser particles, room for improving the sampling efficiency still exists. In addition, for eliminating the possible effect by TEM grid charging, sampler grounding or current elimination is recommended for future applications. This study has directive meaning for the assessment and characterization of nano exposure using an MPS sampling system.
Disclosure statement
The authors declare that they have no known competing financial interests or personal relationships that could have appeared to influence the work reported in this article.
References
- Albetran, H., Y. Dong, and I. M. Low. 2015. Characterization and optimization of electrospun TiO2/PVP nanofibers using Taguchi design of experiment method. J. Asian Ceram. Soc. 3 (3):292–300. doi:https://doi.org/10.1016/j.jascer.2015.05.001.
- Amaral, C. D., V. G. Guerra, F. d O. Arouca, and J. R. Coury. 2010. Effect of the salt solution concentration in the number and size distribution of atomized nanometric aerosol particles. MSF. 660–661:581–6. doi:https://doi.org/10.4028/www.scientific.net/MSF.660-661.581.
- Bau, S., F. Ouf, S. Miquel, O. Rastoix, and O. Witschger. 2010. Experimental measurement of the collection efficiency of nanoparticles samplers based on electrostatic and thermophoretic precipitation. International Aerosol Conference, 29 Aug–3 Sep, Helsinki, Finland.
- Birch, M. E., B.-K. Ku, D. E. Evans, and T. A. Ruda-Eberenz. 2011. Exposure and emissions monitoring during carbon nanofiber production: Part I: Elemental carbon and iron-soot aerosols. Ann. Occup. Hyg. 55 (9):1016–36. doi:https://doi.org/10.1093/annhyg/mer073.
- Bourrous, S., Q. Ribeyre, L. Lintis, J. Yon, S. Bau, D. Thomas, C. Vallières, and F.-X. Ouf. 2018. A semi-automatic analysis tool for the determination of primary particle size, overlap coefficient and specific surface area of nanoparticles aggregates. J. Aerosol Sci. 126:122–32. doi:https://doi.org/10.1016/j.jaerosci.2018.09.001.
- Bressot, C., A. Aubry, C. Pagnoux, O. Aguerre-Chariol, and M. Morgeneyer. 2018a. Assessment of functional nanomaterials in medical applications: Can time mend public and occupational health risks related to the products' fate? J. Toxicol. Environ. Health. A 81 (19):957–73. doi:https://doi.org/10.1080/15287394.2018.1477271.
- Bressot, C., N. Shandilya, T. Jayabalan, G. Fayet, M. Voetz, L. Meunier, O. L. Bihan, O. Aguerre-Chariol, and M. Morgeneyer. 2018b. Exposure assessment of nanomaterials at production sites by a short time sampling (sts) approach: Strategy and first results of measurement campaigns. Process Saf. Environ. Prot. 116:324–32. doi:https://doi.org/10.1016/j.psep.2018.02.012.
- Bressot, C., N. Shandilya, E. S. d C. Nogueira, A. Cavaco-Paulo, M. Morgeneyer, O. L. Bihan, and O. Aguerre-Chariol. 2015. Exposure assessment based recommendations to improve nanosafety at nanoliposome production sites. J. Nanomater. 2015:1–10. doi:https://doi.org/10.1155/2015/931405.
- Bulejko, P. 2018. Numerical comparison of prediction models for aerosol filtration efficiency applied on a hollow-fiber membrane pore structure. Nanomaterials 8 (6):447. doi:https://doi.org/10.3390/nano8060447.
- Chakravarty, S., O. L. Bihan, M. Fischer, and M. Morgeneyer. 2017. Dust generation in powders: Effect of particle size distribution. EPJ Web Conf. 140:13018. doi:https://doi.org/10.1051/epjconf/201714013018.
- Charan, S. M., W. Kong, R. C. Flagan, and J. H. Seinfeld. 2018. Effect of particle charge on aerosol dynamics in Teflon environmental chambers. Aerosol Sci. Technol. 52 (8):854–71. doi:https://doi.org/10.1080/02786826.2018.1474167.
- Chen, H., Z. Zhang, Z. Zhang, F. Jiang, and R. Du. 2018. Enhancement of filtration efficiency by electrical charges on nebulized particles. Particuology 37:81–90. doi:https://doi.org/10.1016/j.partic.2017.07.008.
- Chen, S.-C., J. Wang, H. Fissan, and D. Y. H. Pui. 2013. Use of nuclepore filters for ambient and workplace nanoparticle exposure assessment—Spherical particles. Atmos. Environ. 77:385–93. doi:https://doi.org/10.1016/j.atmosenv.2013.05.007.
- Chen, Y., N. Shah, F. E. Huggins, and G. P. Huffman. 2005. Transmission electron microscopy investigation of ultrafine coal fly ash particles. Environ. Sci. Technol. 39 (4):1144–51. doi:https://doi.org/10.1021/es049871p.
- Coquelin, L., L. L. Brusquet, N. Fischer, F. Gensdarmes, C. Motzkus, T. Macé, and G. Fleury. 2018. Uncertainty propagation using the Monte Carlo method in the measurement of airborne particle size distribution with a scanning mobility particle sizer. Meas. Sci. Technol. 29 (5):055801. doi:https://doi.org/10.1088/1361-6501/aaae87.
- Elsaesser, A., and C. V. Howard. 2012. Toxicology of nanoparticles. Adv Drug Deliv. Rev. 64 (2):129–37. doi:https://doi.org/10.1016/j.addr.2011.09.001.
- Fierz, M., D. Meier, P. Steigmeier, and H. Burtscher. 2015. Miniature nanoparticle sensors for exposure measurement and TEM sampling. J. Phys: Conf. Ser. 617:012034. doi:https://doi.org/10.1088/1742-6596/617/1/012034.
- Fonseca, A. S., E. Kuijpers, K. I. Kling, M. Levin, A. J. Koivisto, S. H. Nielsen, W. Fransman, Y. Fedutik, K. A. Jensen, and I. K. Koponen. 2018. Particle release and control of worker exposure during laboratory-scale synthesis, handling and simulated spills of manufactured nanomaterials in fume hoods. J. Nanopart. Res. 20 (2):48. doi:https://doi.org/10.1007/s11051-018-4136-3.
- Gentry, J., K. Spurny, and J. Schoermann. 1982. Diffusional deposition of ultrafine aerosols on nuclepore filters. Atmos. Environ. 16 (1):25–40. doi:https://doi.org/10.1016/0004-6981(82)90311-0.
- Givehchi, R., Q. Li, and Z. Tan. 2015. The effect of electrostatic forces on filtration efficiency of granular filters. Powder Technol. 277:135–40. doi:https://doi.org/10.1016/j.powtec.2015.01.074.
- Heim, M., B. J. Mullins, M. Wild, J. Meyer, and G. Kasper. 2005. Filtration efficiency of aerosol particles below 20 nanometers. Aerosol Sci. Technol. 39 (8):782–9. doi:https://doi.org/10.1080/02786820500227373.
- Hinds, W. C. 1999. Aerosol technology: Properties, behavior, and measurement of airborne particles. 2nd ed. New York: John Wiley & Sons.
- Innocentini, M. D. d M., J. R. Coury, M. Fukushima, and P. Colombo. 2015. High-efficiency aerosol filters based on silicon carbide foams coated with ceramic nanowires. Sep. Purif. Technol. 152:180–91. doi:https://doi.org/10.1016/j.seppur.2015.08.027.
- Jiang, J., C. J. Hogan, D.-R. Chen, and P. Biswas. 2007. Aerosol charging and capture in the nanoparticle size range (6–15 nm) by direct photoionization and diffusion mechanisms. J. Appl. Phys. 102 (3):034904. doi:https://doi.org/10.1063/1.2768061.
- Jiang, J., C. Kim, X. Wang, M. R. Stolzenburg, S. L. Kaufman, C. Qi, G. J. Sem, H. Sakurai, N. Hama, and P. H. McMurry. 2014. Aerosol charge fractions downstream of six bipolar chargers: Effects of ion source, source activity, and flowrate. Aerosol Sci. Technol. 48 (12):1207–16. doi:https://doi.org/10.1080/02786826.2014.976333.
- Jiang, J., M.-H. Lee, and P. Biswas. 2007. Model for nanoparticle charging by diffusion, direct photoionization, and thermionization mechanisms. J. Electrostat. 65 (4):209–20. doi:https://doi.org/10.1016/j.elstat.2006.07.017.
- Kim, J. H., G. W. Mulholland, S. R. Kukuck, and D. Y. Pui. 2005. Slip correction measurements of certified PSL nanoparticles using a nanometer differential mobility analyzer (nano-DMA) for Knudsen number from 0.5 to 83. J. Res. Natl. Inst. Stand. Technol. 110 (1):31–54. doi:https://doi.org/10.6028/jres.110.005.
- Ku, B. K., and A. D. Maynard. 2005. Comparing aerosol surface-area measurements of monodisperse ultrafine silver agglomerates by mobility analysis, transmission electron microscopy and diffusion charging. J. Aerosol Sci. 36 (9):1108–24. doi:https://doi.org/10.1016/j.jaerosci.2004.12.003.
- Le Bihan, O., C. Bressot, M. Dalle, L. Meunier, and O. Aguerre-Chariol. 2016. Aerosol nanostructure study with porous grids: A review. International Conference Nanosafe" Health and safety issues related to nanomaterials for a socially responsible approach, vol. 16.
- Lee, H. M., C. S. Kim, M. Shimada, and K. Okuyama. 2005. Bipolar diffusion charging for aerosol nanoparticle measurement using a soft X-ray charger. J. Aerosol Sci. 36 (7):813–29. doi:https://doi.org/10.1016/j.jaerosci.2004.10.011.
- Leith, D., D. Miller-Lionberg, G. Casuccio, T. Lersch, H. Lentz, A. Marchese, and J. Volckens. 2014. Development of a transfer function for a personal, thermophoretic nanoparticle sampler. Aerosol Sci. Technol. 48 (1):81–9. doi:https://doi.org/10.1080/02786826.2013.861593.
- Li, C., S. Liu, and Y. Zhu. 2010. Determining ultrafine particle collection efficiency in a nanometer aerosol sampler. Aerosol Sci. Technol. 44 (11):1027–41. doi:https://doi.org/10.1080/02786826.2010.508761.
- Li, M.-Z., Z.-Y. Cai, Z. Sui, and Q. Yan. 2002. Multi-point forming technology for sheet metal. J. Mater. Process. Technol. 129 (1–3):333–8. doi:https://doi.org/10.1016/S0924-0136(02)00685-4.
- Lyyränen, J., U. Backman, U. Tapper, A. Auvinen, and J. Jokiniemi. 2009. A size selective nanoparticle collection device based on diffusion and thermophoresis. J. Phys. Conf. Ser. 170:012011. doi:https://doi.org/10.1088/1742-6596/170/1/012011.
- Mamakos, A. 2016. Methodology to quantify the ratio of multiple-to single-charged fractions acquired in aerosol neutralizers. Aerosol Sci. Technol. 50 (4):363–72. doi:https://doi.org/10.1080/02786826.2016.1153034.
- Manton, M. 1978. The impaction of aerosols on a nuclepore filter. Atmos. Environ. 12 (8):1669–75. doi:https://doi.org/10.1016/0004-6981(78)90315-3.
- Manton, M. 1979. Brownian diffusion of aerosols to the face of a nuclepore filter. Atmos. Environ. 13 (4):525–31. doi:https://doi.org/10.1016/0004-6981(79)90146-X.
- Marre, S., and J. Palmeri. 2001. Theoretical study of aerosol filtration by nuclepore filters: The intermediate crossover regime of Brownian diffusion and direct interception. J. Colloid Interface Sci. 237 (2):230–8. doi:https://doi.org/10.1006/jcis.2001.7458.
- Marre, S., J. Palmeri, A. Larbot, and M. Bertrand. 2004. Modeling of submicrometer aerosol penetration through sintered granular membrane filters. J Colloid Interface Sci. 274 (1):167–82. doi:https://doi.org/10.1016/j.jcis.2004.01.003.
- Mathis, U., R. Kaegi, M. Mohr, and R. Zenobi. 2004. TEM analysis of volatile nanoparticles from particle trap equipped diesel and direct-injection spark-ignition vehicles. Atmos. Environ. 38 (26):4347–55. doi:https://doi.org/10.1016/j.atmosenv.2004.04.016.
- Maynard, A. D., Y. Ito, I. Arslan, A. T. Zimmer, N. Browning, and A. Nicholls. 2004. Examining elemental surface enrichment in ultrafine aerosol particles using analytical scanning transmission electron microscopy. Aerosol Sci. Technol. 38 (4):365–81. doi:https://doi.org/10.1080/02786820490437479.
- Miller, A., G. Frey, G. King, and C. Sunderman. 2010. A handheld electrostatic precipitator for sampling airborne particles and nanoparticles. Aerosol Sci. Technol. 44 (6):417–27. doi:https://doi.org/10.1080/02786821003692063.
- Mitchell, G., D. W. Bartlett, T. E. M. Fraser, T. R. Hawkes, D. C. Holt, J. K. Townson, and R. A. Wichert. 2001. Mesotrione: A new selective herbicide for use in maize. Pest Manag. Sci. 57 (2):120–8. doi:https://doi.org/10.1002/1526-4998(200102)57:2<120::AID-PS254>3.0.CO;2-E.
- Morgeneyer, M., O. Aguerre-Chariol, and C. Bressot. 2018. Stem imaging to characterize nanoparticle emissions and help to design nanosafer paints. Chem. Eng. Res. Des. 136:663–74. doi:https://doi.org/10.1016/j.cherd.2018.06.013.
- Ogura, I., N. Hashimoto, M. Kotake, H. Sakurai, A. Kishimoto, and K. Honda. 2014. Aerosol particle collection efficiency of Holey carbon film-coated TEM grids. Aerosol Sci. Technol. 48 (7):758–67. doi:https://doi.org/10.1080/02786826.2014.924614.
- Pich, J. 1964. Impaction of aerosol particles in the neighbourhood of a circular hole. Collect. Czech. Chem. Commun. 29 (9):2223–7. doi:https://doi.org/10.1135/cccc19642223.
- R’mili, B., C. Dutouquet, J. Sirven, O. Aguerre-Chariol, and E. Frejafon. 2011. Analysis of particle release using libs (laser-induced breakdown spectroscopy) and TEM (transmission electron microscopy) samplers when handling CNT (carbon nanotube) powders. J. Nanopart. Res. 13 (2):563–77. doi:https://doi.org/10.1007/s11051-010-0050-z.
- R’mili, B., O. L. Le Bihan, C. Dutouquet, O. Aguerre-Charriol, and E. Frejafon. 2013. Particle sampling by TEM grid filtration. Aerosol Sci. Technol. 47 (7):767–75. doi:https://doi.org/10.1080/02786826.2013.789478.
- Romo-Kröger, C. M. 1989. Measurable electrostatic effects in nuclepore filters. JAPCA. 39 (11):1465–6. doi:https://doi.org/10.1080/08940630.1989.10466642.
- Rubow, K. L. 1981. Submicron aerosol filtration characteristics of membrane filters. PhD diss., University of Minnesota.
- Sachinidou, P., Y. K. Bahk, and J. Wang. 2017. An integrative model for the filtration efficiencies in realistic tests with consideration of the filtration velocity profile and challenging particle size distribution. Aerosol Sci. Technol. 51 (2):178–87. doi:https://doi.org/10.1080/02786826.2016.1254720.
- Saltelli, A., M. Ratto, T. Andres, F. Campolongo, J. Cariboni, D. Gatelli, M. Saisana, and S. Tarantola. 2008. Global sensitivity analysis: The primer. New York: John Wiley & Sons.
- Shandilya, N., O. L. Bihan, C. Bressot, and M. Morgeneyer. 2015. Emission of titanium dioxide nanoparticles from building materials to the environment by wear and weather. Environ. Sci. Technol. 49 (4):2163–70. doi:https://doi.org/10.1021/es504710p.
- Sharma, G., N. Abuyazid, S. Dhawan, S. Kshirsagar, R. M. Sankaran, and P. Biswas. 2020. Characterization of particle charging in low-temperature, atmospheric-pressure, flow-through plasmas. J. Phys. D: Appl. Phys. 53 (24):245204. doi:https://doi.org/10.1088/1361-6463/ab7c97.
- Shatkin, J. A. 2017. Nanotechnology: Health and environmental risks. 2nd ed. London: CRC Press.
- Smith, T. N., C. R. Phillips, and O. T. Melo. 1976. Diffusive collection of aerosol particles on nuclepore membrane filter. Environ. Sci. Technol. 10 (3):274–7. doi:https://doi.org/10.1021/es60114a004.
- Sobol, I. M. 2001. Global sensitivity indices for nonlinear mathematical models and their Monte Carlo estimates. Math. Comput. Simul. 55:271–80. doi:https://doi.org/10.1016/S0378-4754(00)00270-6.
- Spurny, K., J. P. Lodge, E. R. Frank, and D. C. Sheesley. 1969. Aerosol filtration by means of nuclepore filters: Structural and filtration properties. Environ. Sci. Technol. 3 (5):453–64. doi:https://doi.org/10.1021/es60028a004.
- Tsai, C. S.-J., and D. Theisen. 2018. A sampler designed for nanoparticles and respirable particles with direct analysis feature. J. Nanopart. Res. 20 (8):209. doi:https://doi.org/10.1007/s11051-018-4307-2.
- Tsai, S.-J. C., E. Ada, J. A. Isaacs, and M. J. Ellenbecker. 2009. Airborne nanoparticle exposures associated with the manual handling of nanoalumina and nanosilver in fume hoods. J. Nanopart. Res. 11 (1):147–61. doi:https://doi.org/10.1007/s11051-008-9459-z.
- Wiedensohler, A. 1988. An approximation of the bipolar charge distribution for particles in the submicron size range. J. Aerosol Sci. 19 (3):387–9. doi:https://doi.org/10.1016/0021-8502(88)90278-9.
- Xiang, M., M. Morgeneyer, F. Philippe, M. Manokaran, and C. Bressot. 2020. Comparative review of efficiency analysis for airborne solid submicrometer particle sampling by nuclepore filters. Chem. Eng. Res. Des. 164:338–51. doi:https://doi.org/10.1016/j.cherd.2020.10.009.
- Yamamoto, N., M. Fujii, K. Kumagai, and Y. Yanagisawa. 2004. Time course shift in particle penetration characteristics through capillary pore membrane filters. J. Aerosol Sci. 35 (6):731–41. doi:https://doi.org/10.1016/j.jaerosci.2003.12.001.
- Zhao, P., and Y. Zhang. 2019. The overview of methods of nanoparticle exposure assessment. Methods Mol. Biol. 1894:353–67. doi:https://doi.org/10.1007/978-1-4939-8916-4_22.
- Zhu, M., J. Han, F. Wang, W. Shao, R. Xiong, Q. Zhang, H. Pan, Y. Yang, S. K. Samal, F. Zhang, et al. 2017. Electrospun nanofibers membranes for effective air filtration. Macromol. Mater. Eng. 302 (1):1600353. doi:https://doi.org/10.1002/mame.201600353.