
 ?Mathematical formulae have been encoded as MathML and are displayed in this HTML version using MathJax in order to improve their display. Uncheck the box to turn MathJax off. This feature requires Javascript. Click on a formula to zoom.
Abstract
Brown carbon (BrC) is an optically defined class of organic carbon (OC) which strongly absorbs light at shorter visible and ultraviolet-A (UVA) wavelengths. Both light absorbing and non-absorbing OC have been found to coat black carbon (BC) and could modulate the optical properties of BC. Thermodenuders are conventionally used in conjunction with instruments measuring particle light absorption, such as photoacoustic spectrometers, to parametrize enhanced BC light absorption (Eabs) due to OC. This method can introduce unquantified measurement artifacts because thermodenuders do not remove low-volatility compounds at the temperatures they are commonly operated at and due to temperature-dependent loss of particles within the instrument. These artifacts could lead to errors in accurately estimating Eabs for coated BC particles. The value of Eabs can also be estimated by comparing the mass absorption cross-section (MAC) of coated BC aerosol to literature-based MAC values of uncoated BC. In this study, we use two integrated photoacoustic-nephelometer spectrometers, operating at wavelengths of 375 nm and 532 nm, respectively, to quantify the differences and errors associated with measuring Eabs using these two methods. Our results indicate differences ranging from 25% to 65% for Eabs measured using both methods at 375 nm. We observed little to no enhancement at either wavelength using the thermodenuder method. In contrast, the Eabs value increased with the OC/BC ratio at 375 nm using the literature-based MAC method. The difference between the two methods was attributed to the presence of low-volatility brown carbon, and these results were corroborated using discrete dipole approximation calculations. Theoretical calculations predicted that these low-volatility OC could have values of the imaginary part of the refractive index up to 0.32 at a wavelength of 375 nm, which is in line with previous studies that found large absorption by low-volatility organics.
Copyright © 2021 American Association for Aerosol Research
EDITOR:
1. Introduction
Black carbon (BC) has been well established as a strong contributor to positive global radiative forcing (Bond et al. Citation2013; Stocker et al. Citation2013). Biomass burning is one of the leading sources of carbonaceous particulate emissions, resulting in the formation of BC particles that exist under different mixing states with inorganic and organic aerosol (OA) (Ito and Penner Citation2005; China et al. Citation2013). Solid fuel burning is an important part of biomass burning emissions and can cause global radiative forcing to change from −0.02 to 0.06 W/m2 (Kodros et al. Citation2015) depending on whether the OA emissions are considered absorbing or non-absorbing, which underscores the importance of these emissions. Non-absorbing coatings on BC aggregates increase the total amount of light absorbed by BC particles as compared to the same aggregates without coating (Schwarz et al. Citation2008; Zhang et al. Citation2008; Shiraiwa et al. Citation2010; Wang et al. Citation2014). Theoretical calculations predict that the extent of this BC light absorption enhancement (Eabs), also colloquially, but incorrectly, termed the “lensing effect”, is highly dependent on the amount of coating on the BC aggregate (Peng et al. Citation2016; Chakrabarty and Heinson Citation2018). The lensing effect is a misnomer as it implies geometric optics; however, we will occasionally refer to the light absorption enhancement induced by non-absorbing coating as the lensing effect for simplicity. While most laboratory studies have observed a coating-dependent increase in Eabs–values greater than 1 for coating mass greater than 2 times the aggregate mass (e.g., Peng et al. Citation2016; Pokhrel et al. Citation2017)–the consensus for ambient aerosols is mixed, with different studies finding a range of Eabs values (Cappa et al. Citation2012; Liu et al. Citation2015, Citation2017). The absorption by coated BC particles can also be enhanced if the coating consists of absorbing organic carbon (OC), also known as brown carbon (BrC). Numerous studies which measure Eabs at lower wavelengths report values which are a combination of BrC absorption and the lensing effect (Cappa et al. Citation2012; Lack et al. Citation2012b; Liu et al. Citation2015, Citation2017; Pokhrel et al. Citation2017). While some of these studies account for a bias due to presence of BrC, there is less effort in quantifying the errors due to nonvolatile organics.
In past studies, the value of Eabs has been estimated using instruments such as a thermodenuder in conjunction with absorption measurements such as those from a photoacoustic spectrometer (e.g., Lan et al. Citation2013; Liu et al. Citation2015; Pokhrel et al. Citation2017). Thermodenuders (TD) can facilitate measurements of Eabs by heating an aerosol stream to temperatures ranging from 150 to 300 °C to vaporize condensed phase organics, the vapors are then stripped in an activated carbon denuder section (Knox et al. Citation2009; Liu et al. Citation2015; Cappa et al. Citation2019). The resulting aerosol stream is theoretically devoid of condensed phase organics that evaporate at or below the operating temperatures of the TD. An instrument such as a photoacoustic spectrometer can be used to measure the absorption coefficient of BC aerosol particles coated with OC before and after thermodenuding which in turn can be used to provide estimates for Eabs. Thermodenuders may suffer from artifacts such as thermophoretic particle losses due to presence of large temperature gradients within the instrument, and incomplete removal of low-volatility organic compounds (Cappa et al., 2013; Stevanovic et al. Citation2015). These artifacts have led to errors and corrections in resulting measurements of aerosol absorption, which in turn affect the calculation of Eabs values (Cappa et al., 2013; Pokhrel et al. Citation2017). The high temperatures within a TD may lead to chemical changes of organic particles due to pyrolysis or charring (Swanson and Kittelson Citation2010; Sedlacek et al. Citation2018); however, charring is minimal at temperatures below 300 °C (Onasch Citation2009; Poulain et al. Citation2014). The value of Eabs can also be calculated by comparing the mass absorption cross-section (MAC) of coated BC aerosol to literature-based MAC values of uncoated BC (Liu et al. Citation2015; Peng et al. Citation2016). Researchers have to account for measurement errors in aerosol light absorption and BC mass concentration, along with inaccuracies in reference MAC values while using this technique (Peng et al. Citation2016; Xie et al. Citation2019). The MAC value for uncoated BC can be sensitive to particle size if the spherules comprising the BC aggregates have sizes greater than 80 nm (Bond et al. 2013) and should be checked to avoid using inaccurate values.
In this study, we used integrated photoacoustic-nephelometer (IPN) spectrometers to investigate the differences in Eabs due to incomplete BrC removal by a TD, calculated using two different techniques–thermodenders and reference MAC values–at a previously uninvestigated shorter wavelength of 375 nm. By combusting hardwood pellets in a forced draft cookstove, we generated BC aggregates moderately coated with OC. Based on a previous cookstove study, we did not expect significant interference from inorganic aerosol (Habib et al. Citation2008) and hence these have not been investigated in this study. The generated aerosols were passed through a TD to strip condensed phase organics, and the absorption coefficients were measured before and after thermodenuding to obtain values of Eabs. We compared measurements of Eabs obtained for thermodenuded samples to those calculated using literature-based mass absorption cross-sections of uncoated BC and explained the differences in the two techniques by using Amsterdam discrete dipole approximation (ADDA) calculations. We observed differences as high as 65% for Eabs values calculated using the two different techniques.
2. Experimental
2.1. Setup
is a schematic of the experimental setup used in this study. After the generated aerosols were allowed to rest in the burn chamber, they were sampled through a system of valves which were mechanically switched so that the instruments alternatively sampled unaltered aerosols and emissions passed through a thermodenuder (Brechtel Mfg. Inc., Model 3105). At 300 0C, the flowrates used resulted in a residence time of 20 s within the TD. Residence times were longer when the TD was operated at lower flowrates or lower temperatures.
Figure 1. A schematic of the experimental setup.
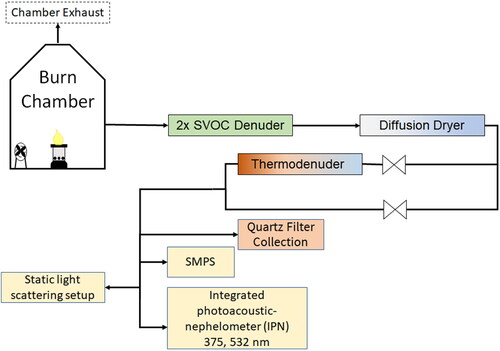
Aerosols were first passed through a diffusion drier and semi-volatile organic carbon (SVOC) denuder before being sampled by individual integrated photoacoustic-nephelometer spectrometers (IPNs) operating at wavelengths of 375 nm and 532 nm. The IPNs provided the aerosol absorption and scattering coefficients. Moisture might cause artifacts in absorption measurements with the photoacoustic technique; hence, the diffusion drier was used to remove moisture, and the SVOC denuder was used to remove gas phase organics from the aerosol stream. The single scattering albedo (SSA), which is the ratio of the scattering coefficient to the sum of the absorption and scattering coefficients, was calculated using data from the IPNs. The particles were also sampled upstream and downstream of the thermodenuder by a scanning mobility particle sizer (SMPS, TSI Inc.) to characterize the change in particle size distribution post-thermodenuding. A static light scattering setup manufactured in our laboratory was used to monitor the bulk shape of the particles. Details of the instrument can be found in Heinson, Sorensen, and Chakrabarty (Citation2019). Finally, the aerosols were passed through a filter sampler and collected on quartz-fiber filters (Pallflex Tissuquartz, 47 mm diameter), which were then used to assess the elemental carbon (EC) and organic carbon (OC) composition of the aerosol via a thermal/optical reflectance (TOR) analysis with the Interagency Monitoring of Protected Visual Environments (IMPROVE)-A temperature protocol (Chow et al. Citation2007). EC is well correlated with BC and can be used as a relatively good substitute for BC concentrations (Clarke et al. Citation2004; Salako et al. Citation2012). Consequently, we use EC mass as a surrogate for BC mass throughout this article. The OC/BC ratio ranged from 0.5 to 1.4, which corresponds to OA/BC ratios of 0.8 to 2.3 (using OA/OC ratio of 1.6 (Turpin and Lim Citation2001)), indicating that the particles were lightly coated, which was confirmed with TEM images (). The particle concentration within the chamber remained stable throughout the duration of an experiment: The initial particle concentration decreased by less than 10% over the course of an experiment.
2.2. Aerosol generation
Coated BC particles were generated in a sealed 21-m3 stainless-steel combustion chamber. Hardwood pellets (Camp Chef Smoke Pro) containing a blend of maple, hickory, and cherry wood were used as fuel in a gasification-based forced draft cookstove to generate the coated soot particles for this study. A detailed description of the design and working principle of this cookstove is presented in (Patel et al. Citation2016). Briefly, the cookstove consists of two concentric hollow cylinders. The inner cylinder contains the fuel, and air is forced through the biomass bed by a fan at the bottom. The forced draft increases flaming, efficiently combusting the fuel. While some previous studies have quantified Eabs using graphite and nigrosine as substitutes for BC (e.g., Shiraiwa et al. Citation2010; Radney and Zangmeister Citation2015), we studied aerosols generated from cookstoves because the absorption properties of their emissions were reproducible, and the emissions simulated the products of realistic burns similar to other laboratory-based experiments which investigated flame-derived BC (e.g., Cappa et al. Citation2012; Peng et al. Citation2016). For each experiment, 300 grams of hardwood wood pellets were doused with 15 mL of kerosene to aid ignition. The subsequent flaming lasted for about 15 min, followed by a smoldering phase close to 3 min. The relatively short duration of the smoldering phase yielded BC aggregates which were lightly coated with organics (). More than 90% of the fuel mass was depleted in combustion and only ash remained after each burn. The generated aerosols were allowed to rest within the chamber for an hour after the flames had finished burning, after which they were characterized by a suite of optical and physical instruments.
2.3. Instrument description
2.3.1. Integrated photoacoustic-nephelometer spectrometer
Photoacoustic spectrometry and nephelometry have been widely applied to measure aerosol light absorption and scattering coefficients respectively, and their working principle has been well documented (Anderson and Ogren Citation1998; Moosmüller, Chakrabarty, and Arnott Citation2009; Chakrabarty et al. Citation2010). In this study, we used single-wavelength integrated photoacoustic-nephelometer (IPN) spectrometers based on our own design operating at 375 nm and 532 nm. The photoacoustic component was designed based on Arnott et al. (Citation1999) and the nephelometer design is similar to Abu-Rahmah, Arnott, and Moosmüller (Citation2006). The extinction coefficient was calculated using the Beer-Lambert Law by measuring the change in laser power as aerosol was passed through the system, and was only used for instrument calibration. A detailed description of the working of the instrument is presented in Sumlin et al. (Citation2017). The nephelometer was calibrated using NaCl aerosol and the photoacoustic spectrometer was calibrated using kerosene soot. Scattering calibration factors were determined using the slope of a linear regression of scattering versus extinction coefficient for salt aerosol, and the absorption calibration factor was determined using the slope of absorption coefficient versus extinction-scattering coefficients for kerosene soot.
Measurements were acquired every 2 s, and the instrument would subtract background signal after every 300 data points. For measuring background absorption, the sample was passed through a HEPA filter to remove particles, and the corresponding particle-free measurement was used to determine instrument background noise. Since the HEPA filter is ineffective in removing gas phase species such as NO2, any interference due to gas phase absorption is neglected in our measurements.
2.3.2. Thermodenuder
The thermodenuder is an instrument used to evaporate and remove semi-volatile compounds from aerosols. We used a recently developed thermodenuder (Model 3105) by Brechtel Mfg. Inc. for this study. The thermodenuder can be divided into three zones: 1) heating zone, 2) residence zone, and 3) denuder zone. The sample first enters the heating stage where two heating elements bring the sample to the set point temperature. The temperature for evaporation could be set anywhere between ambient and 300 0C. The heaters are controlled using thermistor and control software to ensure that the sample reaches the set point temperature. The temperature is maintained through the residence zone, and compounds volatile at that temperature transfer to the gaseous phase. Following the residence zone, the sample enters the denuder stage, and the flow is cooled down to ambient. As the sample is being cooled, the hot gaseous molecules of volatile compounds diffuse toward the colder walls which are lined with activated carbon and in the process are removed from the aerosol flow.
2.3.3. Static light scattering setup
The shape of aerosol particles can be determined using a technique known as Q-space analysis. The technique for Q-space analysis is detailed in Heinson et al. (Citation2016). Briefly, Q-space analysis refers to the use of q (the magnitude of the scattering wave vector):
(1)
(1)
where a = 2π/λ with λ being the wavelength of light, and θ is the scattering angle. Instead of plotting the scattered intensity vs. θ on a log-linear scale, Q-space analysis graphs scattered intensity vs. q on a log-log scale. The slope of the decrease in the curve provides the fractal dimension of the particle assembly. The angular measurements for particle scattering were performed using a static light scattering setup which was developed in our laboratory, the details of the design and workings are presented in Heinson, Sorensen, and Chakrabarty (Citation2019). An incident beam at a wavelength of 532 nm is used to illuminate the aerosol sample flowing out of a ¼” diameter copper tube. The scattered light is collected by two 512 channel detectors. The design helps capture light scattered at angles from 0.7° to 162°. The angular scattering intensity is then analyzed using Q-space analysis to obtain the fractal dimension of the particles which in turn provides information on the shape of the particles. in the online supplementary information (SI) shows the results of the Q-space analysis where we did not see any change in particle shape post-thermodenuding.
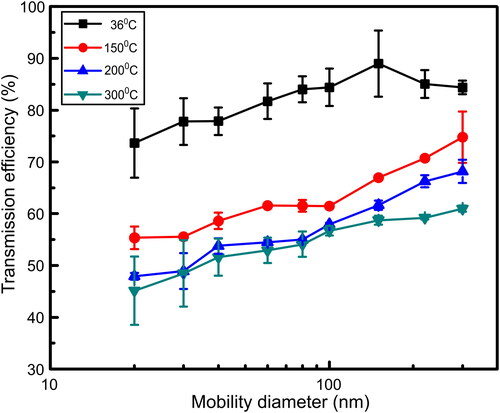
Figure 2. Transmission efficiencies of particles as a function of the mobility size for different operating temperatures of the thermodenuder.
3. Error quantification and analysis techniques
3.1. Particle loss in thermodenuder
Particle losses in the thermodenuder were measured in two sets of experiments. Soot and NaCl salt aerosols were used for the experiments to avoid particle size changes due to evaporation. In the first set, size-dependent transmission efficiencies were measured at 36 °C and 300 °C, using monodisperse fullerene soot that was size-selected by a scanning electrical mobility sizer (SEMS Model 2100, Brechtel Mfg. Inc.). Particle concentrations upstream and downstream of the thermodenuder were measured using mixing condensation particle counters (MCPC Model 1720, Brechtel Mfg. Inc.). Tubing lengths to each of the MCPCs were chosen such that diffusion losses within the tubing were equal for both MCPCs, therefore any differences in observed concentrations were considered to be due to losses in the thermodenuder alone. The second set of experiments was conducted using NaCl particles at temperatures of 36 °C, 150 °C, 200 °C and 300 °C. The aerosol was passed through a diffusion dryer to remove excess moisture. Monodisperse NaCl particles were selected using a differential mobility analyzer (DMA Model 3082, TSI Inc.) and the particle concentrations were measured using a condensation particle counter (CPC Model 3787, TSI Inc.) upstream and downstream of the thermodenuder. Multiple charging of particles might complicate these measurements as larger particles are selected at lower mobility sizes. Thermophoretic losses are lower for larger particles, so multiple charging might lead to an over-estimation of the transmission efficiency.
shows the particle loss for sizes ranging from 20 nm to 300 nm, measured at four operating temperatures. The results are averages from both NaCl and soot studies at common operating temperatures. Results from both sets of experiments were within 3% at larger sizes and had differences of less than 10% for sizes smaller than 100 nm. Experiments indicated that at 36 0C, the transmission efficiency increased from about 74% for 20 nm diameter particles to 84% for 300 nm particles. The transmission efficiencies at 300 °C shown in the figure are lower by between 20 and 30% than the results at 36 °C. Transmission efficiencies at 150 and 200 °C were lower than those at 36 °C and slightly larger than transmission efficiencies at 300 °C, indicating that the decrease with temperature is likely a result of thermophoretic losses at higher temperatures. It is important to note that size-dependent thermophoretic losses within a thermodenuder are expected to be highly dependent on the details of the design and magnitude of thermal gradients. Therefore, the losses shown here should not be extrapolated to other thermodenuder designs. The overall transmission efficiencies from SMPS measurements are presented in Table S1 in the SI.
3.2. Absorption enhancement calculation
The absorption enhancement (Eabs) is defined here as the ratio of the BC mass absorption cross-section (MACBC) of particles with coating compared to the MACBC of uncoated BC. Here MACBC is the ratio of the absorption coefficient of the aerosols to their BC mass concentration. We used two widely used methods to estimate coating-induced absorption enhancement. First, we calculated the MACBC for coated aerosol emissions and compared them to the MACBC values of aerosols passed through the thermodenuder. The absorption enhancement measured using the thermodenuder technique (Eabs,TD) was calculated as below:
(2)
(2)
where MACBC,coated(λ) is the MACBC value for unaltered aerosol samples at a particular wavelength and MACBC,denuded(λ) is the MACBC value for denuded aerosol samples at the same wavelength. Then, using another common technique, we measured the light absorption enhancement by comparing the MACBC of the unaltered aerosol samples to reference values for the MACBC of bare uncoated BC aggregates:
(3)
(3)
where MACBC,ref, obtained from the literature, is 7.5 ± 1.2 m2/g at 550 nm (Bond et al. 2013). The MACBC,ref value at 550 nm was extrapolated to lower wavelengths using an absorption angstrom exponent of −1 (Bond et al. 2013). The values for MACBC,ref can have a large range of values (Schnaiter et al. Citation2003; Liu et al. Citation2020), and errors in MACBC,ref might lead to subsequent errors in the estimation of Eabs,ref. We discuss the possible implications of these errors in the Section 4.3. Another way to evaluate reference MACBC values is to plot MACBC as a function of the amount of coating to the BC mass ratio and extrapolating MACBC to limit values for particles with no coating (Liu et al. Citation2015; Cappa et al. Citation2019). Because exact mixing state information was not available for this study, we used reference values to evaluate MACBC,ref.
3.3. Discrete dipole approximation
Discrete dipole approximation calculations were performed on simulated aggregates to estimate the effect of absorbing coating on measurements of Eabs. BC aggregates were simulated using diffusion limited cluster-cluster aggregation (DLCA). The diameter of spherical monomers for the uncoated BC aggregates was fixed at 40 nm (Bond and Bergstrom Citation2006) and the mobility diameter of the aggregates ranged from 300 to 430 nm which was the maximum range for mean mobility diameters observed in this study. After the clusters were generated, they were broken into sub-volumes arranged in a cubic lattice, where each monomer comprised 5,737 sub-volumes. This process created a large cubic lattice with a fraction of the lattice positions occupied by the aggregate. Coating of the aggregate was then simulated by randomly filling empty lattice positions located along the surface of the particle with OA coating material. The coating process was repeated until a desired amount of OA was applied. The amount of coating was quantified by the mass ratio of the coated aggregate to the BC core (Mtot/MBC). In this study, the material densities of BC and OA coating material were assumed to be 1.8 g/cm3 and 1.2 g/cm3, respectively (Turpin and Lim Citation2001; Bond et al. 2013).
The optical properties of the generated aggregates were calculated using the ADDA 1.3b4 algorithm (Yurkin and Hoekstra Citation2011). Breaking down each aggregate into small sub-volumes allows each sub-volume to be treated as an individual scattering volume that interacts with surrounding sub-volumes (Yurkin and Hoekstra Citation2011). The accuracy of ADDA is dependent on the size of the sub-volume compared to the wavelength of the incident light. Each sub-volume has a dipole associated with it, and the dipole resolution is defined as the wavelength of the incident light divided by the size of a dipole. The resolution for this study ranged from 138-165 dipoles per wavelength, which is consistent with the ADDA recommendation of at least 10 dipoles per wavelength (Yurkin and Hoekstra Citation2011). The refractive index (RI) used for the BC core was m = 1.95 + 0.79i (Bond et al. 2013). The RI used for BrC coating had a real part that was fixed at 1.55 (Bond and Bergstrom Citation2006). The complex part of the BrC RI (k) was varied to estimate the sensitivity of Eabs to the coating’s RI. The value of Eabs was calculated as follows:
(4)
(4)
where Cabs,coated is the absorption cross-section for an individual BC particle with a BrC coating, and Cabs,uncoated is the absorption cross-section for the corresponding uncoated BC particle. The absorption by the BrC shell was calculated by a technique similar to that used in Lack and Cappa (Citation2010). The absorption cross-section of an aggregate with a morphology similar to that of the coated aggregate, but with the core and coating RI values identical to that of BrC, was calculated to give Cabs,BrC_coated. The absorption cross-section of an equivalent uncoated core was found by using an RI value equal to that of BrC (Cabs,BrC_core). The value of Cabs,BrC_core was subtracted from Cabs,BrC_coated to give the absorption cross-section of the BrC shell (Cabs,BrC_shell). The absorption cross-section of just the BC core for a BrC coated aggregate (Cabs,BC_lensing) was calculated as
(5)
(5)
The light absorption enhancement of the BC core attributed to the presence of coating (Eabs,lensing) was determined by dividing Cabs,BC_lensing by the absorption cross-section of the BC aggregate with no coating.
4. Results
4.1. Size distribution measurements
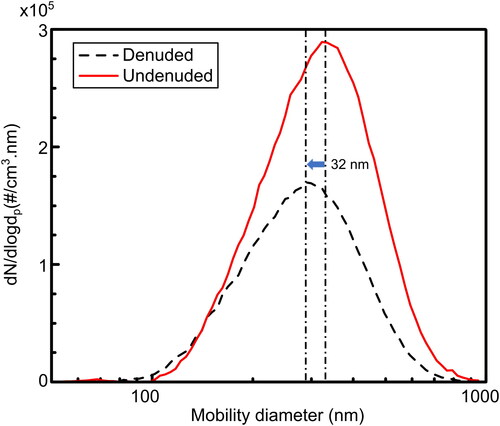
depicts a typical size distribution measured during the combustion experiments. The denuded emissions in had size distributions with mean particle diameter lower than those of the unaltered emissions, which would result from a net removal of coating material from the generated aggregates. All denuded size distributions had mean particle diameters smaller than the unaltered emissions; however, the largest decrease in mean mobility diameter was close to 80 nm. This decrease in mean mobility diameter is small compared to the typical coating thickness observed for biomass burning emissions (Liu et al. Citation2015, Citation2017). This suggests that the generated BC particles were lightly coated with OA, which was also confirmed by the low OA/BC ratios for the aerosols. A decrease in the mobility diameter could be expected due to compaction of particle post-thermodenuding, however, the shape of the particles was monitored using a static light scattering setup, and the results indicated no change in the shape of aggregates after OC was volatilized. The results from the static light scattering setup are depicted in . The absence of a smaller nucleation peak in the denuded size distributions also negates the possibility of any new particle formation in the thermodenuder.
Figure 3. Size distribution of undenuded (red solid line) and denuded (black dashed line) particles in one set of experiments. The perforated lines represent the mode of each distribution, which decreased by 32 nm post-thermodenuding.
4.2. Change in single scattering albedo
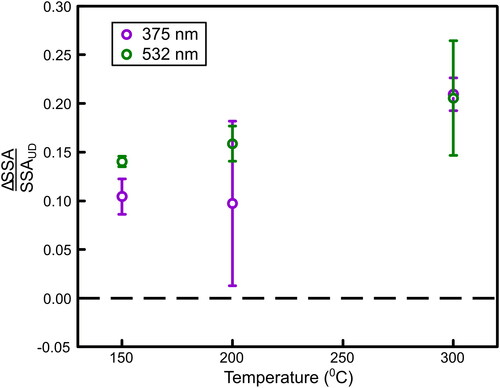
Removal of OC was additionally monitored by observing changes in the SSA of the aerosols. We calculated the change in the SSA of the aerosol stream post thermodenuding and normalized it with the SSA of undenuded aerosols, calculated as below:
(6)
(6)
where SSAUD is the SSA of undenuded aerosols, and SSAD is the SSA of the denuded aerosol stream. A ΔSSA/SSAUD value greater than zero indicates that thermodenuding the aerosols decreased the scattering coefficient more than the absorption coefficient, while a negative value indicates the inverse. depicts changes in ΔSSA/SSAUD as a function of operation temperatures for the thermodenuder. The error bars denote two standard deviations in ΔSSA/SSAUD at each temperature. The value of ΔSSA/SSAUD was always greater than zero, indicating a larger decrease in scattering relative to absorption for denuded particles. The value of ΔSSA/SSAUD increased with increasing temperature, suggesting an increasing decrease in scattering relative to absorption which is likely due to larger removal of organic material at higher temperatures. For the undenuded aerosols, the SSA values ranged from 0.29 to 0.44 at 375 nm and from 0.41 to 0.65 at 532 nm. The SSA values decreased after the aerosols were thermodenuded and ranged from 0.23 to 0.38 at 375 nm and 0.35 to 0.55 at 532 nm. While previous studies have observed a correlation between SSA and OC/BC ratios (Pokhrel et al. Citation2016; Shetty et al. Citation2019), we observed no strong relationship between the two parameters. The parametrizations established in the cited studies are less reliable at both extremes of high and low OC/BC ratios. We observed that our samples could not provide a dynamic enough range of SSA and OC/BC values to discern any correlation between these parameters and have consequently not explored this relationship in this study. Operating temperatures reached up to 300 0C, and because charring is minimal at these temperatures (Onasch Citation2009; Poulain et al. Citation2014), the change in SSA would be due to a decrease in OA and not an overestimation from BC formation due to charring.
Figure 4. Change in ΔSSA/SSAUD at 375 nm (blue circles) and 532 nm (green circles) as a function of thermodenuder operating temperatures. The error bars represent two standard deviations from experiments at each temperature.
4.3. Technique-dependent biases in Eabs measurement
presents experimental values of Eabs,TD as a function of the operating temperature of the thermodenuder. Across all temperatures investigated in this study, the Eabs value ranged from 1.02 ± 0.18 to 1.11 ± 0.04 at 375 nm and 0.9 ± 0.15 to 1.02 ± 0.13 at 532 nm. The value of Eabs,TD at 532 nm was slightly lower than 1, which could be attributed to measurement uncertainties. The values for Eabs,TD at 375 nm were slightly larger than those at 532 nm, but the differences between the two values were within the measurement uncertainty and we could not make definite conclusions about the differences.
Figure 5. (a) Measured values of Eabs,TD at 375 nm and 532 nm as a function of the operating temperature of the thermodenuder. The shaded region indicates the range of variability in experiments at each temperature. (b) Measurements of Eabs,ref as a function of the OA/BC mass ratio of the aerosol. The error bars represent uncertainties in IPN and TOR measurements as well as variability in MACBC,ref values.
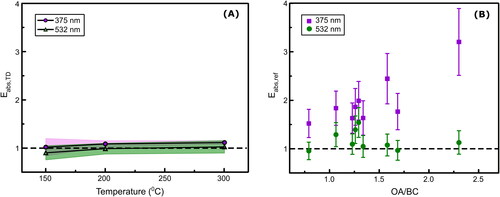
The Eabs,TD values close to unity indicate the absence of large coating-induced enhancement for lightly coated BC aggregates, similar to observation in other studies using a thermodenuder (Cappa et al. Citation2012; Nakayama et al. Citation2014; Healy et al. Citation2015). This indication is in contrast to various theoretical studies which predict light absorption enhancements greater than 1 for even lightly coated BC particles (Chakrabarty and Heinson Citation2018; Luo et al. Citation2018). The difference between experimental and theoretical values of Eabs highlights a discrepancy. Theoretical studies have attributed low values of observed Eabs to internal particle morphology (Adachi and Buseck Citation2013; Zhang et al. Citation2018) and uneven distribution of coating material across a population of BC particles (Fierce et al. Citation2016). But to the author’s knowledge, there have been very few experiments specifically designed to investigate these theoretical hypotheses (Fierce et al. Citation2020).
We also calculated light absorption enhancement by measuring MACBC for undenuded emissions and comparing them to MACBC,ref values. depicts Eabs,ref as a function of the OA/BC ratios determined from the TOR analysis at wavelengths of 375 nm and 532 nm. We observed an increase in Eabs,ref from 1.5 ± 0.3 to 3.2 ± 0.7 for OA/BC ratios from 0.8 to 2.3 at 375 nm and in the same range of OA/BC mass ratios, Eabs,ref values were close to 1 within uncertainty at 532 nm. This increase in Eabs,ref with OA/BC ratios, along with larger values at shorter wavelengths, has been observed in other studies as well (Lack et al. Citation2012a; McMeeking et al. Citation2014; Liu et al. Citation2015, Citation2017; Pokhrel et al. Citation2017). An increase in OA/BC ratios would lead to increasing amounts of OC coating on BC particles, which is expected to lead to greater light absorption due to the lensing effect. Larger OA/BC ratios could also lead to greater BrC absorption at lower wavelengths, which would also be detected as Eabs in experiments. It is worth noting that at lower wavelengths, even an external mixture of BrC can lead to an Eabs value greater than 1. However, we do not expect a large amount of externally mixed OA for our samples based on our size distribution and transmission efficiency measurements (). Additionally, the assumption of an inverse wavelength dependence might not hold true at 375 nm affecting the estimates of Eabs,MAC. If the absorption exponent is greater than unity, the current method would overestimate Eabs,MAC and vice versa for an absorption exponent less than 1. Most studies do not report Eabs or uncoated MACBC values at 375 nm and the studies that report Eabs values in the near-UV wavelength range tend to have values lower than those reported in this study at similar OA/BC ratios (Liu et al. Citation2015, Citation2017; Peng et al. Citation2016; Chakrabarty and Heinson Citation2018). The cited studies have either non-absorbing or weakly absorbing coatings which could be the reason for the lower values. At OC coating amounts comparable to those observed in this study, a theoretical study by Luo et al. (Citation2018) which assumes the imaginary part of the BrC refractive index to be 0.168 predicts Eabs values above 3 which are close to the values obtained in this study. The value of Eabs,ref at 532 nm is close to unity, with an average value of 1.17 ± 0.19, indicating little to no light absorption enhancement by lensing.
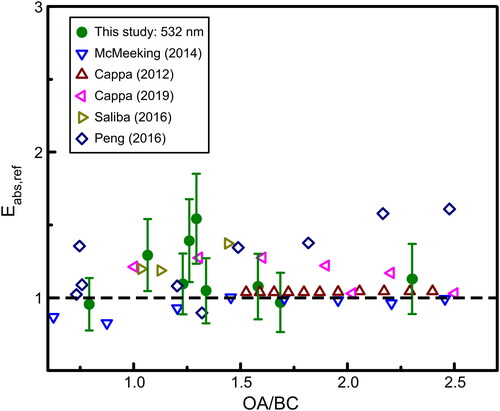
presents our results along with measurements from various other laboratory and field-based studies. Our results at 532 nm are consistent with the findings of Cappa et al. (Citation2012), McMeeking et al. (Citation2014), Peng et al. (Citation2016), Saliba et al. (Citation2016), and Cappa et al. (Citation2019) at corresponding values of the OA/BC mass ratios. The negligible contribution of lensing-based enhancement at 532 nm and the wavelength independent nature of Eabs (Chakrabarty and Heinson Citation2018) suggest that the large values of Eabs,ref at 375 nm would be due to BrC absorption, and due to incomplete removal of organics from the aerosol stream these values of Eabs,ref would be larger than Eabs,TD. These findings are consistent with the observations by Liu et al. (Citation2015) and Cappa et al. (Citation2019) which observed larger values for Eabs,ref compared to Eabs,TD.
Figure 6. Compilation of absorption enhancement values at 532 nm from multiple studies superimposed on data obtained in this study at 532 nm. The low value of absorption enhancement at 532 nm indicates an absence of Eabs due to the lensing effect at OA/BC ratios lower than 3. The large Eabs values at 375 nm would thus be a result of BrC absorption at that wavelength.
TOR analysis of quartz filters collected from unaltered and denuded samples showed that a thermodenuder operating temperature of 300 °C was insufficient at removing all OC. A plot depicting the change in OC/BC ratios as a function of the temperature is provided in the SI (). At temperatures below 300 °C, we observed lower OC/EC ratios for the undenuded samples as compared to the denuded samples, even though the individual EC and OC concentrations decreased post thermodenuding. This could be due to an overestimation of EC with the IMPROVE-A temperature protocol for the undenuded samples (Subramanian et al. Citation2004; Subramanian, Khlystov, and Robinson Citation2006). The overestimation occurs predominantly in wood smoke and occurs when non-light absorbing carbon evolves after the OC/EC split during analysis (Subramanian, Khlystov, and Robinson Citation2006). It is important to note that these artifacts might bias our Eabs measurements to slightly lower values.
Organics not stripped at 300 °C are considered to have extremely low volatility, similar to the low-volatility OC with a large imaginary part of the refractive index (k) observed in Saleh et al. (Citation2014) and Saleh, Cheng, and Atwi (Citation2018). We hypothesize that the difference in Eabs obtained using the two different methods -reference values and thermodenuder- could be attributed to the incomplete removal of highly absorbing OC coating from the BC aggregates. This hypothesis was tested by running ADDA calculations on simulated aggregates with the varying coating amounts observed in this study. The results of the ADDA calculations are presented in Section 4.4.
4.4. Validation of observed biases using ADDA
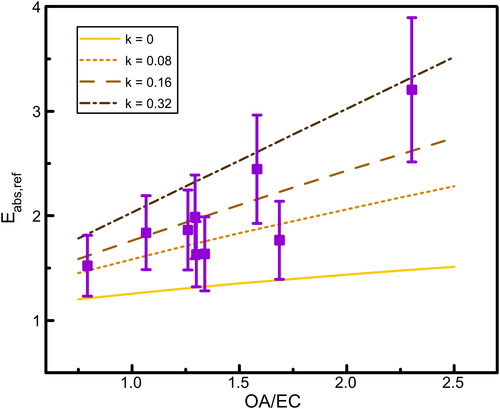
For the range of OA coatings observed in this study, shows the best-fit line for Eabs calculated with varying k values of the coating RI. The ADDA calculations were performed at a wavelength of 375 nm, and the results of the calculations were superimposed on measured Eabs,ref values at the corresponding wavelength. The individual data points from the calculations, along with the equations for the best-fit lines, are reported in the SI (). The values of Eabs reported here are for the entire particle and not just the enhancement due to the lensing effect, because Eabs,ref would include absorption due to BrC as well. It is informative to look at the total enhancement of the particle rather than just the enhancement due to the lensing effect, because BrC coating material from biomass combustion absorbs light at lower wavelengths and contributes to increasing the value of Eabs. We calculated the root mean square errors (RMSE) for the different curves, which indicated that a k value of zero was least representative for the observed data and k = 0.16 had the lowest RMSE value at 375 nm. The ADDA calculations suggest that a range of k values exist for the observed samples ranging up to 0.32. These calculated k values are comparable to those of the highly absorbing low-volatility BrC observed in other studies (Kirchstetter, Novakov, and Hobbs Citation2004; Saleh et al. Citation2014; Saleh, Cheng, and Atwi Citation2018). It is important to note that the increase in k values of the coating RI predicted a decrease in contribution of Eabs due to lensing. The results for Eabs due to lensing are presented in the SI (). The presence of OC in the denuded samples, as well as the large difference between the Eabs,ref and Eabs,TD values, indicates that the aerosol contains extremely low-volatility organic compounds (ELVOCs) in the condensed phase. These ELVOCs have large values of k, as observed in . These findings are consistent with other studies which observe larger values of Eabs,ref than Eabs,TD and our findings are in line with other studies which suggest that the difference is due to the presence of highly absorbing ELVOCs (Liu et al. Citation2015; Zhang et al. Citation2016; Cappa et al. Citation2019).
Figure 7. The best-fit lines from the ADDA calculation superimposed on Eabs,ref values as a function of the OA/BC ratios for different aerosols at 375 nm. The best-fit lines were estimated from the ADDA calculations, using different values of k for the refractive index of the coating material.
5. Conclusions
The findings from this study indicate that at lower wavelengths, large errors can occur while estimating Eabs for BC particles with even small amounts of low-volatility BrC coatings, less than three times the BC mass. The findings further suggest that values of Eabs reported from measurements using a thermodenuder at lower wavelengths could be largely underestimated. This artifact could partly be responsible for the low values of Eabs reported in most studies that use a thermodenuder (McMeeking et al. Citation2014; Healy et al. Citation2015; Cappa et al. Citation2019). The results presented here demonstrate that care must be taken in interpreting results from thermodenuder studies of Eabs on particles with low-volatility BrC coatings, specifically at lower wavelengths. Based on our ADDA calculations, these low-volatility organics could have k values up to 0.32. While our calculations indicate that BrC coating can decrease BC light absorption enhancement due to the lensing effect, it also increases the total absorption by coated BC particles, and the Eabs for the whole particle is what is reported in most studies. We recommend that future research reporting Eabs from thermodenuder measurements be cognizant of the magnitude of underestimation in Eabs that might result from the contribution of low-volatility organics to absorption, specifically at lower wavelengths. Studies have shown that absorbing OC can exist with properties intermediate between black and brown carbon (Saleh, Cheng, and Atwi Citation2018; Adler et al. Citation2019) and the absorption by such OC can be significant at larger wavelengths as well (Kirchstetter, Novakov, and Hobbs Citation2004; Alexander, Crozier, and Anderson Citation2008; Hoffer et al. Citation2017). The presence of these low-volatility BrC could complicate thermodenuder measurements of Eabs further as they absorb light at longer wavelengths, making it harder to differentiate between Eabs due to lensing and OC absorption. While this study reports measurements for BC with moderate amounts of OC coating, future studies could examine the effects of large amounts of low-volatility OC coatings on BC light absorption enhancement.
Supplemental Material
Download MS Word (408.4 KB)Acknowledgments
The authors thank Wei Min Hao and Stephen Baker for assisting with the TOR analysis of samples.
Additional information
Funding
References
- Abu-Rahmah, A., W. Arnott, and H. Moosmüller. 2006. Integrating nephelometer with a low truncation angle and an extended calibration scheme. Meas. Sci. Technol. 17 (7):1723–32. doi:https://doi.org/10.1088/0957-0233/17/7/010.
- Adachi, K., and P. R. Buseck. 2013. Changes of ns‐soot mixing states and shapes in an urban area during CalNex. J. Geophys. Res. Atmos. 118 (9):3723–30. doi:https://doi.org/10.1002/jgrd.50321.
- Adler, G., N. L. Wagner, K. D. Lamb, K. M. Manfred, J. P. Schwarz, A. Franchin, A. M. Middlebrook, R. A. Washenfelder, C. C. Womack, R. J. Yokelson, et al. 2019. Evidence in biomass burning smoke for a light-absorbing aerosol with properties intermediate between brown and black carbon. Aerosol Sci. Technol. 53 (9):976–89. doi:https://doi.org/10.1080/02786826.2019.1617832.
- Alexander, D. T., P. A. Crozier, and J. R. Anderson. 2008. Brown carbon spheres in East Asian outflow and their optical properties. Science 321 (5890):833–6. doi:https://doi.org/10.1126/science.1155296.
- Anderson, T. L., and J. A. Ogren. 1998. Determining aerosol radiative properties using the TSI 3563 integrating nephelometer. Aerosol Sci. Technol. 29 (1):57–69. doi:https://doi.org/10.1080/02786829808965551.
- Arnott, W. P., H. Moosmüller, C. F. Rogers, T. Jin, and R. Bruch. 1999. Photoacoustic spectrometer for measuring light absorption by aerosol: instrument description. Atmos. Environ. 33 (17):2845–52. doi:https://doi.org/10.1016/S1352-2310(98)00361-6.
- Bond, T. C., and R. W. Bergstrom. 2006. Light absorption by carbonaceous particles: An investigative review. Aerosol Sci. Technol. 40 (1):27–67. doi:https://doi.org/10.1080/02786820500421521.
- Bond, T. C., S. J. Doherty, D. W. Fahey, P. M. Forster, T. Berntsen, B. J. DeAngelo, M. G. Flanner, S. Ghan, B. Kärcher, D. Koch, et al. 2013. Bounding the role of black carbon in the climate system: A scientific assessment. J. Geophys. Res. Atmos. 118 (11):5380–552. doi:https://doi.org/10.1002/jgrd.50171.
- Cappa, C. D., T. B. Onasch, P. Massoli, D. R. Worsnop, T. S. Bates, E. S. Cross, P. Davidovits, J. Hakala, K. L. Hayden, B. T. Jobson, et al. 2012. Radiative absorption enhancements due to the mixing state of atmospheric black carbon. Science 337 (6098):1078–81. doi:https://doi.org/10.1126/science.1223447.
- Cappa, C. D., T. B. Onasch, P. Massoli, D. R. Worsnop, T. S. Bates, E. S. Cross, P. Davidovits, J. Hakala, K. L. Hayden, B. T. Jobson, et al. 2013. Response to comment on "radiative absorption enhancements due to the mixing state of atmospheric black carbon". Science 339 (6118):393. doi:https://doi.org/10.1126/science.1230260.,
- Cappa, C. D., X. Zhang, L. M. Russell, S. Collier, A. K. Y. Lee, C.-L. Chen, R. Betha, S. Chen, J. Liu, D. J. Price, et al. 2019. Light absorption by ambient black and brown carbon and its dependence on black carbon coating state for two California, USA, cities in winter and summer. J. Geophys. Res. Atmos. 124 (3):1550–77. doi:https://doi.org/10.1029/2018JD029501.
- Chakrabarty, R., H. Moosmüller, L.-W. Chen, K. Lewis, W. Arnott, C. Mazzoleni, M. Dubey, C. Wold, W. Hao, and S. Kreidenweis. 2010. Brown carbon in tar balls from smoldering biomass combustion. Atmos. Chem. Phys. 10 (13):6363–70. doi:https://doi.org/10.5194/acp-10-6363-2010.
- Chakrabarty, R. K., and W. R. Heinson. 2018. Scaling laws for Light Absorption by Atmospheric Black Carbon Aerosol, arXiv preprint arXiv:1805.11218.
- China, S., C. Mazzoleni, K. Gorkowski, A. C. Aiken, and M. K. Dubey. 2013. Morphology and mixing state of individual freshly emitted wildfire carbonaceous particles. Nat. Commun. 4:2122. doi:https://doi.org/10.1038/ncomms3122.
- Chow, J. C., J. G. Watson, L.-W. A. Chen, M. O. Chang, N. F. Robinson, D. Trimble, and S. Kohl. 2007. The IMPROVE_A temperature protocol for thermal/optical carbon analysis: maintaining consistency with a long-term database. J. Air Waste Manag. Assoc. 57 (9):1014–23. doi:https://doi.org/10.3155/1047-3289.57.9.1014.
- Clarke, A., Y. Shinozuka, V. Kapustin, S. Howell, B. Huebert, S. Doherty, T. Anderson, D. Covert, J. Anderson, and X. Hua. 2004. Size distributions and mixtures of dust and black carbon aerosol in Asian outflow: physiochemistry and optical properties. J. Geophys. Res. 109 (D15):D15S09. doi:https://doi.org/10.1029/2003JD004378.
- Fierce, L., T. C. Bond, S. E. Bauer, F. Mena, and N. Riemer. 2016. Black carbon absorption at the global scale is affected by particle-scale diversity in composition. Nat. Commun. 7:12361. doi:https://doi.org/10.1038/ncomms12361.
- Fierce, L., T. B. Onasch, C. D. Cappa, C. Mazzoleni, S. China, J. Bhandari, P. Davidovits, D. A. Fischer, T. Helgestad, A. T. Lambe, et al. 2020. Radiative absorption enhancements by black carbon controlled by particle-to-particle heterogeneity in composition. Proc. Natl. Acad. Sci. USA. 117 (10):5196–203. doi:https://doi.org/10.1073/pnas.1919723117.
- Habib, G., C. Venkataraman, T. C. Bond, and J. J. Schauer. 2008. Chemical, microphysical and optical properties of primary particles from the combustion of biomass fuels. Environ. Sci. Technol. 42 (23):8829–34. doi:https://doi.org/10.1021/es800943f.
- Healy, R. M., J. M. Wang, C.-H. Jeong, A. K. Y. Lee, M. D. Willis, E. Jaroudi, N. Zimmerman, N. Hilker, M. Murphy, S. Eckhardt, et al. 2015. Light‐absorbing properties of ambient black carbon and brown carbon from fossil fuel and biomass burning sources. J. Geophys. Res. Atmos. 120 (13):6619–33. doi:https://doi.org/10.1002/2015JD023382.
- Heinson, Y. W., J. B. Maughan, W. R. Heinson, A. Chakrabarti, and C. M. Sorensen. 2016. Light scattering Q‐space analysis of irregularly shaped particles. J. Geophys. Res. Atmos. 121 (2):682–91. doi:https://doi.org/10.1002/2015JD024171.
- Heinson, Y. W., C. M. Sorensen, and R. K. Chakrabarty. 2019. Portable device to determine particle asymmetry parameter. Opt. Express. 27 (7):10152–8. doi:https://doi.org/10.1364/OE.27.010152.
- Hoffer, A., Á. Tóth, M. Pósfai, C. E. Chung, and A. Gelencsér. 2017. Brown carbon absorption in the red and near-infrared spectral region. Atmos. Meas. Tech. 10 (6):2353–9., doi:https://doi.org/10.5194/amt-10-2353-2017.
- Ito, A., and J. E. Penner. 2005. Historical emissions of carbonaceous aerosols from biomass and fossil fuel burning for the period 1870–2000. Global Biogeochem. Cycles 19 (2):GB2028. doi:https://doi.org/10.1029/2004GB002374.
- Kirchstetter, T. W., T. Novakov, and P. V. Hobbs. 2004. Evidence that the spectral dependence of light absorption by aerosols is affected by organic carbon. J. Geophys. Res. 109 (D21):D21208. doi:https://doi.org/10.1029/2004JD004999.
- Knox, A., G. Evans, J. Brook, X. Yao, C.-H. Jeong, K. Godri, K. Sabaliauskas, and J. Slowik. 2009. Mass absorption cross-section of ambient black carbon aerosol in relation to chemical age. Aerosol Sci. Technol. 43 (6):522–32. doi:https://doi.org/10.1080/02786820902777207.
- Kodros, J. K., C. Scott, S. Farina, Y. Lee, C. L'Orange, J. Volckens, and J. Pierce. 2015. Uncertainties in global aerosols and climate effects due to biofuel emissions. Atmos. Chem. Phys. 15 (15):8577–96. doi:https://doi.org/10.5194/acp-15-8577-2015.
- Lack, D., and C. Cappa. 2010. Impact of brown and clear carbon on light absorption enhancement, single scatter albedo and absorption wavelength dependence of black carbon. Atmos. Chem. Phys. 10 (9):4207–20. doi:https://doi.org/10.5194/acp-10-4207-2010.
- Lack, D. A., J. M. Langridge, R. Bahreini, C. D. Cappa, A. M. Middlebrook, and J. P. Schwarz. 2012a. Brown carbon and internal mixing in biomass burning particles. Proc. Natl. Acad. Sci. 109 (37):14802–7. doi:https://doi.org/10.1073/pnas.1206575109.
- Lack, D. A., M. S. Richardson, D. Law, J. M. Langridge, C. D. Cappa, R. J. McLaughlin, and D. M. Murphy. 2012b. Aircraft instrument for comprehensive characterization of aerosol optical properties, part 2: black and brown carbon absorption and absorption enhancement measured with photo acoustic spectroscopy. Aerosol Sci. Technol. 46 (5):555–68. doi:https://doi.org/10.1080/02786826.2011.645955.
- Lan, Z.-J., X.-F. Huang, K.-Y. Yu, T.-L. Sun, L.-W. Zeng, and M. Hu. 2013. Light absorption of black carbon aerosol and its enhancement by mixing state in an urban atmosphere in South China. Atmos. Environ. 69:118–23. doi:https://doi.org/10.1016/j.atmosenv.2012.12.009.
- Liu, D., J. Whitehead, M. R. Alfarra, E. Reyes-Villegas, D. V. Spracklen, C. L. Reddington, S. Kong, P. I. Williams, Y.-C. Ting, S. Haslett, et al. 2017. Black-carbon absorption enhancement in the atmosphere determined by particle mixing state. Nature Geosci. 10 (3):184–8. doi:https://doi.org/10.1038/ngeo2901.
- Liu, F., J. Yon, A. Fuentes, P. Lobo, G. J. Smallwood, and J. C. Corbin. 2020. Review of recent literature on the light absorption properties of black carbon: Refractive index, mass absorption cross section, and absorption function. Aerosol Sci. Technol. 54 (1):33–51. doi:https://doi.org/10.1080/02786826.2019.1676878.
- Liu, S., A. C. Aiken, K. Gorkowski, M. K. Dubey, C. D. Cappa, L. R. Williams, S. C. Herndon, P. Massoli, E. C. Fortner, P. S. Chhabra, et al. 2015. Enhanced light absorption by mixed source black and brown carbon particles in UK winter. Nat. Commun. 6:8435. doi:https://doi.org/10.1038/ncomms9435.
- Luo, J., Y. Zhang, F. Wang, and Q. Zhang. 2018. Effects of brown coatings on the absorption enhancement of black carbon: a numerical investigation. Atmos. Chem. Phys. 18 (23):16897–914. doi:https://doi.org/10.5194/acp-18-16897-2018.
- McMeeking, G., E. Fortner, T. Onasch, J. Taylor, M. Flynn, H. Coe, and S. Kreidenweis. 2014. Impacts of nonrefractory material on light absorption by aerosols emitted from biomass burning. J. Geophys. Res. Atmos. 119 (21):12,272–12,286. doi:https://doi.org/10.1002/2014JD021750.
- Moosmüller, H., R. Chakrabarty, and W. Arnott. 2009. Aerosol light absorption and its measurement: a review. J. Quant. Spectrosc. Radiat. Transf. 110 (11):844–78. doi:https://doi.org/10.1016/j.jqsrt.2009.02.035.
- Nakayama, T., Y. Ikeda, Y. Sawada, Y. Setoguchi, S. Ogawa, K. Kawana, M. Mochida, F. Ikemori, K. Matsumoto, and Y. Matsumi. 2014. Properties of light‐absorbing aerosols in the Nagoya urban area, Japan, in August 2011 and January 2012. J. Geophys. Res. Atmos. 119 (22):12,721–712,739. doi:https://doi.org/10.1002/2014JD021744.
- Onasch, T. 2009. Development and characterization of a thermodenuder for aerosol volatility measurements. Billerica, MA: Aerodyne Research, Inc., 45 Manning Rd.
- Patel, S., A. Leavey, S. He, J. Fang, K. O’Malley, and P. Biswas. 2016. Characterization of gaseous and particulate pollutants from gasification-based improved cookstoves. Energy Sustainable Dev. 32:130–9. doi:https://doi.org/10.1016/j.esd.2016.02.005.
- Peng, J., M. Hu, S. Guo, Z. Du, J. Zheng, D. Shang, M. Levy Zamora, L. Zeng, M. Shao, Y.-S. Wu, et al. 2016. Markedly enhanced absorption and direct radiative forcing of black carbon under polluted urban environments. Proc. Natl. Acad. Sci. USA. 113 (16):4266–71. 201602310, doi:https://doi.org/10.1073/pnas.1602310113.
- Pokhrel, R. P., E. R. Beamesderfer, N. L. Wagner, J. M. Langridge, D. A. Lack, T. Jayarathne, E. A. Stone, C. E. Stockwell, R. J. Yokelson, and S. M. Murphy. 2017. Relative importance of black carbon, brown carbon, and absorption enhancement from clear coatings in biomass burning emissions. Atmos. Chem. Phys. 17 (8):5063–78. doi:https://doi.org/10.5194/acp-17-5063-2017.
- Pokhrel, R. P., N. L. Wagner, J. M. Langridge, D. A. Lack, T. Jayarathne, E. A. Stone, C. E. Stockwell, R. J. Yokelson, and S. M. Murphy. 2016. Parameterization of single-scattering albedo (SSA) and absorption Ångström exponent (AAE) with EC/OC for aerosol emissions from biomass burning. Atmos. Chem. Phys. 16 (15):9549–61. doi:https://doi.org/10.5194/acp-16-9549-2016.
- Poulain, L., W. Birmili, F. Canonaco, M. Crippa, Z. Wu, S. Nordmann, G. Spindler, A. S. Prévôt, A. Wiedensohler, and H. Herrmann. 2014. Chemical mass balance of 300° C non-volatile particles at the tropospheric research site Melpitz, Germany. Atmos. Chem. Phys. 14 (18):10145–62. doi:https://doi.org/10.5194/acp-14-10145-2014.
- Radney, J. G., and C. D. Zangmeister. 2015. Measurement of gas and aerosol phase absorption spectra across the visible and near-IR using supercontinuum photoacoustic spectroscopy. Anal. Chem. 87 (14):7356–63. doi:https://doi.org/10.1021/acs.analchem.5b01541.
- Salako, G. O., P. K. Hopke, D. D. Cohen, B. A. Begum, S. K. Biswas, G. G. Pandit, S. Lodoysamba, W. Wimolwattanapun, S. Bunprapob, Y.-S. Chung, et al. 2012. Exploring the variation between EC and BC in a variety of locations. Aerosol Air Qual. Res. 12 (1):1–7. doi:https://doi.org/10.4209/aaqr.2011.09.0150.
- Saleh, R., Z. Cheng, and K. Atwi. 2018. The brown–black continuum of light-absorbing combustion aerosols. Environ. Sci. Technol. Lett. 5 (8):508–13. doi:https://doi.org/10.1021/acs.estlett.8b00305.
- Saleh, R., E. S. Robinson, D. S. Tkacik, A. T. Ahern, S. Liu, A. C. Aiken, R. C. Sullivan, A. A. Presto, M. K. Dubey, R. J. Yokelson, et al. 2014. Brownness of organics in aerosols from biomass burning linked to their black carbon content. Nature Geosci. 7 (9):647–50. doi:https://doi.org/10.1038/ngeo2220.
- Saliba, G., R. Subramanian, R. Saleh, A. T. Ahern, E. M. Lipsky, A. Tasoglou, R. C. Sullivan, J. Bhandari, C. Mazzoleni, and A. L. Robinson. 2016. Optical properties of black carbon in cookstove emissions coated with secondary organic aerosols: measurements and modeling. Aerosol Sci. Technol. 50 (11):1264–76. doi:https://doi.org/10.1080/02786826.2016.1225947.
- Schnaiter, M., H. Horvath, O. Möhler, K.-H. Naumann, H. Saathoff, and O. Schöck. 2003. UV-VIS-NIR spectral optical properties of soot and soot-containing aerosols. J. Aerosol Sci. 34 (10):1421–44. doi:https://doi.org/10.1016/S0021-8502(03)00361-6.
- Schwarz, J. P., J. R. Spackman, D. W. Fahey, R. S. Gao, U. Lohmann, P. Stier, L. A. Watts, D. S. Thomson, D. A. Lack, L. Pfister, et al. 2008. Coatings and their enhancement of black carbon light absorption in the tropical atmosphere. J. Geophys. Res. 113 (D3):D03203. doi:https://doi.org/10.1029/2007JD009042.
- Sedlacek, I. I. I., A. J. Onasch, T. B. L. Nichman, E. R. Lewis, P. Davidovits, A. Freedman, and L. Williams. 2018. Formation of refractory black carbon by SP2-induced charring of organic aerosol. Aerosol Sci. Technol. 52 (12):1345–50. doi:https://doi.org/10.1080/02786826.2018.1531107.
- Shetty, N. J., A. Pandey, S. Baker, W. M. Hao, and R. K. Chakrabarty. 2019. Measuring light absorption by freshly emitted organic aerosols: optical artifacts in traditional solvent-extraction-based methods. Atmos. Chem. Phys. 19 (13):8817–30. doi:https://doi.org/10.5194/acp-19-8817-2019.
- Shiraiwa, M., Y. Kondo, T. Iwamoto, and K. Kita. 2010. Amplification of light absorption of black carbon by organic coating. Aerosol Sci. Technol. 44 (1):46–54. doi:https://doi.org/10.1080/02786820903357686.
- Stevanovic, S., B. Miljevic, P. Madl, S. Clifford, and Z. Ristovski. 2015. Characterisation of a commercially available thermodenuder and diffusion drier for ultrafine particles losses. Aerosol Air Qual. Res. 15 (1):357–63. doi:https://doi.org/10.4209/aaqr.2013.12.0355.
- Stocker, T. F. Q. D., G.-K. Plattner, M. Tignor, S. K. Allen, J. Boschung, A. Nauels, Y. Xia, V. Bex, and P. M. I. Midgley. 2013. Climate change: the physical science basis, contribution of working group I to the UN 434 IPCC’s 5th Assessment Report. New York, USA: Cambridge University Press.
- Subramanian, R., A. Y. Khlystov, J. C. Cabada, and A. L. Robinson. 2004. Positive and negative artifacts in particulate organic carbon measurements with denuded and undenuded sampler configurations special issue of aerosol science and technology on findings from the fine particulate matter supersites program. Aerosol Sci. Technol. 38 (sup1):27–48. doi:https://doi.org/10.1080/02786820390229354.
- Subramanian, R., A. Y. Khlystov, and A. L. Robinson. 2006. Effect of peak inert-mode temperature on elemental carbon measured using thermal-optical analysis. Aerosol Sci. Technol. 40 (10):763–80. doi:https://doi.org/10.1080/02786820600714403.
- Sumlin, B. J., A. Pandey, M. J. Walker, R. S. Pattison, B. J. Williams, and R. K. Chakrabarty. 2017. Atmospheric photooxidation diminishes light absorption by primary brown carbon aerosol from biomass burning. Environ. Sci. Technol. Lett. 4 (12):540–5. doi:https://doi.org/10.1021/acs.estlett.7b00393.
- Swanson, J., and D. Kittelson. 2010. Evaluation of thermal denuder and catalytic stripper methods for solid particle measurements. J. Aerosol Sci. 41 (12):1113–22. doi:https://doi.org/10.1016/j.jaerosci.2010.09.003.
- Turpin, B. J., and H.-J. Lim. 2001. Species contributions to PM2. 5 mass concentrations: revisiting common assumptions for estimating organic mass. Aerosol Sci. Technol. 35:602–10.
- Wang, Q., R.-J. Huang, J. Cao, Y. Han, G. Wang, G. Li, Y. Wang, W. Dai, R. Zhang, and Y. Zhou. 2014. Mixing state of black carbon aerosol in a heavily polluted urban area of China: implications for light absorption enhancement. Aerosol Sci. Technol. 48 (7):689–97. doi:https://doi.org/10.1080/02786826.2014.917758.
- Xie, C., W. Xu, J. Wang, D. Liu, X. Ge, Q. Zhang, Q. Wang, W. Du, J. Zhao, W. Zhou, et al. 2019. Light absorption enhancement of black carbon in urban Beijing in summer. Atmos. Environ. 213:499–504. doi:https://doi.org/10.1016/j.atmosenv.2019.06.041.
- Yurkin, M. A., and A. G. Hoekstra. 2011. The discrete-dipole-approximation code ADDA: capabilities and known limitations. J. Quant. Spectrosc. Radiat. Transf. 112 (13):2234–47. doi:https://doi.org/10.1016/j.jqsrt.2011.01.031.
- Zhang, R., A. F. Khalizov, J. Pagels, D. Zhang, H. Xue, and P. H. McMurry. 2008. Variability in morphology, hygroscopicity, and optical properties of soot aerosols during atmospheric processing. Proc. Natl. Acad. Sci. 105 (30):10291–6. doi:https://doi.org/10.1073/pnas.0804860105.
- Zhang, X., H. Kim, C. L. Parworth, D. E. Young, Q. Zhang, A. R. Metcalf, and C. D. Cappa. 2016. Optical properties of wintertime aerosols from residential wood burning in Fresno, CA: results from DISCOVER-AQ 2013. Environ. Sci. Technol. 50 (4):1681–90. doi:https://doi.org/10.1021/acs.est.5b04134.
- Zhang, X., M. Mao, Y. Yin, and B. Wang. 2018. Numerical investigation on absorption enhancement of black carbon aerosols partially coated with nonabsorbing organics. J. Geophys. Res. Atmos. 123 (2):1297–308. doi:https://doi.org/10.1002/2017JD027833.