
 ?Mathematical formulae have been encoded as MathML and are displayed in this HTML version using MathJax in order to improve their display. Uncheck the box to turn MathJax off. This feature requires Javascript. Click on a formula to zoom.
Abstract
We evaluate a filter-based Aethalometer and investigate a well characterized, commercially available colloid suspension as a potential material to mimic atmospheric black carbon (BC) for use in the evaluation of such filter-based BC instruments. We size selected BC surrogate particles of 300 nm in mobility diameter, determined the particle mass, mp, and used a condensation particle counter (CPC) as a reference method for measurement of number density, Np. The number concentration was used to determine the mass concentration and to evaluate the Aethalometer as a function of particle loading, size, wavelength, and coating. For uncoated BC surrogate particles and mass concentrations less than 2.5 μg m−3 the CPC-derived BC and filter-based BC measurements could, after a correction was applied, be made to agree to within 5% at all Aethalometer wavelengths (370 to 950 nm). At higher concentrations shadowing occurs, necessitating a correction for loading on the filter. Pure brown carbon (BrC) particles generated with a humic acid (HA) surrogate produced only a minor signal at 880 nm (2% of an equivalent mass of BC), but a substantial signal at shorter wavelengths (up to 20% of an equivalent mass of BC at 370 nm). The Aethalometer indicated an Attenuation Angstrom Exponent, AtAE, value near unity (0.71) for the pure BC surrogate, but much larger (3.7) for the BrC surrogate. Uncertainty in filter-based BC measurements increased substantially for BC particles coated with minimally absorbing ammonium sulfate or with the brown carbon surrogate, and varies with detection wavelength. We present information that may improve a widely used filter-based instrument for measurements of BC and absorption properties of atmospheric aerosols.
Copyright © 2021 American Association for Aerosol Research
1. Introduction
There currently exists substantial uncertainty in trends of the concentration of black carbon (BC) due to imprecise knowledge of sources, sinks, and of measurement accuracy (Sato et al. Citation2003). Radiative forcing due to BC is similar in magnitude to methane, although BC has a shorter lifetime. The EPA characterizes BC as a component of particulate matter with an aerodynamic diameter under 2.5 μm (PM2.5) where the standard regulatory compliance annual average concentration is currently 12 μg m−3. BC is also known to have a significant effect on cloud formation, the cryosphere through reduced snow and ice albedo, and an adverse effect on human health (Jiang et al. Citation2016; Deng et al. Citation2016). BC is comprised primarily of elemental, graphene-like carbon making it an effective material at absorbing solar radiation across the UV, visible, and near-IR. Prior assessments have estimated that atmospheric BC has a mass specific absorption cross section (MAC) of 7.5 ± 1.2 m2 g−1 at λ = 550 nm and a power law dependence near unity when particles are in the Rayleigh regime (Andreae and Gelencser Citation2006; Bond and Bergstrom Citation2006; Bond et al. Citation2013; Schnaiter et al. Citation2006). The power law dependence or absorption Ångström exponent (AAE) of aerosols provides important input for calculations of atmospheric heating as a function of wavelength. Sun photometers (Mok et al. Citation2016; Schuster et al. Citation2016) and photoacoustic methods have been used to study the optical properties of biomass burning smoke containing brown carbon (BrC) (Hoffer et al. Citation2006). Some models assume BrC has optical properties of organic aerosol (OA) with only scattering (Carter et al. Citation2020); this could produce a bias in the direct radiative effects of smoke. The wavelength dependent attenuation as measured by filter-based instruments has been used to approximate AAE (Bergstrom et al. Citation2007; Chung et al. Citation2012; Liu et al. Citation2014; Zheng et al. Citation2019), but the optical properties of particles on a filter differ from those of particles suspended in air. We distinguish AAE (referred to here as AbAE) from attenuation Ångström exponents (AtAE) measured by the Aethalometer. As has been pointed out in Lewis et al., Citation2008, AtAE should not be used as AAE in radiative heating schemes, but it provides useful information on the optical properties and composition of aerosols. The AbAE is fit using a single power law expression
(1)
(1)
where λ0 represents the reference wavelength of 550 nm. The AbAE of the mass absorption cross section (MAC) for size-and mass-selected with mobility diameter (Dm) of 300 nm BC surrogate has been measured using photoacoustic spectroscopy (PAS) spanning wavelengths of 405 nm ≤ λ ≤ 780 nm. This MAC is size dependent; for Dm of 300 nm AbAE is 0.76 (Zangmeister et al. Citation2019) and refractive index (RI) at 550 nm is 1.77 (± 0.02) + 0.08(± 0.01)i (You et al. Citation2016), within the range of values for BC proposed by Bond and others (Citation1999). The AbAE, also varies with particle size, measuring as high as 1.25 for Dm of 150 nm and as low as 0.428 for Dm of 500 nm (Zangmeister et al. Citation2019).
Among the methods used to quantify BC mass concentration and particle absorption are continuous, laser-induced incandescence (SP2) of individual BC particles, and PAS. Other, simpler and less expensive techniques such as the Aethalometer (Magee Scientific, Model AE 31) and the Particle Soot Absorption Photometer (PSAP) measure light transmittance through a filter to quantify light absorbing aerosols (Andreae and Gelencser Citation2006; Baumgardner et al. 2012; Bond and Bergstrom Citation2006; Hansen, Rosen, and Novakov Citation1984; Petzold, Kopp, and Niessner Citation1997; Schnaiter et al. Citation2006). Many of these filter-based instruments generate BC data (mass concentration or absorption coefficient) over a range of wavelengths that stretch from the ultra-violet (λ = 370 nm) to the near-infrared (λ = 950 nm) to provide information about the spectral contribution of absorbing aerosol, and distinguish BC from brown carbon (BrC). The attenuation (ATN) of the sample collected on the filter is defined by
(2)
(2)
where
is the intensity of light transmitted through a clean portion of the filter and
is the intensity of light transmitted though the particle-laden portion of the filter. The conversion of attenuation values recorded by the Aethalometer to attenuation coefficients is given by the following equation:
(3)
(3)
The terms A, Q and
are the attenuation coefficient (m−1), the spot area, volumetric flow rate, and the time interval, respectively (Weingartner et al. Citation2003).
The filter-based Aethalometer uses wavelength-dependent, specific attenuation cross sections (constants called SG in units of m2 g−1) to determine BC equivalent mass concentration, eBC, in units of g m−3. From bATN, mass concentrations are calculated as follows:
(4)
(4)
BC mass concentration is usually reported at λ = 880 nm because of reduced effects of absorption from brown carbon, mineral dust, or other UV-active material (Arnott et al. Citation2005; Olson et al. Citation2015; Park, Hansen, and Cho Citation2010; Petzold, Kopp, and Niessner Citation1997; Weingartner et al. Citation2003).
Many assumptions and instrumental artifacts must be accounted for in the measurements of BC mass concentrations with commercially available, filter-based instruments (Olson et al. Citation2015). It is assumed, for the Aethalometer, that attenuation increases due only to light absorption as BC accumulates on the filter (Park, Hansen, and Cho Citation2010), but BC aerosol absorption efficiency varies with composition, size, structure, and source. Loading effects have been observed when measuring eBC for soot (Jimenez et al. Citation2007; Kirchstetter and Novakov Citation2007); Arnott et al. (Arnott et al. Citation2005) observed this phenomenon where the Aethalometer under predicted eBC on a heavily aerosol laden filter. Use of the Aethalometer assumes the optical properties of the particles behave in the Rayleigh limit and that all light absorption is attributable to BC, as indicated by an AbAE near unity. There are multiple correction schemes published (Weingartner et al. Citation2003; Arnott et al. Citation2005; Schmid et al. Citation2006; Virkkula et al. Citation2007). Weingartner et al. (Citation2003) proposed calibration constants for different types of aerosols including spark-generated soot, diesel soot, and coated soot to correct for the multiple scattering effects due to the filter matrix itself. Corrections have also been developed that include a scattering component derived from multiple scattering theory for highly absorbing materials under laboratory and ambient conditions. Arnott et al. (Citation2005) derived a scattering correction for when the filter-based instrument did not measure zero for a purely scattering material. They concluded that scattering measured concurrently improves accuracy. Other schemes only apply a filter-loading correction. Newer models of this instrument use a second sample spot to compensate for this effect (Drinovec, Močnik, et al. Citation2015), but are not evaluated here.
While in the atmosphere, BC is constantly modified (mixing, reactions, and coating) during the aging process. An example of one of these coatings may be BrC, as from biomass burning. An outer coating (or shell) on a BC particle will alter its optical properties and create additional uncertainties. The core-shell model has shown that coatings enhance absorption (in comparison to uncoated particles) due to what is commonly called the lensing effect, more accurately referred to absorption enhancement, and demonstrated through theoretical calculations, laboratory experiments, and field measurements (Bueno et al. Citation2011; Cappa et al. Citation2012; Lack et al. Citation2012).
Evaluation of filter-based instruments requires the use of a well-characterized material. This study uses a BC surrogate (Cab-O-Jet 200, Cabot Corp.), for evaluation of Aethalometers’ eBC measurements when compared to CPC’s in-situ measurements. New specific attenuation cross section values were developed as a way to correct for at multiple wavelengths. This surrogate has a known elemental carbon composition, size dependent MAC values, refractive index, and AbAE, as determined in previous work (You et al. Citation2016; Zangmeister et al. Citation2019). The optical properties of this substance, both pure and in mixtures, were evaluated by You et al. (Citation2016) with PAS. Cab-O-Jet 200 is a suitable material to mimic atmospheric BC because it is nontoxic, water dispersible, easily atomized, and simple to work with under laboratory conditions. Here, we evaluate pure BC and BrC surrogates along with BC coated with AS and BrC with a filter-based technique.
2. Materials and methods
For all experiments, BC aerosols were generated from aqueous colloid suspensions of Cab-O-Jet 200 (Cabot Corp., 20.03 wt % solids) with a liquid jet cross-flow atomizer; the particles were dried by passing through a pair of diffusion dryers. BC aerosol concentrations were varied by adding deionized water.
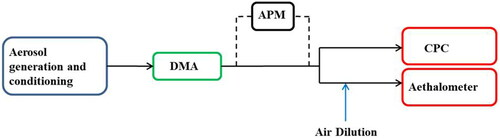
The aerosol flow was sent to a differential mobility analyzer (DMA) with a sheath:aerosol flow ratio of 10:1 to produce a steady air flow containing particles of known mobility. The particle mass was determined by doing a mass scan with an aerosol particle mass analyzer (APM) for size selected particles. For Aethalometer (AE 31, Magee Scientific, Berkeley, CA) testing, the flow of size-selected aerosols was passed to the 7-wavelength Aethalometer and to a condensation particle counter (CPC) operated in parallel as depicted in .
Figure 1. Schematic diagram of the experimental setup for comparisons between the Aethalometer and the CPC. Aerosols were generated through liquid atomization before entering the DMA to select the mobility diameter (in this case 300 nm). Mass distributions were measured to determine particle mass with a removable APM in line. The CPC measured aerosol Np, while the filter-based Aethalometer measured BC mass concentration.
2.1. Aerosol generation
As mentioned in You et al. (Citation2016), Cab-O-Jet consists of monomers that upon drying have a morphology similar to collapsed BC. Brown Carbon was generated from Ful-Humix (Faust BioAg Inc., 50 wt% humic acids) by the extraction procedure found in You et al. (Citation2016).
Different mass fractions of BC in nearly transparent (ammonium sulfate, AS) and weakly absorbing (BrC) were created to mimic the BC mass fractions found in for example in India (Raju et al. Citation2016) from burning of biomass fuels. We prepared a 5 mg ml−1 solution of BC and AS with BC mass fractions of 0.07, 0.14, and 0.205. These internal mixtures of BC with AS were co-atomized. A 5 mg ml−1 solution of 0.14 BC by mass mixed with the BrC surrogate, humic acid (HA), was also prepared and co-atomized.
2.2. Thermal optical analysis and SEM
The BC surrogate’s elemental carbon to total carbon ratio, EC/TC, was determined using thermal optical absorbance (TOA) following a modified NIOSH method (Zangmeister et al. Citation2019 and Grimes, Conny, and Dickerson Citation2020) and found to be 96 (+/−2)% BC, with the remaining ∼4% organic carbon and sulfur compounds.
SEM images have shown that the particles are composed of nearly spherical monomers aggregated into a larger spherical structure (You et al. Citation2016) with morphology comparable to collapsed or aged soot (Lack et al. Citation2014; Martins et al. Citation1998; Tumolva et al. Citation2010). The mass-mobility exponent, Dfm, for this material is 2.83, proving a near spherical morphology (You et al. Citation2016).
2.3. Determination of particle mass
Following Radney and Zangmeister (Citation2016), average mass for the 300 nm size-selected BC surrogate particles was determined by scanning an APM using a classification parameter of λc = 0.32; this parameter determines the aerosol penetration and mass resolution by using the ratio of axial and transversal times. Average particle mass was determined from a Gaussian fit of the resulting distributions with contributions of particles bearing a charge (q) = +1; see Radney et al. (Citation2013). More information concerning the characterization and calibration of the DMA and APM is provided in Radney and Zangmeister (Citation2016).
2.4. Tandem DMA
The DMA size selects particles based on their mobility within an electric field. To account for multiple charges of the mobility selected particles (Radney and Zangmeister Citation2016), we performed tandem DMA measurements coupled with a CPC. After atomization and conditioning, the aerosol passed through two DMAs, one to size select the particles at 300 nm, and the other to scan the particles at multiple diameters with a Scanning Mobility Particle Sizer (SMPS) (Lee, Xu, and Zhu Citation2012). This was performed at multiple dilutions (see online supplementary information [SI]) to account for the fractional contributions of +1 and +2 charges. The contribution of the +2 charge is dependent on the number concentration of this specific BC surrogate. Peaks of particles with a + 1 and +2 charge were integrated to account for the contribution of each charge. Results indicate that for BC mass concentrations below 2.5 µg m−3 the contribution of particles with charge of +2 is minor, <3%, and reached ≈16% for higher concentrations. The multiple charges were accounted for in mp determination.
2.5. Comparison of CPC and the aethalometer
The response of the Aethalometer to this well-characterized aerosol at known mass concentrations (as determined by a CPC and known mp) was evaluated. Aerosols were size selected using a DMA with 9.0 L min−1 sheath flow and 0.9 L min−1 of aerosol flow. Aerosols were not mass-selected by the APM. After the DMA, the aerosol flow was split between the CPC (0.3 L min−1) and the Aethalometer (0.6 L min−1) for determination of Np (m−3) and mass concentrations (MCPC, μg m−3). Aerosol flow entering the Aethalometer was monitored with a differential pressure monitor. To calculate MCPC, the Np was multiplied by the average mp determined by the APM from mass distribution analysis. The particle mass was later corrected for the contribution of particles possessing a +2 charge using tandem DMA (see the SI).
The instrument’s filter tape was advanced before each run of approximately fifty minutes. It automatically advances when the filter tape reaches an attenuation of 75%. The filter-sampled aerosol was diluted with HEPA-filtered, dry air to compensate for the additional ≈ 5.4 L min−1 of volumetric flow required; this also prevented excessive attenuation. This dilution factor was included when scaling the concentrations measured by the CPC (MCPC) to those reported by the filter-based instrument. The volumetric flow rate of the Aethalometer was controlled by an external pump, and the HEPA filtered air dilution was controlled using a mass flow controller. The flow for the air dilution and Aethalometer’s volumetric flow rate were monitored for each run with a Bios Flow Calibrator.
2.6. Uncertainty analysis (CPC) and limit of detection (aethalometer)
The manufacturer’s uncertainty for the CPC (TSI, Condensation Particle Counter 3775) is quoted as ±10%. The stability and response of the Aethalometer was tested by sampling HEPA filtered air for approximately 6 h with readings every two minutes. Due to instrument noise and drift, results showed an uncertainty (defined as three times the standard deviation, 3σ) of ±0.0802 μg m−3 at 880 nm and an average indicated concentration of −0.0023 μg m−3. At 660 nm the average indicated equivalent mass concentration was −0.00074 μg m−3 with a 3σ uncertainty of ±0.054 μg m−3, while at 370 nm the average equivalent mass concentration was −0.00057 μg m−3 with a 3σ uncertainty of ±0.0299 μg m−3. The uncertainty in measurements of BC in ambient air is greater due to filter loading, coating, and interference from other absorbing species, as described below. Flows were measured using the Bios DryCal Definer 220 Flow Calibrator with uncertainty of approximately 2%.
3. Results
3.1. Evaluation of the performance of the aethalometer: Low mass concentrations
The BC surrogate was used to evaluate the performance of an Aethalometer by using particles with known size and mass. The BC equivalent mass concentrations measured by this filter-based instrument were compared to those measured by the APM (for particle mass) and CPC (MCPC). The contribution of multiply charged particles to the number concentration was determined with tandem DMA (q > +1 particles were <3%). The particle mass for Dm = 300 nm was 11.6 ± 0.9 fg (1σ).
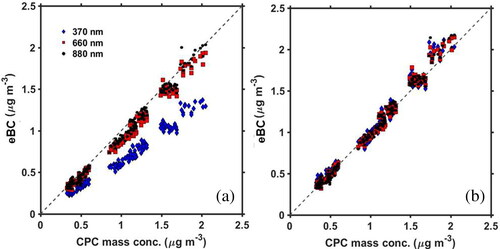
The eBC reported by the Aethalometer was compared to MCPC at low eBC (<2.5 μg m−3) using the manufacturer’s default parameters at λ = 880 nm, 660 nm and 370 nm; see (dashed line represents 1:1). This is the same Aethalometer data (for λ = 880 nm only) as presented by Zangmeister et al. (Citation2019), where the fractional contribution of multiple charges was determined by a different set experiments involving tandem DMA and accounted for in mp. The mp values are within measurement uncertainty. This mass concentration range is comparable to ambient BC mass concentrations observed within the continental United States (Babich et al. Citation2000). For 0 μg m−3 ≤ eBC ≤ 2.5 μg m−3 the linear regression of eBC versus MCPC at λ = 880 nm exhibited a slope of 0.951 ± 0.004; fit uncertainties represent the 1σ standard errors of the residuals of the linear function. The slope at λ = 880 nm of eBC illustrates that over this concentration range, the BC surrogate is slightly underestimated by the Aethalometer in comparison to measurements by the APM and CPC. At shorter wavelengths (), weaker agreement between the two techniques was observed. At λ = 660 nm the slope was 0.919 ± 0.004 and at λ = 370 nm was 0.654 ± 0.003. The decreasing slope at decreasing wavelength (i.e., larger deviations from 1:1) and concomitant underestimation of eBC is attributed to size dependence, and the disagreement of the measured SG values compared to those recommended by the manufacturer. This disagreement is due to the assumption that all BC should have a wavelength dependence of unity, and the assumed SG size independence. These results illustrate that at low eBC, corrections are necessary, but linear. The uncorrected Aethalometer’s BC mass concentration readings are approximately 5% below the in-situ technique at λ = 880 nm and 35% below at λ = 370 nm.
Figure 2. (a) Correlation of CPC mass concentration with eBC (BC equivalent mass concentration: μg m−3) at three different instrumental wavelengths: 370, 660 and 880 nm. Observations are for low mass concentrations (< ≈2.5 μg m−3) for particles with a mobility diameter of 300 nm. (b) Correlation at low mass concentrations with corrected SG values. Intercepts of best-fit lines were forced to zero. Less than a 1% impact was observed on the slope.
3.2. Wavelength response for the BC surrogate and SG correction factors
The spectral response of the filter-based instrument was evaluated for BC surrogate particles. Previous studies have used the spectral response to infer the presence of BC and other light absorbing aerosols during ambient measurements (Ran et al. Citation2016; Saleh et al. Citation2013; Zotter et al. Citation2017). For the 300 nm mobility selected aerosol, the AtAE value (Segura et al. Citation2014) of the BC surrogate was calculated using the 7-wavelength Aethalometer and compared to the previously mentioned wavelength dependence determined by PAS (Zangmeister et al.). The experimentally determined AtAE from the Aethalometer was 0.71 ± 0.05 over 520-880 nm. This data is representative of a run with a reported average eBC of 1.19 (±0.05) μg m−3; in a regime where the filter-loading correction is not required. AtAE is different (by approximately 7%) from the AbAE (0.76) because attenuation measurements include absorption, scattering, and the filter substrate effects, while the AbAE is determined in-situ with PAS for pure absorption.
Experimental SG values for Cab-O-Jet were determined by using the in-situ mass concentrations measured by the CPC, along with the mp from the APM mass distributions (i.e., MCPC) as the reference, and the calculated values of the filter-based attenuation coefficients (using EquationEquations (2)(2)
(2) and Equation(3)
(3)
(3) ). This allowed us to define what the actual SG values should be for the Aethalometer at multiple wavelengths for this specific BC material (mobility diameter of 300 nm); see . There is greater deviation from the manufacturer’s recommendation for shorter wavelengths.
Table 1. Calculated SG values (and standard deviations) for three separate runs with 300 nm Cab-O-Jet particles for mass concentration up to ≈2.5 μg m−3. Also shown is the percent deviation from the manufacturer’s constant values for SG at multiple wavelengths.
The newly determined SG values for the 300 nm particles of the BC surrogate were used to correct for the low and high mass concentration ranges of data as shown in and for each individual data point. When the corrected SG values were applied for the lower mass concentration range correlation, the slope for all wavelengths moved closer to unity (). Slope values are not exactly 1.00, but are within 3% of unity because each individual mass concentration reading was corrected by the average SG values.
Figure 3. Results for eBC up to ≈20 μg m−3. (a) Correlation of CPC-determined mass concentration with uncorrected filter-based eBC. (b) Correlation of CPC mass concentration eBC up to 20 μg m−3 with only the loading correction (described in the SI) applied. (c) Correlation of CPC mass concentration with eBC with both the loading correction and corrected SG applied.
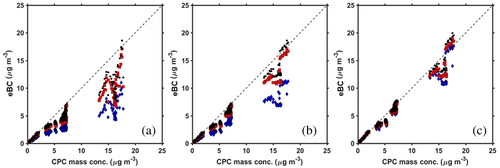
Table 2. Best fit slope (where the y-intercept is forced through zero) values for BC up to 2.5 μg m−3 for the raw data and the data corrected for the newly determined SG values.
3.3. Evaluation of the performance of the aethalometer: Larger range of BC mass concentrations
Higher eBC, representative of ambient BC concentrations found near sources or in more polluted environments such as cities in China (Cao et al. Citation2004) and India, (Raju et al. Citation2016) can lead to different results. Shown in are results for BC surrogate mass concentrations up to ≈20 μg m−3. At this higher mass concentration range, the slope of eBC relative to MCPC at all wavelengths decreased and deviations from unity increased. At λ = 880 nm, 660 nm and 370 nm the slopes were 0.728 ± 0.006, 0.656 ± 0.006 and 0.426 ± 0.005, respectively. When the wavelength decreases, the underestimation of eBC increases, and this is consistent with the low mass concentration study presented earlier and with previous reports showing loading and shadowing effects (Weingartner et al. Citation2003; Jimenez et al. Citation2007).
With the BC surrogate measured in this work, the Aethalometer signal decreased monotonically in time, as shown by the black diamonds in (SI) (λ = 880 nm) due to the loading effect. After 50 min, the indicated eBC was ∼ 40% lower than at the onset of measurements as seen in in the SI. The CPC signal indicated that the measured mass concentration (blue circles) remained constant within 3%. To correct for the nonlinear attenuation response as a function of filter loading at a constant loading rate (i.e., constant particle mass concentration), the loading correction technique described in Jimenez et al. Citation2007 was applied. See also the SI.
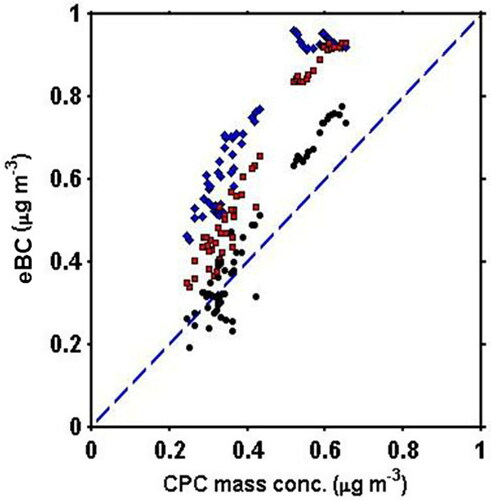
Figure 4. Response of Aethalometer at 370 nm (blue diamonds), 660 nm (red squares) and 880 nm (black circles) to the CPC-derived BC using a 14% BC mass fraction solution with BrC. The coating causes a positive interference that increases at shorter wavelengths.
As depicted in (and ), for the larger range in mass concentrations, the slope of the MCPC mass versus eBC at λ = 880 nm improves (from 0.728) to 0.881 (±0.005) (R2=0.97) when just the loading correction is applied. The slope at λ = 660 nm and 370 nm also improve to 0.812 (±0.005) and 0.543 (±0.004), respectively, moving closer to unity, and showing the importance of a loading correction when operating at higher mass concentrations. However, the continued underestimation of eBC relative to MCPC suggests that we examine the SG values for this surrogate at high concentrations.
Table 3. Best-fit slope (where the y-intercept is forced through zero) values up to 20 μg m3 for the raw data and the data corrected for the loading effect and newly determined SG values.
After the loading correction was applied, our larger ranged BC mass concentration data was also adjusted with our newly determined SG values found in . At λ = 880 nm, 660 nm and 370 nm the slopes were 0.943 ± 0.005 (R2=0.97), 0.900 ± 0.006 (R2=0.97) and 0.851 ± 0.007 (R2=0.95), respectively. Overall, the usage of the loading correction and the new, adjusted SG values are necessary to correct for BC mass concentration as observed in .
3.4. BC coating with ammonium sulfate
To evaluate the Aethalometer’s response to the BC surrogate for internally mixed particles, BC was co-atomized with AS. These coated particles (diameter = 300 nm), where the BC was embedded in an AS shell, were used to evaluate the performance of the Aethalometer at BC mass fractions of 7%, 14%, and 20.5%, using the manufacturer’s pre-programmed SG values. Upon atomization and drying, these internally mixed particles with differing amounts of BC exhibited similar total particle masses of 25.8 ± 0.2, 25.3 ± 0.4 and 24.3 ± 0.5 fg, respectively. All particles exhibited a q = +2 < 4% by number. The greater the coating, the greater the deviation from values for pure BC. provides the best fit slope values when the y-intercept is forced through zero.
Table 4. Values of the slope and 1σ when the y-intercept is forced through zero for the multiple mass fractions of BC with AS. Best fit correction factors are the inverse of these slope values.
For internal mixtures of BC with non-absorbing materials, the absorption as measured by the Aethalometer was enhanced, consistent with core-shell Mie calculations and laboratory experiments (Cappa et al. Citation2012). This absorption enhancement is most prominent at the lowest (7%) BC mass fraction internal mixture. The Aethalometer exhibits the strongest absorption enhancement at λ = 660 nm for an internal mixture consisting of BC and AS. This artifact of the Aethalometer needs to be accounted for because ambient measurements often contain coated particles.
For internal BC and AS mixtures, the Aethalometer’s wavelength dependence (or Attenuation Ångström Exponent, AtAE, wavelength range 520-880 nm) using preprogramed SG values increases with a decrease in BC, climbing from 1.03 for 20.5%, to 1.21 for 14% and 1.31 for 7% BC. Retrieving spectral data may help approximate BC mass fraction in ambient particles, although spectral data also depends on particle size distribution.
3.5. Brown carbon surrogate absorptivity
We seek to determine the response and level of interference that BrC causes in BC measurements with this attenuation-based instrument. Aerosols composed BrC absorb radiation at visible, and with increasing strength into near ultra-violet wavelengths (Cappa et al. Citation2012). It is imperative to properly quantify the absorptivity of BrC for its contribution to the radiative forcing budget. BrC is chemically distinct from BC, but generates a signal in absorption-based instruments. We generated 300 nm BrC aerosol using the HA surrogate as described above. All BrC particles exhibited a q = +2 < 2% by number. Results, , depict a greater sensitivity at shorter wavelengths as indicated by the slope.
Table 5. Response of the Aethalometer to pure BrC surrogate. The second column is the slope of Aethalometer signal vs. BrC mass concentration with the y-intercept forced through zero. Response of BrC decreases as the detection wavelength increases.
At the shortest wavelength reported, BrC attenuates radiation with approximately 20% of the efficiency of BC. However, at λ = 880 nm, this falls to 2%, and BC readings of the Aethalometer were near the limit of detection for up to 4.0 µg m−3 BrC. These results indicate that BC measured at 880 nm shows little interference from unmixed BrC particles.
The wavelength response presented here indicate an AtAE of 3.7 (± 0.2) for HA at λ = 520 nm and 880 nm. Prior work determined the AbAE of this BrC surrogate as 5.31 ± 0.14 for particles with a smaller mobility diameter of 250 nm (You et al. Citation2016). This large wavelength dependence is consistent with previous studies of organic aerosol (Bergstrom et al. Citation2007). Using a BrC surrogate to evaluate the wavelength dependence of the Aethalometer will help with aerosol classification when sampling ambient particles.
3.6. Coated BC with a BrC surrogate
BC absorption is also amplified when internally mixed with organics (You et al. Citation2016; Shiraiwa et al. Citation2010), see Bueno et al. (Citation2011) and review by Bond and Bergstrom (Citation2006). Here, we evaluated a 14% BC (mass fraction) internally mixed with the BrC surrogate and compared the Aethalometer to an in-situ technique. These experiments are meant to simulate internally mixed BC particles as seen in biomass burning (Saleh et al. Citation2013; Mok et al. Citation2016).
Multiple charging effects are assumed to be negligible (q = +2 ≤ 2%) due to previous results of multiple charging from BrC particles at similar number concentrations. The response of the Aethalometer using the default SG () at λ = 880 nm is about 12% greater than unity, (1.12 ± 0.01) increases to 1.47 ± 0.01 at 660 nm, and reaches a maximum of 1.68 ± 0.01 at 370 nm. Even at the long wavelength of 880 nm and low mass concentrations, the signal is enhanced substantially when the BC is internally mixed with BrC.
These mass concentration values can also be used to measure the AtAE from the Aethalometer. For this internal mixture of a highly absorbing material embedded within a low absorbing material, the AtAE was 1.7 ± 0.1 (λ = 520-880 nm). This is in rough agreement with the value of 1.91 ± 0.05 derived for 250 nm particles at 13% BC in BrC, although different mobility diameters (You et al. Citation2016). Our AtAE value from the Aethalometer for the internally mixed particle of BrC with BC is more than double the AtAE reported for the uncoated BC particle and sufficient to distinguish pure BC from such mixtures. Understanding the wavelength response of these internally mixed particles with the Aethalometer can provide more information about the composition of atmospheric particles in existing data sets.
4. Discussion
The BC surrogate Cab-O-Jet with high elemental carbon content and nearly spherical morphology appears a suitable material for the evaluation and calibration of the filter-based attenuation instruments. For pure BC and mass concentrations below 2.5 μg m−3, the Aethalometer (with default values at 880 nm) responds linearly and with good precision, ∼5%, when compared to a reference method. However, larger corrections are needed at shorter wavelengths. This instrument also showed a greater need for correction at higher loadings, with an underestimation of approximately 30% at 880 nm, increasing to 57% at the shortest wavelength of 370 nm. When the newly derived SG values were applied, the indicated BC mass concentrations at all wavelengths improved, and were closer to unity.
BC particles coated with a non-absorbing material (AS) were generated to determine the response of the Aethalometer to internally mixed aerosols. In 2004/05, for example, BC accounted for approximately 15–20% of PM 2.5 mass in NYC and 7–10% in Rochester, NY (Rattigan et al. Citation2013). This indicates that ambient data where BC is a minor component of the total aerosol mass, may need large corrections to retrieve true BC mass concentration. The wavelength response (AtAEs) to particles with 7%, 14% and 20.5% BC mass fraction are approximately 85% (1.31), 70% (1.21) and 45% (1.03) higher than for uncoated BC particles. For a given air parcel, the response at multiple wavelengths, can better characterize the nature and concentration of absorbing aerosols.
Our BrC surrogate generated only a slight interference with BC measurement at 880 nm but this gradually increased at shorter wavelengths. The rejection ratios are approximately 50:1, 17:1 and 5:1 at wavelengths of 880 nm, 660 nm and 370 nm, respectively. In other words, 50 μg of this particular BrC surrogate generates a signal (λ = 880 nm) equivalent to 1 μg of BC. The strong wavelength response for this BrC surrogate provides semi-quantitative information that will help distinguish mixtures of BC and BrC for ambient sampling. To mimic possible conditions in the atmosphere, BC was also internally mixed with BrC (14% BC by mass). The wavelength response for this internally mixed material is approximately 2.4 times greater than the wavelength response of BC alone.
5. Conclusions
The commercial filter-based instrument, the Model AE31 Aethalometer, was successfully evaluated using a well characterized BC surrogate under laboratory conditions. We are able to make several conclusions in regards to using this specific light absorbing surrogate:
At lower mass concentrations (<2.5 μg m−3), the Aethalometer responds with good accuracy at λ = 880 nm. eBC measurements at lower wavelengths require a greater correction for SG.
Higher mass concentrations of BC require a correction to account for the loading effect.
The BC concentrations in internally mixed BC particles with AS are overestimated by 18-46%. The AtAEs are higher for coated BC particles than for uncoated BC particles.
The wavelength response from the Aethalometer provides information on the mixing state, and may aid in source apportionment.
The BrC surrogate showed a strong wavelength dependence where the reported mass concentration peaked at the shorter wavelengths.
BC internally mixed with BrC showed an absorption enhancement and a greater wavelength response than unmixed BC particles.
Corrections presented in this work are applicable to this BC mimic.
Supplemental Material
Download MS Word (348.7 KB)Acknowledgments
We would like to acknowledge Chris Zangmeister, James Radney and Joseph Conny from NIST and Gary Norris at the EPA Office of Research and Development for use of the crucial instruments. CG was supported by NIST. There are no competing interests of the work in this article.
Additional information
Funding
References
- Andreae, M. O., and A. Gelencser. 2006. Black carbon or brown carbon? The nature of light-absorbing carbonaceous aerosols. Atmos. Chem. Phys. 6 (10):3131–48. doi:https://doi.org/10.5194/acp-6-3131-2006.
- Arnott, W. P., K. Hamasha, H. Moosmuller, P. J. Sheridan, and J. A. Ogren. 2005. Towards aerosol light-absorption measurements with a 7-wavelength aethalometer: Evaluation with a photoacoustic instrument and 3-wavelength nephelometer. Aerosol Sci. Technol. 39 (1):17–29. doi:https://doi.org/10.1080/027868290901972.
- Babich, P., M. Davey, G. Allen, and P. Koutrakis. 2000. Method comparisons for particulate nitrate, elemental carbon, and pm2.5 mass in seven us cities. J Air Waste Manag Assoc. 50 (7):1095–105. doi:https://doi.org/10.1080/10473289.2000.10464152.
- Baumgardner, D., O. Popovicheva, J. Allan, V. Bernardoni, J. Cao, F. Cavalli, J. Cozic, E. Diapouli, K. Eleftheriadis, P. J. Genberg, et al. 2012. Soot reference materials for instrument calibration and intercomparisons: A workshop summary with recommendations. Atmos. Meas. Tech. 5 (8):1869–87. doi:https://doi.org/10.5194/amt-5-1869-2012.
- Bergstrom, R. W., P. Pilewskie, P. B. Russell, J. Redemann, T. C. Bond, P. K. Quinn, and B. Sierau. 2007. Spectral absorption properties of atmospheric aerosols. Atmos. Chem. Phys. 7 (23):5937–43. doi:https://doi.org/10.5194/acp-7-5937-2007.
- Bond, T. C., and R. W. Bergstrom. 2006. Light absorption by carbonaceous particles: An investigative review. Aerosol Sci. Technol. 40 (1):27–67. doi:https://doi.org/10.1080/02786820500421521.
- Bond, T. C., M. Bussemer, B. Wehner, S. Keller, R. J. Charlson, and J. Heintzenberg. 1999. Light absorption by primary particle emissions from a lignite burning plant. Environ. Sci. Technol. 33 (21):3887–91. doi:https://doi.org/10.1021/es9810538.
- Bond, T. C., S. J. Doherty, D. W. Fahey, P. M. Forster, T. Berntsen, B. J. DeAngelo, M. G. Flanner, S. Ghan, B. Karcher, D. Koch, et al. 2013. Bounding the role of black carbon in the climate system: A scientific assessment. J. Geophys. Res. Atmos. 118 (11):5380–552. doi:https://doi.org/10.1002/jgrd.50171.
- Bueno, P. A., D. K. Havey, G. W. Mulholland, J. T. Hodges, K. A. Gillis, R. R. Dickerson, and M. R. Zachariah. 2011. Photoacoustic measurements of amplification of the absorption cross section for coated soot aerosols. Aerosol Sci. Technol. 45 (10):1217–30. doi:https://doi.org/10.1080/02786826.2011.587477.
- Cao, J. J., S. C. Lee, K. F. Ho, S. C. Zou, K. Fung, Y. Li, J. G. Watson, and J. C. Chow. 2004. Spatial and seasonal variations of atmospheric organic carbon and elemental carbon in pearl river delta region, China. Atmos. Environ. 38 (27):4447–56. doi:https://doi.org/10.1016/j.atmosenv.2004.05.016.
- Cappa, C. D., T. B. Onasch, P. Massoli, D. R. Worsnop, T. S. Bates, E. S. Cross, P. Davidovits, J. Hakala, K. L. Hayden, B. T. Jobson, et al. 2012. Radiative absorption enhancements due to the mixing state of atmospheric black carbon. Science 337 (6098):1078–81. doi:https://doi.org/10.1126/science.1223447.
- Carter, T. S., C. L. Heald, J. L. Jimenez, P. Campuzano-Jost, Y. Kondo, N. Moteki, J. P. Schwarz, C. Wiedinmyer, A. S. Darmenov, A. M. da Silva, et al. 2020. How emissions uncertainty influences the distribution and radiative impacts of smoke from fires in North America. Atmos. Chem. Phys. 20 (4):2073–97. doi:https://doi.org/10.5194/acp-20-2073-2020.
- Chung, C. E., S. W. Kim, M. Lee, S. C. Yoon, and S. Lee. 2012. Carbonaceous aerosol aae inferred from in-situ aerosol measurements at the GOSAN ABC super site, and the implications for brown carbon aerosol. Atmos. Chem. Phys. 12 (14):6173–84. doi:https://doi.org/10.5194/acp-12-6173-2012.
- Deng, W. J., H. L. Zheng, A. K. Y. Tsui, and X. W. Chen. 2016. Measurement and health risk assessment of pm2.5, flame retardants, carbonyls and black carbon in indoor and outdoor air in kindergartens in Hong Kong. Environ. Int. 96:65–74. doi:https://doi.org/10.1016/j.envint.2016.08.013.
- Drinovec, L., Močnik, G., Zotter, P., Prévôt, A.S.H., Ruckstuhl, C., Coz, E., Rupakheti, M., Sciare, J., Müller, T., Wiedensohler, A. and Hansen, A.D.A. 2015. The “dual-spot” Aethalometer: an improved measurement of aerosol black carbon with real-time loading compensation. Atmospheric Measurement Techniques, 8 (5):1965–1979.
- Grimes, C. D., J. M. Conny, and R. R. Dickerson. 2020. Evaluation of thermal optical analysis (TOA) using an aqueous binary mixture. Atmos. Environ. 241:117647.
- Hansen, A. D. A., H. Rosen, and T. Novakov. 1984. The aethalometer - an instrument for the real-time measurement of optical-absorption by aerosol-particles. Sci. Total Environ. 36:191–6. doi:https://doi.org/10.1016/0048-9697(84)90265-1.
- Hoffer, A., A. Gelencser, P. Guyon, G. Kiss, O. Schmid, G. P. Frank, P. Artaxo, and M. O. Andreae. 2006. Optical properties of humic-like substances (hulis) in biomass-burning aerosols. Atmos. Chem. Phys. 6 (11):3563–70. doi:https://doi.org/10.5194/acp-6-3563-2006.
- Jiang, Y. Q., Z. Lu, X. H. Liu, Y. Qian, K. Zhang, Y. H. Wang, and X. Q. Yang. 2016. Impacts of global open-fire aerosols on direct radiative, cloud and surface-albedo effects simulated with cam5. Atmos. Chem. Phys. 16 (23):14805–24. doi:https://doi.org/10.5194/acp-16-14805-2016.
- Jimenez, J.,. C. Claiborn, T. Larson, T. Gould, T. W. Kirchstetter, and L. Gundel. 2007. Loading effect correction for real-time aethalometer measurements of fresh diesel soot. Journal of the Air & Waste Manage. Assoc. 57 (7):868–73. doi:https://doi.org/10.3155/1047-3289.57.7.868.
- Kirchstetter, T. W., and T. Novakov. 2007. Controlled generation of black carbon particles from a diffusion flame and applications in evaluating black carbon measurement methods. Atmos. Environ. 41 (9):1874–88. doi:https://doi.org/10.1016/j.atmosenv.2006.10.067.
- Lack, D. A., H. Moosmuller, G. R. McMeeking, R. K. Chakrabarty, and D. Baumgardner. 2014. Characterizing elemental, equivalent black, and refractory black carbon aerosol particles: A review of techniques, their limitations and uncertainties. Anal. Bioanal. Chem. 406 (1):99–122. doi:https://doi.org/10.1007/s00216-013-7402-3.
- Lack, D. A., M. S. Richardson, D. Law, J. M. Langridge, C. D. Cappa, R. J. McLaughlin, and D. M. Murphy. 2012. Aircraft instrument for comprehensive characterization of aerosol optical properties, part 2: Black and brown carbon absorption and absorption enhancement measured with photo acoustic spectroscopy. Aerosol Sci. Technol. 46 (5):555–68. doi:https://doi.org/10.1080/02786826.2011.645955.
- Lee, E. S., B. Xu, and Y. F. Zhu. 2012. Measurements of ultrafine particles carrying different number of charges in on- and near-freeway environments. Atmos. Environ. 60:564–72. doi:https://doi.org/10.1016/j.atmosenv.2012.06.085.
- Lewis, K., W. P. Arnott, H. Moosmuller, and C. E. Wold. 2008. Strong spectral variation of biomass smoke light absorption and single scattering albedo observed with a novel dual wavelength photoacoustic instrument. J. Geophys. Res. 113:D16203. doi:https://doi.org/10.1029/2007JD009699.
- Liu, J. M., E. Scheuer, J. Dibb, L. D. Ziemba, K. L. Thornhill, B. E. Anderson, A. Wisthaler, T. Mikoviny, J. J. Devi, M. Bergin, et al. 2014. Brown carbon in the continental troposphere. Geophys. Res. Lett. 41 (6):2191–5. doi:https://doi.org/10.1002/2013GL058976.
- Martins, J. V., P. Artaxo, C. Liousse, J. S. Reid, P. V. Hobbs, and Y. J. Kaufman. 1998. Effects of black carbon content, particle size, and mixing on light absorption by aerosols from biomass burning in brazil. J. Geophys. Res. 103 (D24):32041–50. doi:https://doi.org/10.1029/98JD02593.
- Mok, J., N. A. Krotkov, A. Arola, O. Torres, H. Jethva, M. Andrade, G. Labow, T. F. Eck, Z. Q. Li, R. R. Dickerson, et al. 2016. Impacts of brown carbon from biomass burning on surface UV and ozone photochemistry in the amazon basin. Sci. Rep. 6:36940. doi:https://doi.org/10.1038/srep36940.
- Olson, M. R., M. V. Garcia, M. A. Robinson, P. Van Rooy, M. A. Dietenberger, M. Bergin, and J. J. Schauer. 2015. Investigation of black and brown carbon multiple-wavelength-dependent light absorption from biomass and fossil fuel combustion source emissions. J. Geophys. Res. Atmos. 120 (13):6682–97. doi:https://doi.org/10.1002/2014JD022970.
- Park, S. S., A. D. A. Hansen, and S. Y. Cho. 2010. Measurement of real time black carbon for investigating spot loading effects of aethalometer data. Atmos. Environ. 44 (11):1449–55. doi:https://doi.org/10.1016/j.atmosenv.2010.01.025.
- Petzold, A., C. Kopp, and R. Niessner. 1997. The dependence of the specific attenuation cross-section on black carbon mass fraction and particle size. Atmos. Environ. 31 (5):661–72. doi:https://doi.org/10.1016/S1352-2310(96)00245-2.
- Radney, J. G., and C. D. Zangmeister. 2016. Practical limitations of aerosol separation by a tandem differential mobility analyzer-aerosol particle mass analyzer. Aerosol Sci. Technol. 50 (2):160–72. doi:https://doi.org/10.1080/02786826.2015.1136733.
- Radney, J. G., X. F. Ma, K. A. Gillis, M. R. Zachariah, J. T. Hodges, and C. D. Zangmeister. 2013. Direct measurements of mass-specific optical cross sections of single-component aerosol mixtures. Anal. Chem. 85 (17):8319–25. doi:https://doi.org/10.1021/ac401645y.
- Raju, M. P., P. D. Safai, K. Vijayakumar, P. C. S. Devara, C. V. Naidu, P. S. P. Rao, and G. Pandithurai. 2016. Atmospheric abundances of black carbon aerosols and their radiative impact over an urban and a rural site in SW India. Atmos. Environ. 125:429–36. doi:https://doi.org/10.1016/j.atmosenv.2015.09.023.
- Ran, L., Z. Z. Deng, P. C. Wang, and X. A. Xia. 2016. Black carbon and wavelength-dependent aerosol absorption in the north China plain based on two-year aethalometer measurements. Atmos. Environ. 142:132–44. doi:https://doi.org/10.1016/j.atmosenv.2016.07.014.
- Rattigan, O. V., K. Civerolo, P. Doraiswamy, H. D. Felton, and P. K. Hopke. 2013. Long term black carbon measurements at two urban locations in New York. Aerosol Air Qual. Res. 13 (4):1181–U1305. doi:https://doi.org/10.4209/aaqr.2013.02.0060.
- Saleh, R., C. J. Hennigan, G. R. McMeeking, W. K. Chuang, E. S. Robinson, H. Coe, N. M. Donahue, and A. L. Robinson. 2013. Absorptivity of brown carbon in fresh and photo-chemically aged biomass-burning emissions. Atmos. Chem. Phys. 13 (15):7683–93. doi:https://doi.org/10.5194/acp-13-7683-2013.
- Sato, M., J. Hansen, D. Koch, A. Lacis, R. Ruedy, O. Dubovik, B. Holben, M. Chin, and T. Novakov. 2003. Global atmospheric black carbon inferred from aeronet. Proc Natl Acad Sci USA. 100 (11):6319–24. doi:https://doi.org/10.1073/pnas.0731897100.
- Schmid, O., P. Artaxo, W. P. Arnott, D. Chand, L. V. Gatti, G. P. Frank, A. Hoffer, M. Schnaiter, and M. O. Andreae. 2006. Spectral light absorption by ambient aerosols influenced by biomass burning in the amazon basin. I: Comparison and field calibration of absorption measurement techniques. Atmos. Chem. Phys. 6 (11):3443–62. doi:https://doi.org/10.5194/acp-6-3443-2006.
- Schnaiter, M., M. Gimmler, I. Llamas, C. Linke, C. Jager, and H. Mutschke. 2006. Strong spectral dependence of light absorption by organic carbon particles formed by propane combustion. Atmos. Chem. Phys. 6 (10):2981–90. doi:https://doi.org/10.5194/acp-6-2981-2006.
- Schuster, G. L., O. Dubovik, A. Arola, T. F. Eck, and B. N. Holben. 2016. Remote sensing of soot carbon - part 2: Understanding the absorption angstrom exponent. Atmos. Chem. Phys. 16 (3):1587–602. doi:https://doi.org/10.5194/acp-16-1587-2016.
- Segura, S.,. V. Estellés, G. Titos, H. Lyamani, M. P. Utrillas, P. Zotter, A. S. H. Prévôt, G. Močnik, L. Alados-Arboledas, and J. A. Martínez-Lozano. 2014. Determination and analysis of in situ spectral aerosol optical properties by a multi-instrumental approach. Atmos. Meas. Tech. 7 (8):2373–87. doi:https://doi.org/10.5194/amt-7-2373-2014.
- Shiraiwa, M., Y. Kondo, T. Iwamoto, and K. Kita. 2010. Amplification of light absorption of black carbon by organic coating. Aerosol Sci. Technol. 44 (1):46–54. doi:https://doi.org/10.1080/02786820903357686.
- Tumolva, L., J. Y. Park, J. S. Kim, A. L. Miller, J. C. Chow, J. G. Watson, and K. Park. 2010. Morphological and elemental classification of freshly emitted soot particles and atmospheric ultrafine particles using the tem/eds. Aerosol Sci. Technol. 44 (3):202–15. doi:https://doi.org/10.1080/02786820903518907.
- Virkkula, A., T. Makela, R. Hillamo, T. Yli-Tuomi, A. Hirsikko, K. Hameri, and I. K. Koponen. 2007. A simple procedure for correcting loading effects of aethalometer data. J Air Waste Manag Assoc. 57 (10):1214–22. doi:https://doi.org/10.3155/1047-3289.57.10.1214.
- Weingartner, E., H. Saathoff, M. Schnaiter, N. Streit, B. Bitnar, and U. Baltensperger. 2003. Absorption of light by soot particles: Determination of the absorption coefficient by means of aethalometers. J. Aerosol Sci. 34 (10):1445–63. doi:https://doi.org/10.1016/S0021-8502(03)00359-8.
- You, R., J. G. Radney, M. R. Zachariah, and C. D. Zangmeister. 2016. Measured wavelength-dependent absorption enhancement of internally mixed black carbon with absorbing and nonabsorbing materials. Environ. Sci. Technol. 50 (15):7982–90. doi:https://doi.org/10.1021/acs.est.6b01473.
- Zangmeister, C. D., C. D. Grimes, R. R. Dickerson, and J. G. Radney. 2019. Characterization and demonstration of a black carbon aerosol mimic for instrument evaluation. Aerosol Sci. Technol. 53 (11):1322–33. doi:https://doi.org/10.1080/027868261660302.
- Zheng, H., S. F. Kong, F. Q. Wu, Y. Cheng, Z. Z. Niu, S. R. Zheng, G. W. Yang, L. Q. Yao, Q. Yan, J. Wu, et al. 2019. Intra-regional transport of black carbon between the south edge of the north china plain and central china during winter haze episodes. Atmos. Chem. Phys. 19 (7):4499–516. doi:https://doi.org/10.5194/acp-19-4499-2019.
- Zotter, P., H. Herich, M. Gysel, I. El-Haddad, Y. Zhang, G. Močnik, C. Hüglin, U. Baltensperger, S. Szidat, and A. S. H. Prévôt. 2017. Evaluation of the absorption angstrom ngstrom exponents for traffic and wood burning in the aethalometer-based source apportionment using radiocarbon measurements of ambient aerosol. Atmos. Chem. Phys. 17 (6):4229–49. doi:https://doi.org/10.5194/acp-17-4229-2017.