
Abstract
The severe acute respiratory syndrome coronavirus 2 (SARS-CoV-2) pandemic has resulted in an unprecedented shutdown in social and economic activity, with the cultural sector particularly severely affected. Restrictions on musical performances have arisen from a perception that there is a significantly higher risk of aerosol production from singing than speaking, based upon high-profile examples of clusters of COVID-19 following choral rehearsals. However, comparing aerosol generation from different types of vocalization, including singing, across a range of volumes is a rapidly evolving area of research. Here, we measured aerosols from singing, speaking and breathing from a large cohort of 25 professional singers in a range of musical genres in a zero-background environment, allowing unequivocal attribution of aerosol production to specific vocalizations. We do not assess the relative volumes at which people speak and sing. However, both showed steep increases in mass concentration with increase in loudness (spanning a factor of 20–30 across the dynamic range measured, p < 0.001). At the quietest volume (50 to 60 dBA), neither singing (p = 0.19) nor speaking (p = 0.20) were significantly different to breathing. At the loudest volume (90 to 100 dBA), a statistically significant difference (p < 0.001) was observed between singing and speaking, but with singing only generating a factor of between 1.5 and 3.4 more aerosol mass. Guidelines for musical performances should be based on the loudness and duration of the vocalization, the number of participants and the environment in which the activity occurs, rather than the type of vocalization. Mitigations such as the use of amplification and increased attention to ventilation should be employed where practicable.
Copyright © 2021 American Association for Aerosol Research
EDITOR:
Introduction
A novel strain of a human coronavirus was first identified in late 2019, designated severe acute respiratory syndrome coronavirus 2 (SARS-CoV-2), and is responsible for the global outbreak termed coronavirus disease 19 (COVID-19) (Huang et al. Citation2020; Wu and McGoogan Citation2020; Wu et al. Citation2020). Pandemic status was declared on 11 March 2020 by the World Health Organization (WHO), with in excess of 51.8 million cases and 1.28 million deaths reported worldwide by 13th November 2020 (World Health Organisation Citation2020). Early in the pandemic, clusters of COVID-19 were considered to have arisen in several choirs around the world (Charlotte Citation2020; Miller et al. Citation2020). This rapidly led to many governments restricting or suspending singing. Concerns that woodwind and brass instruments might also be responsible for virus spread led to similar restrictions on the playing of wind instruments. Consequently, large sections of the cultural sector, along with religious institutions and educational establishments, were unable to rehearse and perform, resulting in profound artistic, cultural, spiritual, emotional and social impacts. The livelihoods of many performers have been jeopardized, and the viability of established institutions remains threatened. The economic impact to the United Kingdom (UK) from this sector alone has been substantial, costing the UK economy hundreds of millions in lost tax revenue, usually derived from the £32.2 billion cultural purse (Dernac Citation2018).
Respiratory particulate matter is expelled during human exhalatory events, including breathing, speaking, coughing and sneezing (Asadi et al. Citation2019; Johnson et al. Citation2011; Morawska et al. Citation2009). The flux generated is proportional to the amplitude of phonation in speech (Alsved et al. Citation2020; Asadi et al. Citation2020). These actions release a plume of material containing particles of varying size, ranging from macroscopic mucosalivary droplets originating from the oral cavity and pharynx, to microscopic aerosols released by the small airways of the lungs (Asadi et al. Citation2020; Johnson et al. Citation2011; Morawska et al. Citation2009; Papineni and Rosenthal Citation1997). Traditionally, the division between droplets, which are considered to be of sufficient mass to sediment due to gravity, and aerosols, which remain airborne, is defined arbitrarily at 5 µm diameter (Xie et al. Citation2007; Nicas, Nazaroff, and Hubbard Citation2005). However, particle composition and environmental properties like temperature, humidity and airflow influence the biophysical mechanics of the material released and the extent of transport (Tellier et al. Citation2019; Zayas et al. Citation2012; Xie et al. Citation2007; Nicas, Nazaroff, and Hubbard Citation2005).
Droplets and airway secretions are established vectors of SARS-CoV-2, with expelled infectious material either directly inhaled by an individual in close proximity, or indirectly transmitted through contact with settled-out fomites (Pan et al. Citation2020; Woelfel et al. Citation2020). The role of airborne transmission by respirable aerosol particles is gaining prominence (Morawska and Cao Citation2020). Viral RNA has been detected in airborne samples collected both inside and outside the rooms of COVID-19 patients (Chia et al. 2020; Guo et al. Citation2020; Lednicky et al. Citation2020; Santarpia et al. Citation2020), and SARS-CoV-2 RNA has been reported in size-resolved aerosol distributions in two hospitals in Wuhan, China (Liu et al. Citation2020). Retrospective studies of COVID-19 clusters, including a shopping mall, a restaurant and a high-profile outbreak in an American choir group, found no direct or indirect interaction among the individuals contracting the virus, suggesting airborne transmission (Cai et al. Citation2020; Lu et al. Citation2020; Miller et al. Citation2020). SARS-CoV-2 and other viruses, including severe acute respiratory syndrome coronavirus (SARS-CoV-1) and Middle East Respiratory Syndrome coronavirus (MERS-CoV), are stable in aerosol (Schuit et al. Citation2020; Smither et al. Citation2020; van Doremalen et al. Citation2020). Infective airborne potential from human exhalation has been confirmed in other viruses, including respiratory syncytial virus, influenza and MERS-CoV (Yan et al. Citation2018; Lindsley et al. Citation2016).
Several online reports have attempted to examine the quantities of particulate matter expelled by participants performing a range of activities including singing but have struggled to accurately quantify aerosol and droplets because of the large number of background particulates in the environment. This is the largest study to date with the objective of comparing the relative amounts of aerosols (up to ∼10 µm diameter) generated by singing and speaking at the same loudness, and the first to present results from different genres, complementary to other studies with similar experimental aims (Alsved et al. Citation2020). We present results from a large cohort of 25 professional performers completing a range of exercises including breathing, speaking, coughing and singing in the clean air environment of an operating theater with laminar flow ventilation. Measurements of particle number concentration alone would be insufficient to determine the total amount of viral material capable of being transmitted: the total mass of particulate matter produced may be a key factor in assessing the potential risk. Thus, measurements of particle size distributions, as well as concentration, are used to assess the mass concentration.
Materials and methods
Experimental design
Aerosol concentrations were measured from singing, speaking and breathing in a zero-background environment. The cohort of 25 professional singers performed a broad range of genres, including musical theater (6), choral (5), opera (5), and other genres: gospel (2), rock (2), jazz (2), pop (1), actor with singing interest (1) and soul (1). 6 identified their voice-type as soprano or mezzo-soprano, 7 as alto, 5 as tenor and 7 as bass or baritone. Aerosol and droplet concentrations were measured with an Aerodynamic Particle Sizer (APS, 500 nm − 20 µm, see Aerosol Measurements) in an operating theater with each participant and researcher required to wear appropriate personal protective equipment (hospital scrubs, theater hat, and face mask if not the singing participant) (). The operating theater had an ultra-clean ventilation system (e.g., EXFLOW 32; Howorth Air Technology, Farnworth, UK) which generates a surgical canopy of filtered air vertically downwards. Typically, the filter runs at 50 Hz, leading to a high air exchange rate of 500–600 air changes per hour. This system reduced the preexisting particle background number concentration to zero cm-3. Thus, any particles detected were directly attributable to participant activity, with particle concentrations returning to zero cm-3 between periods of singing, speaking and breathing (). Temperature and relative humidity were typically 20 °C and 45%, respectively.
Figure 1. (a) An illustration of the sampling position of the performer, the sampling funnel and the aerosol instrumentation. (b) Continuous time series of data recorded from one participant completing 12 activities (5 repetitions of each). The zero-background is clearly apparent between measurements.
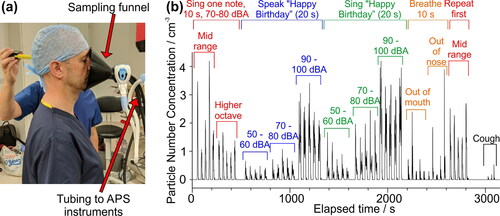
A standard operating procedure was adopted (see Vocalization experiments) covering 12 activities over ∼1 h, with each activity involving up to 5 repeat actions, with a 30 s pause between each repetition. These activities included breathing, coughing, singing single notes (“/ɑ/”) at different pitches, and speaking and singing the “Happy Birthday” song at different loudness. At the beginning of each action, participants stepped forward to the funnel () such that the dorsum of the nose was aligned to the plane of the base of the cone. Participant position relative to the funnel was monitored to ensure consistency (within 10 cm of the sampling tubes) across all measurements (). As in previous studies (Alsved et al. Citation2020; Asadi et al. Citation2019; Johnson et al. Citation2011), we report concentrations sampled through the collection funnel, which allows comparison of particle emission rates on a relative basis between activities. In reality, particle concentrations will become rapidly diluted once particles are exhaled, leading to strong spatial variations.
Human subjects
The Public Health England Research Ethics and Governance of Public Health Practice Group (PHE REGG) approved this study, and all research was performed in accordance with relevant guidelines and regulations of the Ethical Review Board. We recruited 25 healthy volunteers (12 males and 13 females), ranging in age from 22 to 57 years old (mean 38, SD +/- 9.8) through contact and collaboration with the entertainment industry. Informed consent was obtained from all participants prior to study participation. All participants completed a prescreening questionnaire including age, gender, professional status, singing training history and COVID-19 symptom status, to fulfill inclusion/exclusion criteria. Only participants who self-reported no symptoms of COVID-19 and who had normal temperatures on the day of attendance were included.
Aerosol measurements
Measurements were performed simultaneously with two APS instruments (APS 3321 from TSI Incorporated, MN, USA, sampled at 1 L min−1 with sheath flow 4 L min−1, Particle diameters 500 nm–20 µm) sampling from the same custom-printed funnel. A comparison of measurements between the two APS instruments was linear, with a slope that deviated from 1 owing to different sensitivities of the instruments (). Only aerosol concentrations sampled from one APS, the more sensitive of the two, are reported in this article. The loudness of vocalization was recorded in dBA using a decibel meter (UNI-T, UT353), positioned ∼30–40 cm in front of the participant at eye level.
The sampling funnel was 3 D printed from Polylactic acid (1.75 mm filament) by a RAISE3D Pro2 Printer (3DGBIRE). The funnel was 150 mm wide, 90 mm deep with ports at the neck for sampling aerosol into the two APS instruments. All tubing was conductive silicone and 130 cm in length (TSI Inc., product number 3001788, inner diameter 0.19 inch, outer diameter 0.375 inch).
Previous studies attempted to minimize the sampling distance between the participant and the APS detection region (Asadi et al. Citation2019); logistical constraints required that we instead used conductive tubing to sample the aerosol from the performer into the APS. Not only did this allow space for the subject to stand comfortably next to the aerosol instrumentation in a normal performance posture, but it facilitated rapid set-up and dismantling of the instrumentation, essential within the frequently used operating theater without the need for specialist platforms to mount the instruments. In addition, aerosol concentrations were measured in the same studies from brass and woodwind instruments; using flexible tubing facilitated the use of the same experimental set-up for both singing and for musical instrument, thus allowing direct comparison of aerosol concentrations between singer and instrumentalist. The conductive tubing was intentionally positioned to avoid tight curvature in the bends of the tube, maintaining a ratio of the radius of curvature (rc) to the inner tube radius (rt) greater than 50. Work by Cheng and Wang has reported that the impaction loss of aerosol number concentration passing around tube corners for rc/rt > 30 is less than 13% for the particles of diameter < 7 µm and less than 30% for the particles of diameter < 11 µm when sampled at the Stokes numbers and flow rates characteristic of the APS (Stokes numbers < 0.14 and < 0.36 for the lower and upper sizes, respectively) (Cheng and Wang Citation1981). We have measured the transmission efficiency of aerosol sampled through the funnel and conductive tubing and these data are reported and discussed in the online supplementary information (SI) (Figure S5). We did not make additional corrections to the sampled aerosol concentrations based on this transmission efficiency at different particle sizes.
Vocalization experiments
“/ɑ/” experiments
Participants voiced /ɑ/ (the vowel sound in ‘far’) for 10 s at 70–80 dBA in close proximity to the funnel followed by 30 s of nose breathing and standing 2 m away from the funnel, repeated four more times in succession. The participant repeated the series of five /ɑ/ vocalizations at the same amplitude using feedback from a decibel meter. Soprano/mezzo soprano singers sang note F4, alto note D4, tenor note F3 and baritone/bass note C3. After each set of experiments participants were asked to take a sip of water.
This set of experiments was repeated an octave above at 70–80 dBA. Soprano/mezzo soprano singers sang note F5, alto note D5, tenor note F4 and baritone/bass note C4. Timed prompts with directions for the requested vocalization were delivered by the researcher and immediate contemporary guidance given if the amplitude was out of range.
“Happy birthday” speaking experiments
Participants spoke the words of the “Happy Birthday” song to “Dear Susan” for 20 s at 50–60 dBA followed by 30 s of nose breathing and standing 2 m away from the funnel, repeated four more times in succession. The participants then repeated this sequence at 70–80 dBA and at 90–100 dBA.
“Happy birthday” singing experiments
Participants sang the “Happy Birthday” song to “Dear Susan” for 20 s at 50–60 dBA followed by 30 s of nose breathing and standing 2 m away from the funnel, repeated four more times in succession. The participants then repeated this sequence at 70–80 dBA and at 90–100 dBA. Soprano/mezzo soprano singers sang in B flat major (starting note F4, top note F5), alto in G major (starting note D4, top note D5), tenor in B flat major (starting note F3, top note F4) and baritone/bass in F major (starting note C3, top note C4).
Breathing experiments
Participants breathed for 10 s inhaling through the nose and exhaling through an open mouth in a non-forced “quiet” fashion, then stood 2 m away from the funnel for 30 s in between each breathing experiment and repeated four more times. An additional set of five breathing measurements were conducted in similar fashion but where the participants inhaled through the nose and exhaled out of the nose in a “quiet” fashion.
Confirmatory “/ɑ/” experiments
Participants voiced /ɑ/ (the vowel sound in ‘far’) for ten seconds at 70–80 dBA followed by 30 s of nose breathing and standing away 2 m away from the funnel, repeated four more times in succession. The participant repeated the series of five /ɑ/ vocalizations at the same amplitude using feedback from a decibel meter. Soprano/mezzo soprano singers sang note F4, alto note D4, tenor note F3 and baritone/bass note C3.
Coughing
Participants were asked to cough into the funnel once, stand 2 m away for 30 s and then repeat this process two more times.
Data and statistical analysis
Data analysis was performed by collating raw data of aerosol counts from the APS instruments in Microsoft Excel and Origin to analyze temporal trends in aerosol concentration, mass concentrations and size distributions. A software custom-written in LabVIEW was used to automate this process for improved efficiency of the data analysis. Measured total particle number concentrations were summed over the period of activity and divided by the duration of the activity, reporting a mean concentration (cm-3) with a standard deviation, i.e., the average concentration of particles sampled within the funnel volume during the activity. With coughs requiring <1 s, no averaging across a time-dependent concentration is possible and only the integrated number concentrations per single cough are reported. Further, particle size distributions were recorded by the APS at 1 s intervals, with 51 size bins equally spaced in the range 0.523 to 20 µm in log(diameter) space. Average size distributions were calculated first by determining the mean size distribution for each participant and then calculating the mean and standard deviation across all participant size distributions for each activity. Mass concentrations were calculated assuming particle density was 1000 kg·m-3. Our reported number concentrations and particle size distributions for speaking and breathing are consistent with previously published data (Asadi et al. Citation2019). We would caution the reader to recognize that, at the smallest particle sizes, the APS reported concentration is likely to be less accurate than that at the larger sizes. In particular, all particles smaller than 0.523 µm are put in a single size bin, providing no discrimination in size. That size bin (smaller than 0.523 µm) was excluded from the analysis in this study. Thus, we report aerosol concentrations from 51 size bins, ranging from 0.523 to 20 µm in diameter.
The lme package in R-software was used to fit linear random effect models with log-base-e transformed particle concentration or mass as the dependent variable. The independent variables were activity (where loudness was considered as part of activity) or vocalization (speaking or singing) and acoustic loudness (50–60, 70–80, and 90–100 dBA); the random effect was participant identification number in both cases. In the second analysis, an interaction term between vocalization and loudness was considered but not found to be significant, so the final model does not include such a term. In the Figures, the lower and upper hinges (ends of boxes) correspond to the first and third quartile (the 25th and 75th percentiles). The upper whisker extends from the upper hinge to the largest value but no further than 1.5 × IQR (where IQR is the inter-quartile range, the distance between the 1st and 3rd quartiles). The lower whisker extends from the lower hinge to the smallest value at most 1.5 × IQR. Data beyond the ends of the whiskers are “outlying points” and indicated in red. All components of the box plots were calculated based on the logarithmically transformed data, owing to lognormal nature of the data, but the plotted and tabular values reported are converted back to linear space for clarity.
Results and discussion
Aerosol number concentrations from singing compared with other expiratory activities
A complete analysis of the time-averaged total particle number and mass concentrations for all 25 participants is reported in and the absolute results summarized in ; data normalized to the aerosol concentration from speaking at 70–80 dBA are compared in and (see the SI). The aerosol number concentration generated across all participants took a log-normal distribution, consistent with the data presented in a previous publication; concentrations must always be positive-valued and a small number of individuals generate a significantly larger aerosol flux than the median (Asadi et al. Citation2019). This is particularly apparent for breathing, where measurements from individuals spanned almost three orders of magnitude. Indeed, 4 participants produced more aerosol in number concentration while breathing than while speaking at 90–100 dBA. The reproducibility of concentration from singing a single note (70–80 dBA) was not only apparent in single participant data (), but also across the cohort, with median concentrations in good agreement (0.83 and 0.91 cm-3 at beginning and end, respectively). Using a mixed effects model where loudness was implicit (i.e., was considered as part of the activity), at the lowest volume (50–60 dBA), neither singing (p = 0.19) nor speaking (p = 0.20) was significantly different in particle production to breathing, with median number concentrations of 0.10 (IQR 0.07–0.17), 0.19 (IQR 0.09–0.30), and 0.28 (IQR 0.07–0.64) cm-3 for speaking, singing and breathing, respectively. Where loudness is explicit and separate from activity a mixed effects model showed a statistically significant (p < 1 × 10⁻⁵) enhanced aerosol number concentration for singing when compared to speaking. This enhancement was small relative to the much larger changes associated with increase in loudness (p < 0.001). Aerosol number concentration increased by a factor of 10–13 as loudness increased from 50–60 dBA to 90–100 dBA, suggesting that shouting should be associated with little difference in risk to singing at loud volume. This result is comparable with that from previous works. For example, Asadi et al. who also observed a linear increase in the mean generated aerosol number concentration from speech with increasing sound pressure level (dBA) when reported in log space, as in . They reported a factor of ∼6.4 increase in particle number concentration generated by reading a passage of text at a ‘near yelling’ volume (95 dBA) compared to the lowest sound pressure they studied (60 dBA) (Asadi et al. Citation2019). Alsved et al. also observed an increase in aerosol production with increasing sound pressure for two types of vocalization at two volumes. Going from ‘normal’ to ‘high’ sound pressure led to a greater sampled aerosol flux for speech (270 to 570 particles.s−1, respectively) as well as for singing (690 to 980 particles.s−1) (Alsved et al. Citation2020).
Figure 2. (a) Box and whisker plot showing particle number concentration and (b) mass concentrations for the same series of activities for all 25 participants. See Methods section (“Data and Statistical Analysis”) for full description of analysis and reported values.
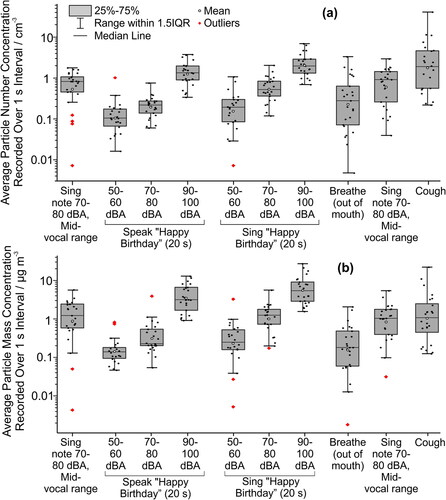
Table 1. The measured aerosol concentrations from different expiratory activities. Number concentration data correspond to the series of expiratory activities plotted in (in cm-3), and mass concentration correspond to the series of expiratory activities plotted in (in μg·m-3). Provided are the statistical parameters visualized by the box and whisker plots. Note that these parameters were calculated on the logarithmically transformed data (see Materials and Methods). The number of participants for each activity is given by n.
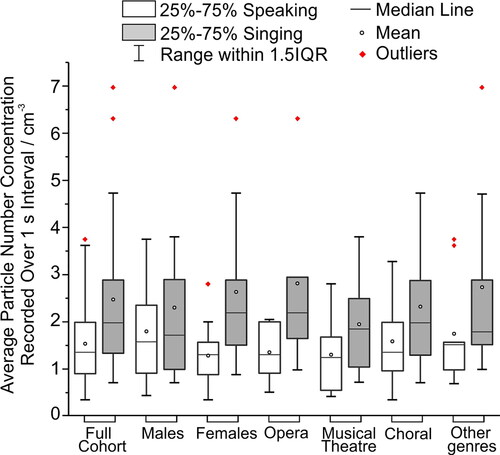
The aerosol number concentrations from speaking and singing at 90–100 dBA are compared in for male and female participants and for the different genres with the full cohort. Individual participant comparisons are provided in . Using linear mixed effect modeling and separate analyses for gender and genre, there were no significant differences in aerosol production either between genders (p = 0.34) or among different genres (p(choral different from “other genres”) = 0.46, p(musical theater different from “other genres”) = 0.25, and p(opera different from “other genres”) = 0.42). The variability among genres (almost a factor of 2 between the lowest and highest median concentrations) may be attributed to the small cohort sizes for each genre, the sensitivity of number concentration to loudness and a minority of participants emitting higher concentrations than others (who could be classed as super-emitters) (Asadi et al. Citation2019).
Figure 3. Comparison of average aerosol number concentrations (linear scale) from speaking and singing at 90-100 dBA by the full cohort, males (12), females (13), opera (5), musical theater (6), choral (5) and other genres (9).
Comparing the aerosol particle size distributions and mass concentrations
The possibility that singing, speaking and breathing generate aerosol particles of different sizes cannot be inferred by comparing particle number concentrations alone. Instead, we must compare the aerosol size distributions from these activities. Previously, two overlapping modes in the size distribution of particles from speaking and coughing have been identified (Asadi et al. Citation2019; Johnson et al. Citation2011). These have been attributed to distinct processes in this expiration process. The mode of lowest size is generated in the lower respiratory tract with a second mode generated in the region of the larynx, expected to be the most important in voicing. reports the variation in mean number concentrations with particle size averaged over the 25 participants and includes the fitted distribution from Johnson et al., reported from a cohort of 15 (Johnson et al. Citation2011).
Figure 4. (a) Comparison of the size distributions from singing (squares) and speaking (circles) at different levels of loudness (70-80 dBA red; 90-100 dBA gray/black) with breathing (green triangles). The size distribution reported for speaking by Johnson et al. (Citation2011) is shown by the blue line (right scale), data that should be most similar to the light red circles. The relative variations in concentrations represented by the two scales are equal. Error bars report standard error of the mean. The inset figure compares the fitted size distributions with the experimental data with a linear scale, as reported in Table S2 (SI). Shaded area about the fit line represents the 95% confidence bound of the fit. (b) Comparison of the size distributions in (a) normalized with respect to the highest measured value of dN/d log(Dp) for each dataset. (c) Size distributions of the aerosol measured from three individual participants when speaking 90–100 dBA, i.e., data contributing to the mean size distributions represented by gray circles in (a).
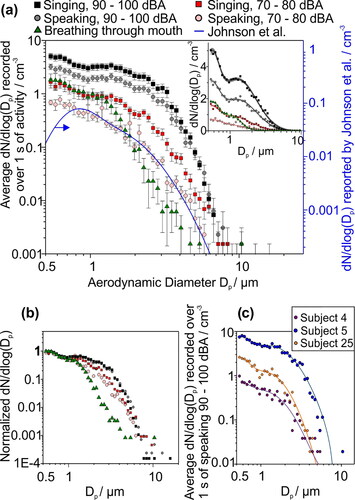
Johnson et al. considered the influence of evaporation on the recorded size distribution and the reduction in moisture content that occurs when particles are exhaled from the warm and humid respiratory tract (Asadi et al. Citation2019). They presented parameterizations for both the uncorrected measured size distribution and also assuming a correction to account for the effect of evaporation on the size distribution (Johnson et al. Citation2011). In our work, the diameters of the exhaled aerosol droplets can be assumed to have decreased significantly due to evaporation before they were detected by the APS, in much the same way as recognized by Johnson et al. Given the hygroscopic growth curves of respiratory fluids remain uncertain at the very high humidities of the lung, and the RH and temperature of the airflow entering the APS inlet is ill-defined, we have chosen not to attempt to correct our particle sizes but instead compare our size distributions with the uncorrected parameterization from Johnson et al. in . With an estimated transit time of ∼0.2 s from the sampling volume to the detector, we can assume that most of the size distribution had progressed fully or close to equilibration within this time window (Walker et al. Citation2021; Haddrell et al. Citation2019). Indeed, our distribution for speaking is in excellent agreement with the shape of the distribution reported by Johnson et al. for particles larger than 800 nm diameter up to above 7 µm in diameter, and this size distribution is very similar to our observed distribution for singing. Although the absolute concentrations were a factor of ∼6 larger in our measurements, it should be recognized that the absolute value carries little meaning, reflecting only the instantaneous value recorded by the APS from the sampling funnel, which will depend on the sampling specifications (Asadi et al. Citation2019).
Measured size distributions for speaking and singing were fitted to bimodal lognormal distributions, consistent with previous studies for speaking, breathing and coughing (Asadi et al. Citation2019; Johnson et al. Citation2011; Morawska et al. Citation2009). The fits for the different levels of loudness and types of vocalization all gave very similar mean diameters and variance for both the lower respiratory tract and laryngeal modes, further supporting the conclusion that speaking and singing can be treated similarly, generating particles of similar size distributions (Table S2, SI). However, both vocalizations generated larger particles than breathing: although the size distribution from breathing was well-represented by a bimodal lognormal distribution, the larger, laryngeal mode has shifted to a smaller diameter and had a narrower variance than for speaking and singing. The mean size distributions were normalized with respect to the greatest value of dN/d log(Dp) for each activity (), demonstrating the increase in concentration of particles generated in the laryngeal mode with respect to those from the lower respiratory tract, as vocalization loudness increased. compares the size distribution of particles generated from speaking at 90-100 dBA by three individual subjects that spanned the range in aerosol mass generated for this activity. The size distributions highlight the participant-to-participant variation, which spanned more than an order of magnitude in concentration of aerosol generated. However, the general shapes of the bimodal size distributions were similar in all cases with particles detected up to >10 µm diameter, albeit at very low concentration. The similarity in the size distributions ensured that robust comparisons about the relative mass concentrations of aerosols generated by speaking and singing at the same loudness could be made.
The consequences of different size distributions are apparent when aerosol mass concentration is reported (, see and S1, in the SI). This comparison is most important when considering the potential of the different activities to transmit infection. Speaking and singing generated statistically significant differences in mass concentrations of aerosol at similar level of loudness; however, these were modest (median singing values only a factor of 1.5–3.4 times larger than speaking) relative to the effects of the loudness of vocalization (a factor of 20–30 increase). Converting from a number concentration to a mass concentration for breathing, resulted in the mass concentration range shifting to lower values relative to speaking and singing, a consequence of the different size distributions associated with voicing and breathing (median values 24 and 36 times higher for speaking and singing at the highest loudness, respectively, compared with breathing).
Conclusions
This study demonstrates that the assessment of risk associated with the spread of SARS-CoV-2 in large groups due to respirable particles from speaking and singing should consider the number and mass concentrations of particles generated by these activities. The statistically significant, yet relatively modest differences detected between the type of vocalization at the loudest volume studied, were eclipsed by the effects of loudness on aerosol production, which varied by more than an order of magnitude from the quietest to loudest volume studied, whether speaking or singing. By contrast, the number of particles produced by breathing covered a wide range (spanning from quiet to loud speaking and singing) but has a size distribution shifted to smaller particle sizes, in principle mitigating some of the potential risk associated with the wider emission range. The results of this study are in agreement with that from Alsved et al., who studied the aerosol concentration generated from a cohort of twelve singers when they individually spoke or sang at two levels of sound pressure (Alsved et al. Citation2020). Singing was shown to generate a greater particle concentration than speaking at an equivalent sound pressure, but the increase in sound pressure showed a large increase in particle production for both types of vocalization. Our work confirms this conclusion across an increased cohort size that spanned varying musical genres.
We also found that a minority of participants emitted substantially more aerosols than others, sometimes more than an order of magnitude above the median, consistent with the long-tail of a log-normal distribution when viewed in linear-concentration space. This observation is consistent with a previous study (Asadi et al. Citation2019). However, the highest emitters were not consistently the highest across all activities, suggesting the magnitude of emission from an individual may be highly activity specific. It is unclear why some participants emitted substantially more than others, and further studies are required to better characterize the variability of aerosol emission across the population, as well as the consistency of emission from an individual over time.
These conclusions have important policy implications in the context of creating guidelines to reduce transmission of SARS-CoV-2. Breathing produces smaller particles than singing and speaking, suggesting that vocalization may carry higher risk than breathing if the potential SARS-CoV-2 dose delivered by an individual infected with the virus scales with particle mass. Size distributions are comparable across speaking and singing at the same loudness and generate relatively similar, yet statistically significantly different, numbers of particles. Most importantly, number concentrations from speaking and singing rise in parallel with increasing loudness. Given that speaking and singing produce numbers of particles of the same order of magnitude, and that increasing loudness increases that number by orders of magnitude, guidelines from public health bodies should focus on the loudness at which the vocalization occurs, the number of potentially infectious participants (source strength), the environment (ventilation) in which the activity occurs and the duration of the rehearsal and period over which performers are vocalizing (Charlotte Citation2020; Miller et al. Citation2020). For certain vocal activities and venues, amplification may be a practical solution to reduce the loudness of singing by the performers. Based on the differences observed between vocalization and breathing and given that it is likely that there will be many more audience members than performers, singers may not be responsible for the greatest production of aerosol during a performance, and for indoor events measures to ensure adequate ventilation may be more important than restricting a specific activity.
Author contributions
FKAG, NAW and CMO are joint first authors on this article. NAW, CMO, PLS, DC and JPR led in the study design and in securing funding. FKAG, BRB, and JPR collected the data. CMO, NAW and PLS prepared the application and secured ethical approval. NAW, CMO, DC and JC managed the registration and coordination of participant volunteers and secured access to the operating theaters. FKAG, LPM, AEH and BRB wrote analysis software and analyzed the data. TF, NG and GCD undertook the statistical analysis. JPR, DC, PLS and JC provided technical guidance and advice. JPR, BRB, NAW, CMO, DC, FKAG and LPM drafted the manuscript. All authors read and approved the final manuscript.
Supplemental Material
Download PDF (1.3 MB)Acknowledgments
We acknowledge the Working Group for The Investigation of ParticulatE Respiratory Matter to InForm Guidance for the Safe Distancing of PerfOrmeRs in a COVID-19 PandeMic (PERFORM). BRB acknowledges support from the Natural Environment Research Council through grant NE/P018459/1. Dyson, Inc., the Atmospheric Measurement and Observation Facility, and the Health and Safety Executive are acknowledged for APS loans. Fortius Clinic and Shoen Clinic are acknowledged for the provision of the operating theatre space to conduct the measurements. We acknowledge the BBC Singers, Eleven Management and the performers for volunteering to be included in this study. We acknowledge Public Health England and the Department for Digital, Culture, Media and Sport who acted as sponsor and funded the research, respectively.
Disclosure statement
The authors declare no competing interests.
Data availability
Correspondence and requests for materials should be addressed to JPR.
References
- Alsved, M., A. Matamis, R. Bohlin, M. Richter, P. E. Bengtsson, C. J. Fraenkel, P. Medstrand, and J. Löndahl. 2020. Exhaled respiratory particles during singing and talking. Aerosol Sci. Technol. 54 (11):1245–8. doi:https://doi.org/10.1080/02786826.2020.1812502.
- Asadi, S., N. Bouvier, A. S. Wexler, and W. D. Ristenpart. 2020. The coronavirus pandemic and aerosols: Does COVID-19 transmit via expiratory particles? Aerosol Sci. Technol. 1–4. doi:https://doi.org/10.1080/02786826.2020.1749229.
- Asadi, S., A. S. Wexler, C. D. Cappa, S. Barreda, N. M. Bouvier, and W. D. Ristenpart. 2019. Aerosol emission and superemission during human speech increase with voice loudness. Sci. Rep. 9 (1):1–10. doi:https://doi.org/10.1038/s41598-019-38808-z.
- Cai, J., W. Sun, J. Huang, M. Gamber, J. Wu, and G. He. 2020. Indirect virus transmission in cluster of COVID-19 Cases, Wenzhou, China, 2020. Emerg. Infect. Dis. 26 (6):1343–5. doi:https://doi.org/10.3201/eid2606.200412.
- Charlotte, N. 2020. High rate of SARS-CoV-2 transmission due to choir practice in France at the beginning of the COVID-19 pandemic. Journal of Voice. doi:https://doi.org/10.1016/j.jvoice.2020.11.029.
- Cheng, Y. S., and C. S. Wang. 1981. Motion of particles in bends of circular pipes. Atmos. Environ. 15 (3):301–6. doi:https://doi.org/10.1016/0004-6981(81)90032-9.
- Chia, P. Y., K. K. Coleman, Y. K. Tan, S. W. X. Ong, M. Gum, S. K. Lau, X. F. Lim, A. S. Lim, S. Sutjipto, P. H. Lee, Singapore 2019 Novel Coronavirus Outbreak Research Team, et al. 2020. Detection of air and surface contamination by SARS-CoV-2 in hospital rooms of infected patients. Nat. Commun. 11 (1):2800. doi:https://doi.org/10.1038/s41467-020-16670-2.
- Dernac, Z. 2018. DCMS Sectors economic estimates 2018 (provisional): Gross value added, 1–25. Department for Digital Culture Media & Sport. Accessed November 13, 2020. https://www.gov.uk/government/statistics/dcms-sectors-economic-estimates-2018-gva
- Guo, Z.-D., Z.-Y. Wang, S.-F. Zhang, X. Li, L. Li, C. Li, Y. Cui, R.-B. Fu, Y.-Z. Dong, X.-Y. Chi, et al. 2020. Aerosol and surface distribution of severe acute respiratory syndrome Coronavirus 2 in Hospital Wards, Wuhan, China, 2020. Emerg. Infect. Dis. 26 (7):1583–91. doi:https://doi.org/10.3201/eid2607.200885.
- Haddrell, A., G. Rovelli, D. Lewis, T. Church, and J. P. Reid. 2019. Identifying time-dependent changes in the morphology of an individual aerosol particle from their light scattering patterns. Aerosol Sci. Technol. 53 (11):1334–51. doi:https://doi.org/10.1080/02786826.2019.1661351.
- Huang, C., Y. Wang, X. Li, L. Ren, J. Zhao, Y. Hu, L. Zhang, G. Fan, J. Xu, X. Gu, et al. 2020. Clinical features of patients infected with 2019 novel coronavirus in Wuhan, China. Lancet 395 (10223):497–506. doi:https://doi.org/10.1016/S0140-6736(20)30183-5.
- Johnson, G. R., L. Morawska, Z. D. Ristovski, M. Hargreaves, K. Mengersen, C. Y. H. Chao, M. P. Wan, Y. Li, X. Xie, D. Katoshevski, et al. 2011. Modality of human expired aerosol size distributions. J. Aerosol Sci. 42 (12):839–51. doi:https://doi.org/10.1016/j.jaerosci.2011.07.009.
- Lednicky, J. A., S. N. Shankar, M. A. Elbadry, J. C. Gibson, M. Alam, C. J. Stephenson, A. Eiguren-Fernandez, J. G. Morris, C. N. Mavian, M. Salemi, et al. 2020. Collection of SARS-CoV-2 virus from the air of a clinic within a University Student Health Care Center and analyses of the viral genomic sequence. Aerosol Air Qual. Res. 20 (6):1167–71. doi:https://doi.org/10.4209/aaqr.2020.02.0202.
- Lindsley, W. G., F. M. Blachere, D. H. Beezhold, R. E. Thewlis, B. Noorbakhsh, S. Othumpangat, W. T. Goldsmith, C. M. McMillen, M. E. Andrew, C. N. Burrell, et al. 2016. Viable influenza A virus in airborne particles expelled during coughs versus exhalations. Influenza Other Respir Viruses 10 (5):404–13. doi:https://doi.org/10.1111/irv.12390.
- Liu, Y., Z. Ning, Y. Chen, M. Guo, Y. Liu, N. K. Gali, L. Sun, Y. Duan, J. Cai, D. Westerdahl, et al. 2020. Aerodynamic analysis of SARS-CoV-2 in two Wuhan hospitals. Nature 582 (7813):557–60. doi:https://doi.org/10.1038/s41586-020-2271-3.
- Lu, J., J. Gu, K. Li, C. Xu, W. Su, Z. Lai, D. Zhou, C. Yu, B. Xu, and Z. Yang. 2020. COVID-19 outbreak associated with air conditioning in restaurant, Guangzhou, China, 2020. Emerg. Infect. Dis. 26 (11):2789–23. doi:https://doi.org/10.3201/eid2607.200764.
- Miller, S. L., W. W. Nazaroff, J. L. Jimenez, A. Boerstra, G. Buonanno, S. J. Dancer, J. Kurnitski, L. C. Marr, L. Morawska, and C. Noakes. 2020. Transmission of SARS‐CoV‐2 by inhalation of respiratory aerosol in the Skagit Valley Chorale superspreading event. Indoor Air 1–10. doi:https://doi.org/10.1111/ina.12751.
- Morawska, L., and J. Cao. 2020. Airborne transmission of SARS-CoV-2: The world should face the reality. Environ. Int. 139 (April):105730 doi:https://doi.org/10.1016/j.envint.2020.105730.
- Morawska, L., G. R. Johnson, Z. D. Ristovski, M. Hargreaves, K. Mengersen, S. Corbett, C. Y. H. Chao, Y. Li, and D. Katoshevski. 2009. Size distribution and sites of origin of droplets expelled from the human respiratory tract during expiratory activities. J. Aerosol Sci. 40 (3):256–69. doi:https://doi.org/10.1016/j.jaerosci.2008.11.002.
- Nicas, M., W. W. Nazaroff, and A. Hubbard. 2005. Toward understanding the risk of secondary airborne infection: Emission of respirable pathogens. J. Occup. Environ. Hyg. 2 (3):143–54. doi:https://doi.org/10.1080/15459620590918466.
- Pan, Y., D. Zhang, P. Yang, L. L. M. Poon, and Q. Wang. 2020. Viral load of SARS-CoV-2 in clinical samples. Lancet. Infect. Dis. 20 (4):411–2. doi:https://doi.org/10.1016/S1473-3099(20)30113-4.
- Papineni, R., and F. Rosenthal. 1997. The size distribution of droplets in the exhaled breath of healthy human subjects. J. Aerosol Med. 10 (2):105–16. doi:https://doi.org/10.1089/jam.1997.10.105.
- Santarpia, J. L., D. N. Rivera, V. L. Herrera, M. J. Morwitzer, H. M. Creager, G. W. Santarpia, K. K. Crown, D. M. B. Major, E. R. Schnaubelt, M. J. Broadhurst, et al. 2020. Aerosol and surface contamination of SARS - CoV-2 observed in quarantine and isolation care. Sci. Re. 10: 1–8. doi:https://doi.org/10.1038/s41598-020-69286-3.
- Schuit, M., S. Ratnesar-Shumate, J. Yolitz, G. Williams, W. Weaver, B. Green, D. Miller, M. Krause, K. Beck, S. Wood, et al. 2020. Airborne SARS-CoV-2 is rapidly inactivated by simulated sunlight. J. Infect. Dis. 222 (4):564–71. doi:https://doi.org/10.1093/infdis/jiaa334.
- Smither, S. J., L. S. Eastaugh, J. S. Findlay, and M. S. Lever. 2020. Experimental aerosol survival of SARS-CoV-2 in artificial saliva and tissue culture media at medium and high humidity. Emerg. Microbes Infect. 9 (1):1415–7. doi:https://doi.org/10.1080/22221751.2020.1777906.
- Tellier, R., Y. Li, B. J. Cowling, and J. W. Tang. 2019. Recognition of aerosol transmission of infectious agents: A commentary. BMC Infect. Dis. 19 (1):1–9. doi:https://doi.org/10.1186/s12879-019-3707-y.
- van Doremalen, N., T. Bushmaker, D. H. Morris, M. G. Holbrook, A. Gamble, B. N. Williamson, A. Tamin, J. L. Harcourt, N. J. Thornburg, S. Gerber, et al. 2020. Aerosol and surface stability of SARS-CoV-2 as compared with SARS-CoV-1. N. Engl. J. Med. 382 (16):1564–7. doi:https://doi.org/10.1056/NEJMc2004973.
- Walker, J. S., J. Archer, F. K. A. Gregson, S. E. S. Michel, B. R. Bzdek, and J. P. Reid. 2021. Accurate representations of the microphysical processes occurring during the transport of exhaled aerosols and droplets. ACS Cent. Sci. 7 (1):200–9. doi:https://doi.org/10.1021/acscentsci.0c01522.
- Woelfel, R., V. M. Corman, W. Guggemos, M. Seilmaier, S. Zange, M. A. Mueller, D. Niemeyer, P. Vollmar, C. Rothe, M. Hoelscher, et al. 2020. Virological assessment of hospitalized patients with COVID-2019. Nature. 581:465–9. doi:https://doi.org/10.1038/s41586-020-2196-x.
- World Health Organisation. 2020. WHO Coronavirus disease (COVID-19) Dashboard. Accessed November 13, 2020. https://covid19.who.int/
- Wu, A., Y. Peng, B. Huang, X. Ding, X. Wang, P. Niu, J. Meng, Z. Zhu, Z. Zhang, J. Wang, et al. 2020. Genome composition and divergence of the novel Coronavirus (2019-nCoV) originating in China. Cell Host Microbe. 27 (3):325–8. doi:https://doi.org/10.1016/j.chom.2020.02.001.
- Wu, Z., and J. M. McGoogan. 2020. Characteristics of and important lessons from the Coronavirus Disease 2019 (COVID-19) outbreak in China: Summary of a Report of 72314 Cases From the Chinese Center for Disease Control and Prevention. JAMA 323 (13):1239–42. doi:https://doi.org/10.1001/jama.2020.2648.
- Xie, X.,. Y. Li, A. T. Y. Chwang, P. L. Ho, and W. H. Seto. 2007. How far droplets can move in indoor environments-revisiting the Wells evaporation-falling curve. Indoor Air. 17 (3):211–25. doi: https://doi.org/10.1111/j.1600-0668.2006.00469.x.
- Yan, J., M. Grantham, J. Pantelic, P. J. B. De Mesquita, B. Albert, F. Liu, S. Ehrman, and D. K. Milton, EMIT Consortium. 2018. Infectious virus in exhaled breath of symptomatic seasonal influenza cases from a college community. Proc. Natl. Acad. Sci. USA. 115 (5):1081–6. doi:https://doi.org/10.1073/pnas.1716561115.
- Zayas, G., M. C. Chiang, E. Wong, F. MacDonald, C. F. Lange, A. Senthilselvan, and M. King. 2012. Cough aerosol in healthy participants: Fundamental knowledge to optimize droplet-spread infectious respiratory disease management. BMC Pulm. Med. 12(March), article number 11. doi:https://doi.org/10.1186/1471-2466-12-11.