
 ?Mathematical formulae have been encoded as MathML and are displayed in this HTML version using MathJax in order to improve their display. Uncheck the box to turn MathJax off. This feature requires Javascript. Click on a formula to zoom.
Abstract
Three portable dilution devices (a two-stage dilutor, a one-stage dilutor and an axial dilutor) and a stationary dilution tunnel were compared by employing them in an experimental setup for particle emission measurements from a 40 kW pellet boiler. Total concentrations and number size distributions of particles were detected by an ELPI + analyzer. Averaged values of total particle emission per MJ received from measurements with available dilution devices were within the range between 3.14 × 10¹³ and 1.15 × 10¹⁴ for the full power regime, and between 1.54 × 10¹³ and 5.03 × 10¹³ for the reduced power regime. Measured particle concentrations decreased by using dilution devices in the following order: a two-stage dilutor, a one-stage dilutor, a dilution tunnel and an axial dilutor. The number size distributions of particles for the majority of cases are qualitatively similar for all devices for similar combustion regimes of the boiler. Applying dilution air with or without heating did not significantly affect the results of measurements. During multiple series of measurements the degree of dilution was varied when possible for different devices within a range between 8 and 102. No dependence of particle concentrations on the degree of dilution could be determined from these experiments. Applying a method of one-way analysis of variance revealed the statistically significant difference in particle concentrations measured with different dilution devices. Implementing this method to CO, and CO2 gas emission components of different series it was determined that the boiler operation was stable as the measured data belong to the same distribution. Thus, the statistical differences in particle concentrations most likely relate to the varied measuring equipment, i.e., dilution devices.
Copyright © 2021 American Association for Aerosol Research
1. Introduction
Various aspects of exploitation of the biomass-fired devices of small scale are presently of significant interest. This is motivated by the intention to produce sustainable energy and partially replacing fossil fuels with biomass fuels. For this type of combustion devices, it is also important to monitor the exhaust gases that include small particle emissions (Garcia-Maraver et al. Citation2014; Fournel et al. Citation2015; Wilnhammer et al. Citation2017; Fernandes and Costa Citation2012; Forbes et al. Citation2014).
Existing EU standards limit the particle emissions in terms of total mass concentrations of PM10 (EN 13284-1, 2002). However, much attention is also focused on expansion of this approach to standard characterization of number concentrations and size distributions of particles (Kinsey, Kariher, and Dong Citation2009; Fine, Cass, and Simoneit Citation2001; Boman Citation2005; Brunner Citation2006). As it is discussed by numerous literature sources, the fine particles (smaller than 1 μm) are found to be rather active agents considering an impact on the environment as well as to be harmful to human health (World Health Organization Citation2006; Bølling et al. Citation2009; Lamberg et al. Citation2011). At the same time this fraction is significantly dominant if measured in numbers but much less significant in mass proportion. Variations of the number concentrations of particles released from the biomass combustion devices for the domestic heating are rather large, the range is within 107–1010 particles per Ncm3 (Johansson et al. Citation2003). Those levels of concentrations are usual when secondary measures of particle removal technology are not in use due to operational and security restrictions related to carbon content in exhaust gases, which is significant for residential biomass combustion, as well as cost efficiency reasons (Oser and Nussbaumer Citation2006; Nussbaumer Citation2010).
Composition of particles emitted from the biomass combustion has been a subject of many studies. Apparently, formation of particles depends on the initial composition of the biomass fuels, as well as combustion conditions and conditions in the flue gases, as discussed for example by Jöller, Brunner, and Obernberger (Citation2005). For the combustion of wood pellets, the particle emission, expressed in mass concentrations, mainly consists of inorganic salts, with great majority of chlorides and sulfates of alkali and earth alkaline metals. Considering the size distribution, the salts of alkali elements, mostly potassium are dominant in a fine particle fraction and the salts of earth alkaline elements, mostly calcium and magnesium are dominant in a coarse particle fraction (Sippula et al. Citation2009). Due to specificity of the biomass combustion (Lamberg et al. Citation2011), certain amounts of organic materials and elemental carbon can also be a part of particle emission (Sippula et al. Citation2007). Tissari et al. (Citation2008) found that the fractions of those substances in PM1 did not exceed 15% and significantly vary depending on the regime of combustion device. Lead, a number of transitional elements and nonmetals can also be typically traced in the particle emission (Sippula et al. Citation2009).
Measurements of particle emissions in terms of number concentrations require a setup consisting of several elements. Essentially, that should be a probe, providing sampling particles, an analyzer measuring the particle concentration and an inherent part – a dilution device. Usually its function is to condition the sample before a measuring device to keep the concentration of particles in the sample within the measuring limit, to decrease the temperature of the sample and to reduce the moisture content.
The aerosols emitted from the combustion process undergo continuous modifications. Particles can be unstable changing in size and composition during the combustion, inside the stack and after releasing to the atmosphere (Lipsky and Robinson Citation2006). For example, transformation of many organic species from the gas phase to aerosol is strongly temperature dependent (Hildemann, Cass, and Markowski Citation1989). Variations in degree of dilution is another important aspect affecting aerosol properties. The particles released directly to the atmosphere are diluted approximately as much as 104 times (Zhang and Wexler Citation2004). But a degree of dilution for the devices used for the experimental measurements does not usually exceed 200 (Lipsky and Robinson Citation2006). Consequently, it does not reproduce the real atmospheric dilution of the flue gases. Thus, the dilution device should be selected to provide acceptable results in accordance with the objectives of measurements, as indicated by Lyyränen et al. (Citation2004). In many examples it can be a conservation of sample taken at the certain point of the stack, which is related to another imperative role of dilution to reduce the chemical interaction within the sample to be delivered to the measuring device without significant modifications (Biswas and Thimsen Citation2011).
Reporting the emissions of particles from different sources including biomass combustion in terms of the mass fractions is obviously rather deficient and should be complemented with measurements in terms of number concentrations. There are several techniques, available on the market, to measure the number concentrations of particles that incorporate the dilution of sample, but their impact on the measuring results was not completely demonstrated and the existing information on the comparison of those devices is insufficient and relatively fragmented. Most often studies on particle emissions use the technique with only one dilution device.
Thus, this work was directed to a rather practical aspect with an objective to compare the measurements of particle emission from biomass combustion of a domestic scale appliance with available, most common types of dilution devices and to estimate the effect of these devices on the measurements of the particle number concentration and particle size distribution. Influences of a degree of dilution and temperature of the dilution air as well as different regimes of the combustion device on the measuring results are considered. A given approach of applying a present group of devices generally intends to demonstrate their comparative functional features without detailed analysis of the impact on the particle measurements. This work rather contributes to an overall purpose for the regularization of the measuring method of particle emission.
2. Material and methods
Emissions of a domestic heating appliance were studied in laboratory conditions in this work. Several conventional dilution devises were available for experimental measurements. They include one stationary and three portable systems employing respectively a complete or partial dilution of the exhaust gases. As amount of other equipment units was limited, the measurements practically were possible to carry out using each dilution devices at a time. Descriptions of the dilution devices and an entire experimental setup are given below. The experimental setup and the dilution devices used in this study are represented in .
Figure 1. Laboratory setup and the dilution devices. Left side of the image: The boiler installation and the dilution tunnel. Right side of the image: portable dilution devices. Schematic images of the dilution devices adopted from Lyyränen et al. (Citation2004), Palas (Citation2007), Dekati (Citation2010) and CEN/TS 15883 (Citation2009).
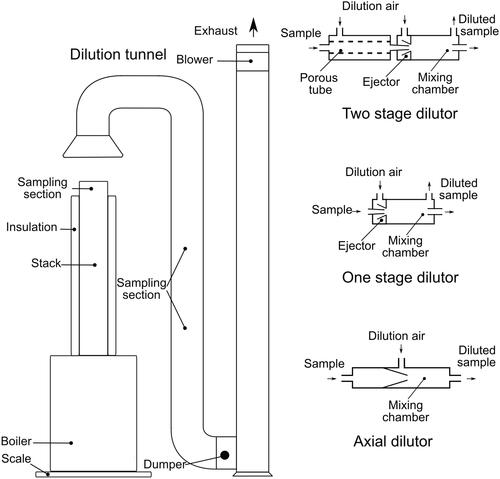
2.1. Laboratory installation
A multifuel pellet boiler with 40 kW nominal power output was set up for this study. During a regime of combustion it produced relatively constant concentrations of particle and gas emissions. The pellets from the storage compartment were fed to the combustion chamber by means of a step rotating auger. The air flow to the combustion chamber was provided by a blower fan. Values of time between pulses of rotation of the auger and the blower fan intensity in percent in certain ranges could be adjusted from a front panel of the boiler to establish necessary power output. Either constant power regime or automatic regime of the boiler can be used. During the real life operation the boiler is usually set to the automatic regime, which regulates the temperature of the heated water varying between the full (100%) and reduced (30%) power outputs. Settings of those regimes, i.e., the air and fuel supplying rates are determined by testing and recommended by a supplier. To control steady parameters of gas and particle emission, the automatic regime was not used during these tests. The boiler was placed on a scale with a measuring range of 1500.0 ± 0.1 kg to measure a biomass fuel consumption rate.
The commercially available softwood pellets were used as fuel. Pellets were approximately 6 mm in diameter, produced from ground to sawdust material without additives. Main composition of the fuel material determined by means of the ultimate and proximate analysis as well as the higher heating value (HHV) are given in . The concentrations of elements are in dry mass percent, the moisture is in wet mass percent.
Table 1. Elemental chemical composition, moisture content and heating value of the wood pellets.
The exhaust gases passed through a stainless steel stack before entering the dilution devices. The stack dimensions were 2 m in length and 250 mm in diameter, it was insulated with glass wool covered with aluminum foil. While using partial flow dilution devices, the particle emissions were sampled from the upper section of the stack, approximately at a distance of 10 cm from the edge of the stack tube. At the entrance of each device a nozzle of several centimeters was directly connected to be introduced into the stack, so that during the measurements dilutors were situated in close vicinity from the sampling point. The flue gas temperature near the sampling points was measured by a thermocouple. It was in a range of 190–200 °C. The gas sampling was taken near the exit of the boiler stack too. The installation of elements, testing conditions and measuring technique were adopted from the EN 13229 (Citation2007) standard.
The sampling from the dilution tunnel (DT) was carried out by a probe made of conductive material placed at the appropriate sampling opening of the tunnel defined by the CEN/TS 15883 (Citation2009). The temperature of diluted gases was around 40–50 °C.
Laboratory pressurized air was used for the partial flow dilution of the sample. The dilution air passed a cascade of filters to remove the excess of dust, moisture, and oil droplets, decreasing the concentration of particles to 5 × 102 cm−3. At each impactor stage of the ELPI + it was below or near the lower detection limit. In the DT the sample was diluted by the room air without filtration. The concentration of particles in the room air measured by ELPI + did not exceed 5 × 103 cm−3.
Concentrations of carbon dioxide and oxygen of the flue gas in the stack were monitored using either Horiba PG350 or Horiba PG250 gas analyzers, concentrations of carbon dioxide in a diluted sample were measured with either Vaisala Carbocap GMP 343 or Horiba PG250 gas analyzers. All measurements were performed with a dry sample technique. To determine the dilution ratios (DRs), as described below, the obtained values were recalculated to the wet basis using the measurements of FTIR for water vapor concentrations in the stack and in the ambient air recorded either before or after the actual series of measurements. There could be differences between the directly measured wet basis concentrations of CO2 and recalculated using dry basis measured concentrations of CO2 (Giechaskiel, Zardini, and Clairotte Citation2019). However in this study, the dry basis of CO2 was corrected with the direct H2O measurements of FTIR during the stable boiler operation regimes, the produced error on the DR can be assumed to be small. The differences of the DRs on the wet and dry basis are determined in a rage of 10% for different dilution devices.
For all experiments the DRs as described below were always reported during the actual measurements. Carbon dioxide diluted with nitrogen at either 9% or 4000 ppm from Air Liquide gas bottles, purified nitrogen and a mixture of artificial air from Westfalen gas bottles were used for calibrations.
A Gasmet FTIR analyzer was used to measure a flue gas composition. Measurements were carried out by the wet sample technique, with a dust filter, heated sample lines and a heated pump set before the analyzer. The data of water concentrations in the flue gases together with data of the fuel chemical analysis were used to calculate particle emission factors. Emission of particles was detected by an Electrical Low Pressure Impactor (ELPI+), Dekati (Citation2016). It includes 14 separating stages with replaceable Aluminum substrates. Greasing was not applied during the tests. The device can measure particle number concentrations as well as their size distributions in a range of aerodynamic diameters from 0.006 to 10 μm. The present work focuses on determination and comparison of the combination of those parameters. To represent the particle concentrations, the results of direct ELPI + measurements are recalculated using the conventional density value of 2 g/cm3 as suggested for example by Pagels et al. (Citation2002).
Anisokinetic sampling was applied during this study. It is well demonstrated that the isokinetic conditions are important for particles larger than few μm (Angelo Citation2008; Mertens et al. Citation2020). As the size of particles is considered, the coarse fraction of emission from biomass combustion is rather small. These experiments demonstrate that the number concentration of particles, exceeding 1 μm, is less than 1% of total amount of particles, which is less than the measuring error and can be neglected. Thus, the isokinetic sampling was not mandatory (Gaegauf et al. Citation2015).
Measured by FTIR vapor in the stack was typically between 8 and 10 vol.%. However, in the diluted sample the condensation could not be expected as the concentration of moisture was below a dew point at measuring conditions (at about room temperature and atmospheric pressure) even at the smallest degree of dilution used in this study for the portable dilution devices. For the DT at the above mentioned temperature of sampling and the degree of dilution between 9 and 20 the condensation could not be expected as well. That was assumed for the finally mixed gas conditions. At the intermediate phases of dilution some condensation can occur introducing certain deviation into the DR. However, the FTIR measurements indicated that those deviations were insignificant.
2.1.1. Two-stage dilutor
The device (built by Venacontra) consists of two stages, a porous tube dilutor and an ejector dilutor (ED). The device is similar to the PRD + ED, as described by Lyyränen et al. (Citation2004). At the 1st stage the sample gas passing along the tube while dilution air either at room temperature or heated to 150 °C traverses the tube porous media. This 1st stage provides a variable DR up to 10. The subsequent dilution happens in the ED which functioned also as a pump providing the suction of the sample. The overall DR after this stage can vary significantly from 20 up to 200. Two Aalborg mass flow controllers with full scale output of 20 and 200 l/min provide the dilution air flow rates. The DR is determined from the concentrations of carbon dioxide measured in the stack and diluted sample using the following equation:
(1)
(1)
where CO2,RG – concentration in the raw gas, CO2,S – in the diluted sample and CO2,BG – the background concentration, i.e., the concentration of carbon dioxide in the ambient air.
2.1.2. One-stage dilutor
Palas VKL–10E ED was used (Palas Citation2007). The device is working by means of continuous flow of a pressurized clean air through the ejector nozzle involving the sampled gas into the plenum chamber and further homogeneous mixing. The DR of the sample and ejected clean air is always predetermined and stable. A manufacturer provides following formulas estimating the relation between the DR and flow rates.
(2)
(2)
(3)
(3)
where Vtot – a total volume flow rate, Vin – an inlet volume flow rate and Vd – a dilution air volume flow rate. The DR of the device predetermined for Nitrogen is equal to 10. Employing the laboratory compressed air alters the DR to be around 11–13. The value remains constant independently on the flow rate of the dilution air. Several measurements were nevertheless controlled by measuring the ratio of the carbon dioxide in the raw and diluted samples. An estimated value of DR equal to 11.5 was applied for the measurements without CO2 control.
2.1.3. Axial dilutor
The Dekati DAD–100 (AD) device was employed. This dilutor operates by means of introducing an admixture of the dilution air to the raw sample in a specified proportion (Dekati Citation2010). The device is supplied with an optional electrical heater for the dilution air. To determine the DR the following method was used. The flow rate of the dilution air Vd was slowly decreased stepwise till it was equal to the suction flow rate of the ELPI+, VELPI+. It was determined by appearing the signal of the particle concentration. The flow rate of the dilution air was further decreased to reach various DRs calculated as
(4)
(4)
Several tests, however, were conducted with additional crosschecking of the DR by measuring a tracer gas concentration (CO2) in the raw and diluted sample. In those cases the dilution air flow rate was regulated by the Aalborg mass flow controller with 20 l/min of the full scale output. Both ways with and without CO2 control demonstrated similar results.
2.1.4. Dilution tunnel
A DT was built according to the requirements of the European Technical Specification CEN/TS 15883 (Citation2009), an accepted Norwegian particle testing method. The ventilator with the varied flow rate provides the air flow from the evacuation hood through the tunnel to the outside smoke funnel. The hood is placed over the boiler stack and it can be adjusted in height to capture the smoke. Positioning the hood, varying the ventilator rate and changing dumper opening (an iris orifice diameter in this case) attributed to the tunnel, a DR can be changed. The value of the DR was determined by measuring the CO2 concentrations of the raw and diluted exhaust gases (see EquationEquation (1)(1)
(1) ).
2.2. Test layout
Emission of particles and gas components during different regimes of combustion were measured. Tests were carried out when the boiler was operated at the full and reduced power outputs recommended by the supplier. Additionally, several regimes of poor combustion with altered settings of the air flow and fuel feed rates were tested.
Records of gaseous and particle concentrations were lasted from 5 to 40 min for every dilution device when the combustion process reached stable phases. An example of records, represented in , demonstrate the complete series of measurements of emission from the boiler operating at full power. Periods of using different devices could be distinguished: a two-stage dilutor used initially with two different DRs; then a one-stage dilutor with fixed DR; an axial dilutor with and without CO2 measurements to control the DR used as indicated during last two periods. Total particle concentrations are given as a multiplication product of the direct measurements by the corresponding DRs. The multiplication of the total particle number concentrations by the DRs also resulted in the amplification of data scattering. The CO2 concentrations from both, the raw and diluted samples are shown in a lower graph. Different concentrations of CO2 in the diluted sample indicate the variations of the DR. Average particle concentrations corresponding to each period are rather stable, demonstrating insignificant influence of the DR on the concentration records. Series of measurements were not consecutive, they were carried out in total for a number of days during several months. The test routine was similar, the dilution devices were sequentially varying. However, it is not useful to represent in this article all-time records. A complete list of tests performed in this study is shown in .
Figure 2. A series of measurements of total particle concentrations and measurements of CO2 concentrations of the raw and diluted samples. Particle concentrations are given as the multiplication product of the direct measurements by the corresponding DRs. Records are given for two-stage dilutor, one-stage dilutor and an axial dilutor.
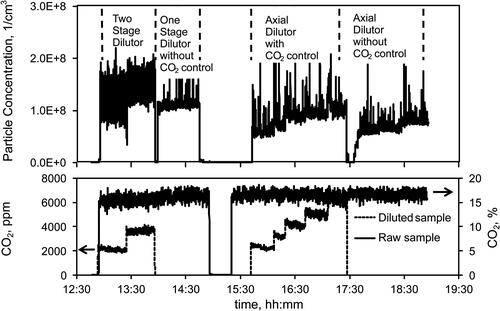
Table 2. Tests carried out with different dilution devices.
3. Results and discussion
3.1. Particle number size distributions
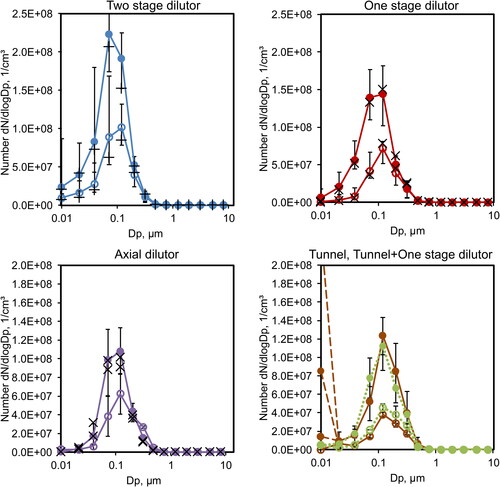
Particle number size distributions grouped by different dilution devices are represented in . Shapes with lines are the average values of results obtained at the full power regime (solid circles and lines) and reduced power regime (open circles and lines). Error bars show the minimum and maximum measured values for every stage of impactor. The concentration maxima at the full power regime are systematically higher than those of the reduced power regime in all studied cases. For all dilution devices, results demonstrate similarities in number size distributions of emitted particles. The distributions obtained from the measurements at the low power regime qualitatively resemble to those of the full power regime. For the convenience of reading, all values of concentration represented in the text below are given for the full power regime.
Figure 3. Number size distribution of particle emissions from the boiler measured with different dilution devices. Circles and solid lines represent averages of tests for two-stage dilutor, one-stage dilutor, axial dilutor and dilution tunnel; circles and dotted lines (green) represent dilution tunnel combined with one-stage dilutor. Solid circles – full power regime; open circles – reduced power regime. Individual tests: Crosses – cold dilution air applied for the 1st stage of two-stage dilutor. Diagonal crosses – hot dilution air (150 °C) applied for the one-stage dilutor and axial dilutor. Dashed lines indicate irregularly of elevated values for the 1st stage of impactor for some series of measurements. The particle sizes are given as geometric means of the ELPI stages.
3.1.1. Two-stage dilutor
Among all dilution devices, the highest concentration maxima are observed for the two-stage dilutor. Different series of tests give maxima either at 4th (0.072 μm) or 5th (0.121 μm) stages of impactor. The particle sizes are given as geometric means. Averages (and standard deviations, hereafter) for those stages are calculated respectively as 2.23 × 10⁸ ± 3.29 × 107 cm−3 and 1.91 × 10⁸ ± 4.38 × 107 cm−3. Distributions measured using two-stage dilutor are characterized by elevated values of particle concentrations at the 1st (0.010 μm) and the 2nd (0.021 μm) stages of impactor. At the 1st stage an average concentration is 2.32 × 10⁷ ± 2.70 × 107 cm−3. Some measurements give concentrations higher than 4.5 × 107 cm−3, up to 8.6 × 107 cm−3. Such values can be a result of occasional malfunctioning of the two 1st stages of the impactor. The model of ELPI + used in these experiments does not have an option of impactor heating. In this case, due to pressure discharge, the first two stages get rather cold as compared to the other stages. The condensation can occur on the outside surface of those stages of impactor which is in contact with the ambient air, obviously depending on the current atmospheric air conditions. In several instances this effect was observed during the experiments. Perhaps the condensed moisture can affect the electric current values generated by the stages. However, majority of measurements produce rather compact range of concentration values. Thus, one can assume that the implementation of two-stage dilutor better preserves a fine particle fraction sampled from the stack. Concentrations of coarse particles detected at the 10th (1.233 μm)−14th (8.157 μm) stages of impactor as expected are significantly lower than others, with average values below 1.20 × 105 cm−3. Most of the measurements were performed with the heated dilution air of the 1st stage. However, applying the dilution air without heating (at room temperature) did not produce any significant effect on the measuring results.
3.1.2. One-stage dilutor
Similar to the previous case, the number size distributions measured with the one-stage dilution device have maxima either at 4th or 5th stages of impactor. Average values are respectively at 1.39 × 10⁸ ± 2.10 × 107 cm−3 and 1.44 × 10⁸ ± 2.70 × 107 cm−3. At the 1st (0.010 μm) impactor stage an average concentration is 6.18 × 10⁶ ± 7.35 × 106 cm−3. Some distinct measurements give values close to zero for this stage of impactor. However, no degradation of the signal in time as well as no dependency of this phenomenon on the period when the measurements were taken could be indicated. Concentrations of particles at the 10th − 14th stages of impactor have average values below 1.20 × 105 cm−3. As in the case of the two-stage dilutor this particle number size distributions are qualitatively similar for all combustion regimes. No differences of measurements performed with and without heating of the dilution air at 150 °C can be demonstrated.
It is reported that when a heated dilution stage is used, most volatile organic compounds remain present in the gas phase (e.g., Fachinger et al. Citation2017; Lim et al. Citation2015). However, the fraction of volatile compounds from pellet combustion is expected to be low (e.g., Bäfver et al. Citation2011; Fachinger et al. Citation2017; Tissari et al. Citation2008), so that the measurements are not sensitive to the temperature variations of the dilution air applied in this study.
3.1.3. Axial dilutor
In the case of the axial dilutor the concentration maxima are also either at 4th or 5th stages of impactor. Average values for those impactor stages are at 9.83 × 10⁷ ± 2.75 × 107 cm−3 and 1.08 × 10⁸ ± 2.10 × 107 cm−3 respectively. Concentrations of fine particles measured using this dilutor are very low, at the 1st stage in most cases they are equal to zero. Coarse particles concentrations measured at the 10th − 14th stages of impactor have average values below 1.20 × 105 cm−3, i.e., within the instrument detection limit. In few cases, when dilution air was heated at 200 °C the maximum concentrations shifted toward the bigger diameters of the 6th (0.203 μm) and 7th (0.317 μm) stages of impactor. The distribution profile peaks are enlarged. It could be assumed that the hot dilution air resulted sometimes in heating up the sample gases above the temperature acceptable for the ELPI + analyzer that caused distorted results. Those tests were rejected from this study. In other cases with applying heating of the dilution air, the temperature was kept at 150 °C and it did not affect the measuring results.
3.1.4. Dilution tunnel
Series of measurements using the DT and the DT combined with one-stage dilutor were carried out. They are represented in a correspondent graph of , respectively, by the shapes with solid and dotted lines. The particle number size distributions quite resemble to the previous cases of portable dilutors, the concentration maxima located mostly at 5th stage of impactor with an average value of 1.23 × 10⁸ ± 2.63 × 107 cm−3. The concentrations of fine particles at the 1st stage are close to zero. Some series of measurements demonstrate very high records of concentrations at the 1st stage, perhaps, as mentioned before, due to malfunctioning of this part of equipment (in the graph highlighted with dotted lines). Concentrations of the coarse particles measured at the 10th − 14th stages of impactor are also low, having average values below 2.50 × 104 cm−3.
The distribution profiles using the DT and DT combined with one-stage dilutor are practically similar in shape and fit in with a range of concentration values. Thus, the influence of the one-stage dilution device in this case is negligible as compared to the DT.
Based on when portable dilution devices are used, the highest peaks in distribution profiles for the reduced load are always at the 5th (0.121 μm) stage of impactor, i.e., shifted toward larger particle sizes with decreasing boiler load as it has commonly been observed in literature (Johansson et al. Citation2003; Torvela et al. Citation2014). However, with the DT, the peaks during full power and reduced power are both at the 5th stage.
3.2. Particle emission factors
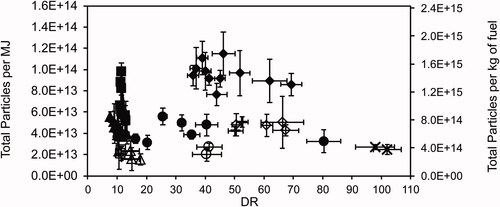
Measured total particle concentrations were recalculated to the average values of total particle emission factors, using data of ultimate and proximate analysis, a determined gross caloric value and a fuel mass consumption rate (Koppejan and Van Loo Citation2012). Fractions of flue gas components were measured either by FTIR or Horiba gas analyzer. Water content was measured by FTIR or in some cases derived indirectly. Results for each dilution device are represented in .
Figure 4. Total particle emission factors from different power output regimes of the boiler measured with different dilution devices.
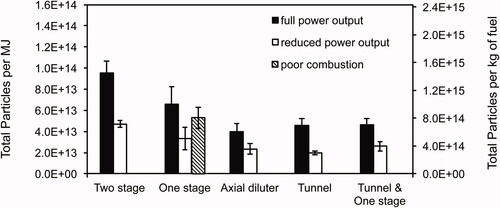
In all studied cases, the total particle emission concentrations of the full power regime are systematically higher than those of the reduced power regime. In a row of portable dilution devices, the highest concentrations are obtained by means of the two-stage dilutor followed by the one-stage dilutor and then by the axial dilutor. The average concentration value of particles measured by the DT was slightly higher than that of the axial dilutor but lower than in the case of the one-stage dilutor. Some tests were carried out combining two devices, the DT and one-stage dilutor, to find their relative influence on measuring results. As could be expected, the emission factors determined by the combination of DT and one-stage dilutor are between the emission factors determined by the separate devices. It is also noticeable that the standard deviations expressed by the error bars, in majority of cases demonstrate substantial variations of the particle concentrations during series of measurements for each device. Overall variations of total particle emission per MJ (average values) measured with different dilution devices are between 3.14 × 10¹³ ± 3.18 × 10¹² and 1.15 × 10¹⁴ ± 2.49 × 10¹³ (which is approximately a factor of 2) for the full power regime. For the reduced power regime these values are between 1.54 × 10¹³ ± 2.00 × 10¹² and 5.03 × 10¹³ ± 2.44 × 10¹³ (which is approximately a factor of 2.5).
As explained above, the configuration of dilution devices used in this study is quite different. Thus, combinations of such parameters as dimensions of the mixing chamber, dilution and sampling flow rates, residence time, temperature regime of the sample, etc. can obviously affect the particle concentrations. For example, the two-stage dilutor provides a steady dilution of the sample as well as it possesses rather large mixing chamber that according to the present measurements better preserves the fine particles. Thermophoretic losses inside this dilution device are considered as rather small, as it is also asserted by the manufacturers and in some details discussed by Cornette et al. (Citation2020). In this work they are assumed to be within the measuring error. A distinctive feature of this device should be pointed out. At the 1st stage the dilution air passes through the porous media reducing the deposition of particles on the surface and also providing better transportation of the sample to the second stage. In turn it may lead to higher measured concentrations. Using this device also gives the highest error of the DR. Only average values can be used for calculations affecting the final results. The one-stage dilutor also have rather large and massive mixing chamber and significant dilution air flow rate that provides better quenching of the sample. The axial dilutor have a small mixing chamber and, due to insignificant flow rate, the residence time of the sample is relatively large that can cause more particle losses. Finally the DT takes in all exhaust gases diluting them with large amount of ambient air. The sample is cooling down slower in the tunnel with longer residence time. Probably in these conditions the particles sustain substantial modifications decreasing the fine fraction. Several studies, for example Giechaskiel, Ntziachristos, and Samaras (Citation2009), Bainschab et al. (Citation2020), demonstrated mostly insignificant effects of particle losses in various portable dilution devices and their elements. Diffusivity losses can be notable for particles of the smallest diameters, but in the present comparison their measured concentrations do not introduce significant differences. Based on some data of Giechaskiel et al. (Citation2012), assuming a monodisperse aerosol of size 0.07 µm detectable on the stage 4 of the impactor, diluted and with the characteristic residence time of about 1 s, the relative reduction in particle concentration due to coagulation for the portable dilution devices does not exceed 1.6%. The particle growth by condensation can be considered as very limited for both, the organic and inorganic species for the present combustion conditions and used fuel. Condensation of water on particles as this component is present in abundance in the gas phase can significantly alter the particle concentrations while using either portable or stationer dilution devices. However this and other effects with water while particles travel through the ducts and reach the impactor where the pressure significantly drops cannot be determined in the present study.
At the same time, not all parameters of the devices can be accurately rendered. For example the deposition of particles at the orifices of ejector or inlet sections of the devices. Thus, it cannot be excluded that evaluation of some effects are quite challenging. Thus, particular determination of the mechanisms affecting the measurements of particle emission for different devices requires much profound study and is rather apart from the scope of this work.
The boiler was operated at the average excess air ratio of 1.2 ± 0.1 for the full power output and 1.6 ± 0.2 for the reduced power output. The fuel supply rate of the auger’s rotation for the reduced power regime was 3.2 times slower than for the full power regime, with respectively adapted blower fan intensity. Additionally, measurements with elevated at 2.5 ± 0.2 excess air ratio were carried out. The auger rotation rate of the fuel supply was close to the reduced power regime with the fan intensity increased. It was performed to simulate in some extend the regime of unsatisfied combustion conditions taking place during burnout. Total particle emission in this case measured with one-stage dilutor has an increased value up to 5.30 × 10¹³ ± 1.01 × 10¹³ particles per MJ as compared to the reduced power regime (3.32 × 10¹³ ± 1.08 × 10¹³ particles per MJ), but did not exceed the emission of the full power regime (6.57 × 10¹³ ± 1.65 × 10¹³ particles per MJ) with lower excess air ratio. Johansson et al. (Citation2003) demonstrated an influence of oxygen content on mass concentration for a single combustion device. However, no regular dependency of the number concentration on this parameter could be found from their own results and results of used literature. Apparently it could be seen from the present work that the particle emission can increase with increased excess air ratio if the combustion conditions are poor.
3.3. Dilution ratio
As mentioned above the dilution of sample is usually applied to avoid adverse effects related to the measuring technique. At the same time, as discussed in some studies, the results of measurements can be affected by dilution.
For example, the influence of the DR on the measuring results was demonstrated by Sippula, Lind, and Jokiniemi (Citation2008) and Sippula, Koponen, and Jokiniemi (Citation2012) using a two-stage dilution device, determining the particle concentrations and particle number size distributions. Authors studied emission of inorganic salt particles produced by heating salt samples in a furnace and particles from combustion process generated in a laboratory reactor. However, those results cannot be directly compared with results of the present work due to different conditions of particle formation, sampling conditions and, in many cases, different ranges of dilution degrees.
Measurements of particle emission from diesel exhaust in a range of DRs between 10 and 170 performed by Lyyränen et al. (Citation2004) represent dissimilar results. For a partial flow dilutor in series with an ED the total number concentration increases with DR, but for a porous tube dilutor there is no apparent influence. A total number concentration measured using a porous tube dilutor in series with an ED, similarly to the present work, is given by only one experimental point.
Results of Lipsky and Robinson (Citation2006) performed in DTs demonstrate a decrease of mass concentrations of particles (PM2.5) emitted from a low load operation of a diesel engine with increase of DRs from 20 to 350. Their results also demonstrate that PM2.5 emissions from a wood stove decreases with increasing DR from 20 to 120.
Each device used in this work can operate in a particular range of DRs. For the one-stage dilutor it is almost constant value, for other devices it is variable and depends on the flow rate of dilution air. It can be selected in accordance to the application specifics, properties of other elements of a sampling line and measuring device.
Averages of emissions of total particle concentrations measured during the full and reduced regimes of boiler power output plotted against the DRs are represented in . The DRs were varied in an approximate range from 8 to 102 for different devices. Error bars on the graph represent standard deviations for both parameters. They have significant values in a majority of cases. A scattering of the points is also rather significant. Thus, comparison of the bulk experimental data for all devices, or for each device distinctly does not reveal any tendency to increase or decrease of the particle concentrations with DR.
Figure 5. Total particle emission measured using different dilution devices represented with respect to the dilution ratios (DR). Vertical and horizontal error bars represent standard deviations for emission factors and dilution ratios, respectively. Diamonds – two-stage dilutor; squares – one-stage dilutor; circles – axial dilutor; triangles – dilution tunnel; crosses – dilution tunnel combined with one-stage dilutor. Solid shapes and straight crosses – full power regime; open shapes and diagonal crosses – reduced power regime.
There are several studies on the particle emissions in the engine exhaust, for example Mathis et al. (Citation2004) and Kittelson, Watts, and Johnson (Citation2006), that demonstrate the influence of the dilution and cooling on the nucleation mode of particle formation. However in the biomass combustion the majority of particle emission consists of inorganic matter (Sippula et al. Citation2009; Tissari et al. Citation2008) and at the temperatures in the chimney the concentrations of species relevant for gas-to-particle conversion are rather limited (Cornette et al. Citation2020). In other words, the actual concentrations of components that can affect the nucleation mode due to dilution are relatively low to be detected by the present measurements.
The particle concentrations measured at different stages of impactor with different DRs in a range from 36 to 69 are shown in for the experiments with two-stage dilutor at the boiler’s full power output. As it can be seen, these measurements cannot demonstrate any dependence of the particle concentrations of the nucleation mode on this parameter. Other stages, shown for comparison, demonstrate relatively similar concentration levels. Perhaps there is some tendency of a slight decrease for the 4th and 5th stages (accumulation mode), demonstrated also by a simple linear regression model. A Pearson correlation analysis gives statistically significant coefficient of −0.6 (with alpha equal to 0.05) for both of those stages.
Figure 6. Particle concentrations measured at different stages of impactor (from 1 to 8) using two-stage dilutor represented with respect to the dilution ratios (DR).
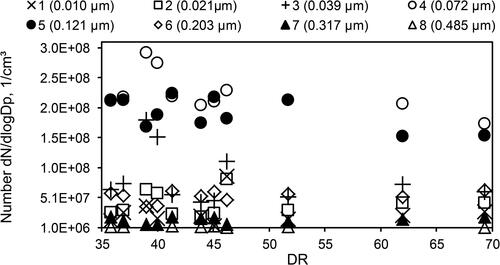
In case of the axial dilutor the DR changed from 10 to 80. Pearson correlation analysis does not demonstrate any significant coefficient in a range of either mode. Apparently, for other two dilution devices the DR did not sufficiently vary.
3.4. Gas emissions
Specifics of the gaseous emissions of the considered pellet boiler at various regimes were discussed in Verma et al. (Citation2011a, b). The results are expressed in mg/Nm3 and converted to the values at 10 vol.% of oxygen in a dry sample. Similar way of denoting the results is applied in this work.
To characterize the quality of different combustion regimes, gas emissions during the consequent series of experiment were measured by the FTIR analyzer.
The concentration of CO increases from 60 ± 170 to 300 ± 220 mg/Nm3 when the boiler passes from the full to reduced power regimes and significantly increases up to 1800 ± 530 mg/Nm3 at the regime with the elevated air excess ratio. Indicated standard deviations show that the variations of CO concentrations during the combustion process are rather high and increasing with the average concentration value. The obtained results correspond well to the diagram of carbon monoxide concentration dependence on the excess air ratio, represented by Nussbaumer (Citation2003, Citation2010).
NOx consisted of nitrogen monoxide and nitrogen dioxide fractions, with a great majority of the first component (>90%). No N2O was detected. The concentrations of this component were relatively stable, around the value of 100 ± 8 mg/Nm3 for the studied cases.
The concentrations of carbon dioxide were rather stable for all measurements, the concentration ranges were 16.4 ± 0.7 vol.% for the full power regime and 12.2 ± 0.5 vol.% for the reduced power regime.
Other emission gas components, such as SO2, HCl, NH3 or hydrocarbons were not found, as their concentrations were below the detection limit of FTIR, which is usual for the combustion of most sorts of wood pellets.
3.5. Statistical data treatment
A statistical method of one-way analysis of variance (ANOVA) was employed to examine the four groups of measuring results (measurements with one-stage dilutor and DT used jointly were not included) obtained in this study to determine if they can fit to the same overall population. Applying F-test can be also useful to evaluate if the difference of the results is meaningful. All results for full power output regimes represented in first four rows of were included into the analysis. The total particle number concentrations were taken into account. Preliminary to the analysis, the Shapiro − Wilk test at a significance level α = 0.05 was applied to verify the normality of obtained results. The ANOVA test at the same significance level revealed that the average number concentrations obtained using different dilution devices are not statistically equal. Found parameters Fcrit(0.05)=2.934, F(3,29)=37.798, p < .001 suggest to reject a null hypothesis and to conclude that the difference in the results of measurements obtained by varying the dilution devices is statistically significant.
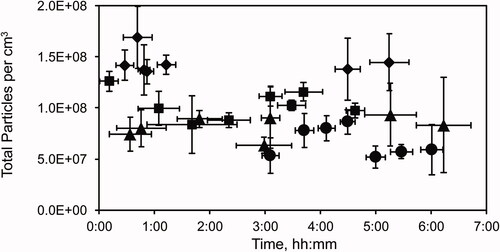
During continuous functioning of ELPI + some steady degradation of measuring results could be expected. The impactor characteristics can alter due to collecting the solid matter on the impactor stage substrates. represents total particle concentrations emitted at the full power regime put on a time scale relative to the starting point of measurements by ELPI+. Vertical error bars on the graph represent standard deviations for total measured concentrations. Horizontal error bars in this case are used to indicate time periods the measurements were taken. Some periods overlap because the measurements were taken on different days of the campaign. From this figure no systematic changes of the measured particle concentrations can be determined while using any dilution device. Thus, it cannot be a factor affecting the results of the statistical analysis.
Figure 7. Total particle concentrations measured at the full power regime against the relative time of ELPI + analyzer functioning. Diamonds – two-stage dilutor; squares – one-stage dilutor; circles – axial dilutor; triangles – dilution tunnel.
The results of randomly chosen series of measurements of two gas components CO and CO2 performed by FTIR analyzer were tested as well to verify if the statistical difference of particle emission levels relate closely to the variations of dilution devices and are not associated with possible artifacts of combustion conditions, Lyyränen et al. (Citation2004). Apparently, with obtained parameters of the tests, Fcrit(0.05)=3.112, F(4,14)=0.989, p = .445 for carbon monoxide measurements and Fcrit(0.05)=3.112, F(4,14)=2.877, p = .06 for carbon dioxide measurements, a null hypothesis is valid in case of the gas components, which means that the combustion conditions are alike across the test runs. Thus, the statistical differences in particle emission relates to the varied measuring equipment, i.e., dilution devices.
4. Conclusions
The total particles concentrations and number size distributions were measured using different dilution devices, a two-stage dilutor, a one-stage dilutor, an axial dilutor and a DT. Total particle concentrations were recalculated to the emission factors and the average values were compared. It was found that the highest particle emission was measured by the two-stage dilutor, the next highest value was measured using the one-stage dilutor, then it follows the DT and the axial dilutor. Combining the DT and one-stage dilutor demonstrated insignificant influence of the last one on the measuring results. Measurements were carried out during the full and reduced power regimes recommended by supplier. Concentrations of particle emission of the full power regime are higher than those of the reduced power regime. During the regime of poor combustion conditions the concentrations of particles increased as compared to the reduced power regime with the similar fuel consumption rate.
All dilution devices demonstrate qualitatively similar experimental results of number size distributions. The concentration maxima are observed either at 4th (0.072 μm) or 5th (0.121 μm) stages of impactor. Similarly to the total particle concentrations the highest maxima is found while using the two-stage dilutor, followed by the on stage dilutor, the DT and the axial dilutor. The highest concentrations of the fine particle fraction at the 1st (0.010 μm) stage of impactor were detected by the two-stage dilutor. One-stage dilutor demonstrated lower concentrations of that fraction. For the axial dilutor and DT the concentrations of finest particles were nearly zero. Concentrations of coarse particles detected at the 10th (1.233 μm) − 14th (8.157 μm) stages of impactor were much lower than concentration of other particle fractions. Their average values were usually in a range between 102 and 105 cm−3.
During multiple series of measurements the degree of dilution was a varying parameter within an overall range between 8 and 102. No dependence of the total measured particle concentrations (and respectively emission factors) on the degree of dilution was revealed. However some tendency to decrease in concentrations of particles detected by the 4th (0.072 μm) or 5th (0.121 μm) stages of impactor can be observed in case when the two-stage dilutor was used.
Using dilution air with or without heating did not produce any significant effect on the measurements.
A method of ANOVA was applied to the experimental results. Statistically significant difference was found for the particle concentrations obtained with different dilution devices. Implementing ANOVA to the emission of carbon monoxide and carbon dioxide measurements, taken from different series demonstrated that the data belong to the same distribution. Thus, the statistical differences in particle concentrations most probably associated with the varied dilution devices than with combustion conditions of the boiler.
Acknowledgments
The authors are grateful to the technical staff of ISSEP and VUB for their assistance
Disclosure statement
The authors declare that there is no conflict of interest while performing this work. The authors have not persuaded any commercial or other benefits.
Additional information
Funding
References
- Angelo, M. 2008. Automatic particle monitoring technology. Presentation for the SICK Company.
- Bäfver, L. S., B. Leckner, C. Tullin, and M. Berntsen. 2011. Particle emissions from pellets stoves and modern and old-type wood stoves. Biomass and Bioenergy 35 (8):3648–3655. doi:https://doi.org/10.1016/j.biombioe.2011.05.027.
- Bainschab, M., L. Landl, J. Andersson, A. Mamakos, S. Hausberger, and A. Bergmann. 2020. Measuring sub-23 nanometer real driving particle number emissions using the portable DownToTen sampling system. Journal of Visualized Experiments 159 (159):e61287. doi:https://doi.org/10.3791/61287.
- Biswas, P., and E. Thimsen. 2011. High temperature aerosols: Measurement and deposition of nanoparticle film. In Aerosol measurement: principles, techniques, and applications, ed. P. Kulkarni, P. A. Baron, K. Willeke,Chapter 33, 723–738. Hoboken, New Jersey:Wiley. .
- Bølling, A. K., J. Pagels, K. E. Yttri, L. Barregard, G. Sallsten, P. E. Schwarze, and C. Boman. 2009. Health effects of residential wood smoke particles: the importance of combustion conditions and physicochemical particle properties. Particle and Fibre Toxicology 6:29. doi:https://doi.org/10.1186/1743-8977-6-29.
- Boman, C. 2005. Particulate and gaseous emissions from residential biomass combustion. PhD thesis, Tillämpad fysik och elektronik.
- Brunner, T. 2006. Aerosols and coarse fly ashes in fixed-bed biomass combustion: formation, characterisation and emissions. PhD thesis, Technische Universiteit Eindhoven.
- CEN/TS 15883, 2009. CEN/TS 15883: 2009 Residential solid fuel burning appliances − emission test methods. Standard. European Committee for Standardization.
- Cornette, J. F., T. Coppieters, D. Desagher, J. Annendijck, H. Lepaumier, N. Faniel, I. Dyakov, J. Blondeau, and S. Bram. 2020. Influence of the dilution system and electrical low pressure impactor performance on particulate emission measurements from a medium-scale biomass boiler. Aerosol and Air Quality Research 20:499–519. doi:https://doi.org/10.4209/aaqr.2019.10.0487.
- Dekati, 2010. Dekati axial dilutor DAD-100. User Manual ver. 2.0. Tampere, Finland: Dekati Ltd.
- Dekati, 2016. Dekati ELPI+. User Manual ver. 1.54. Tampere, Finland: Dekati Ltd.
- EN 13229. 2007., NBN EN 13229/A2/AC: 2007 Inset appliances including open fires fired by solid fuels − Requirements and test methods. Standard. Belgian Bureau for Standardization.
- EN 13284 − 1. 2002. NBN EN 13284 − 1: 2002 − 04: Stationary source emissions. Determination of low range mass concentration of dust. Part 1: Manual gravimetric method. Standard. Belgian Bureau for Standardization
- Fachinger, F., F. Drewnick, R. Gieré, and S. Borrmann. 2017. How the user can influence particulate emissions from residential wood and pellet stoves: Emission factors for different fuels and burning conditions. Atmospheric Environment 158:216–226. doi:https://doi.org/10.1016/j.atmosenv.2017.03.027.
- Fernandes, U., and M. Costa. 2012. Particle emissions from a domestic pellets-fired boiler. Fuel Processing Technology 103:51–56. doi:https://doi.org/10.1016/j.fuproc.2011.08.020.
- Fine, P. M., G. R. Cass, and B. R. Simoneit. 2001. Chemical characterization of fine particle emissions from fireplace combustion of woods grown in the northeastern United States. Environmental Science and Technology 35 (13):2665–2675. doi:https://doi.org/10.1021/es001466k.
- Forbes, E., D. Easson, G. Lyons, and W. McRoberts. 2014. Physico-chemical characteristics of eight different biomass fuels and comparison of combustion and emission results in a small scale multi-fuel boiler. Energy Conversion and Management 87:1162–1169. doi:https://doi.org/10.1016/j.enconman.2014.06.063.
- Fournel, S., J. Palacios, R. Morissette, J. Villeneuve, S. Godbout, M. Heitz, and P. Savoie. 2015. Influence of biomass properties on technical and environmental performance of a multi-fuel boiler during on-farm combustion of energy crops. Applied Energy 141:247–259. doi:https://doi.org/10.1016/j.apenergy.2014.12.022.
- Gaegauf, C., M. Sattler, H. Burtscher, A. Keller, T. Grin, J. Wüest, and M. Bertschi. 2015. Determination of particulate matter emissions from solid biomass fuel burning appliances and boilers – Proposal for a common European test method. Technical Report. EN-PME-TEST-Project.
- Garcia-Maraver, A., M. Zamorano, U. Fernandes, M. Rabaçal, and M. Costa. 2014. Relationship between fuel quality and gaseous and particulate matter emissions in a domestic pellet-fired boiler. Fuel 119:141–152. doi:https://doi.org/10.1016/j.fuel.2013.11.037.
- Giechaskiel, B., M. Arndt, W. Schindler, A. Bergmann, W. Silvis, and Y. Drossinos. 2012. Sampling of non-volatile vehicle exhaust particles: A simplified guide. SAE International Journal of Engines 5 (2):379–399. doi:https://doi.org/10.4271/2012-01-0443.
- Giechaskiel, B., L. Ntziachristos, and Z. Samaras. 2009. Effect of ejector dilutors on measurements of automotive exhaust gas aerosol size distributions. Measurement Science and Technology 20 (4):045703. doi:https://doi.org/10.1088/0957-0233/20/4/045703.
- Giechaskiel, B., A. A. Zardini, and M. Clairotte. 2019. Exhaust gas condensation during engine cold start and application of the dry-wet correction factor. Applied Sciences 9 (11):2263. doi:https://doi.org/10.3390/app9112263.
- Hildemann, L., G. Cass, and G. Markowski. 1989. A dilution stack sampler for collection of organic aerosol emissions: design, characterization and field tests. Aerosol Science and Technology 10 (1):193–204. doi:https://doi.org/10.1080/02786828908959234.
- Johansson, L. S., C. Tullin, B. Leckner, and P. Sjövall. 2003. Particle emissions from biomass combustion in small combustors. Biomass and Bioenergy 25 (4):435–446. doi:https://doi.org/10.1016/S0961-9534(03)00036-9.
- Jöller, M., T. Brunner, and I. Obernberger. 2005. Modelling of aerosol formation. In Proceedings of the Workshop Aerosols in Biomass Combustion, 79–105.
- Kinsey, J. S., P. H. Kariher, and Y. Dong. 2009. Evaluation of methods for the physical characterization of the fine particle emissions from two residential wood combustion appliances. Atmospheric Environment 43 (32):4959–4967. doi:https://doi.org/10.1016/j.atmosenv.2009.07.008.
- Kittelson, D. B., W. F. Watts, and J. P. Johnson. 2006. On-road and laboratory evaluation of combustion aerosols – Part 1: Summary of diesel engine results. Journal of Aerosol Science 37 (8):913–930. doi:https://doi.org/10.1016/j.jaerosci.2005.08.005.
- Koppejan, J., and S. Van Loo (Eds.). 2012. The handbook of biomass combustion and co-firing. Routledge.
- Lamberg, H., K. Nuutinen, J. Tissari, J. Ruusunen, P. Yli-Pirilä, O. Sippula, M. Tapanainen, P. Jalava, U. Makkonen, K. Teinilä, et al. 2011. Physicochemical characterization of fine particles from small-scale wood combustion. Atmospheric Environment 45 (40):7635–7643. doi:https://doi.org/10.1016/j.atmosenv.2011.02.072.
- Lim, M. T., A. Phan, D. Roddy, and A. Harvey. 2015. Technologies for measurement and mitigation of particulate emissions from domestic combustion of biomass: A review. Renewable and Sustainable Energy Reviews 49:574–584. doi:https://doi.org/10.1016/j.rser.2015.04.090.
- Lipsky, E. M., and A. L. Robinson. 2006. Effects of dilution on fine particle mass and partitioning of semivolatile organics in diesel exhaust and wood smoke. Environmental Science and Technology 40 (1):155–162. doi:https://doi.org/10.1021/es050319p.
- Lyyränen, J., J. Jokiniemi, E. I. Kauppinen, U. Backman, and H. Vesala. 2004. Comparison of different dilution methods for measuring diesel particle emissions. Aerosol Science and Technology 38 (1):12–23. doi:https://doi.org/10.1080/02786820300983.
- Mathis, U., J. Ristimäki, M. Mohr, J. Keskinen, L. Ntziachristos, Z. Samaras, and P. Mikkanen. 2004. Sampling conditions for the measurement of nucleation mode particles in the exhaust of a diesel vehicle. Aerosol Science and Technology 38 (12):1149–1160. doi:https://doi.org/10.1080/027868290891497.
- Mertens, J., H. Lepaumier, P. Rogiers, D. Desagher, L. Goossens, A. Duterque, E. Le Cadre, M. Zarea, J. Blondeau, and M. Webber. 2020. Fine and ultrafine particle number and size measurements from industrial combustion processes: Primary emissions field data. Atmospheric Pollution Research 11 (4):803–814. doi:https://doi.org/10.1016/j.apr.2020.01.008.
- Nussbaumer, T. 2003. Combustion and co-combustion of biomass: Fundamentals, technologies, and primary measures for emission reduction. Energy and Fuels 17 (6):1510–1521. doi:https://doi.org/10.1021/ef030031q.
- Nussbaumer, T. 2010. Overview on technologies for biomass combustion and emission levels of particulate matter. Swiss Federal Office for the Environment (FOEN), Zürich, Switzerland.
- Oser, M., and T. Nussbaumer. 2006. Low particle furnace for wood pellets based on advanced staged combustion. Science in Thermal and Chemical Biomass Conversion 30.
- Pagels, J., L. Johansson, M. Hagström, A. Wierzbicka, M. Bohgard, C. Tullin, and M. Sanat. 2002. Intercomparison of SMPS, ELPI and APS 3320 during sampling of particles emitted from a domestic wood pellet burner. Paper presented at 6th International Aerosol Conference. https://portal.research.lu.se/portal/
- Palas, 2007. VKL − 10 Dilution System, https://www.palas.de/en/product/vkl10. User Manual. Palas.
- Sippula, O., J. Hokkinen, H. Puustinen, P. Yli-Pirilä, and J. Jokiniemi. 2009. Particle emissions from small wood-fired district heating units. Energy and Fuels 23 (6):2974–2982. doi:https://doi.org/10.1021/ef900098v.
- Sippula, O., K. Hytönen, J. Tissari, T. Raunemaa, and J. Jokiniemi. 2007. Effect of wood fuel on the emissions from a top-feed pellet stove. Energy and Fuels 21 (2):1151–1160. doi:https://doi.org/10.1021/ef060286e.
- Sippula, O., T. Koponen, and J. Jokiniemi. 2012. Behavior of alkali metal aerosol in a high-temperature porous tube sampling probe. Aerosol Science and Technology 46 (10):1151–1162. doi:https://doi.org/10.1080/02786826.2012.700741.
- Sippula, O., T. Lind, and J. Jokiniemi. 2008. Effects of chlorine and sulphur on particle formation in wood combustion performed in a laboratory scale reactor. Fuel 87 (12):2425–2436. doi:https://doi.org/10.1016/j.fuel.2008.02.004.
- Tissari, J., O. Sippula, J. Kouki, K. Vuorio, and J. Jokiniemi. 2008. Fine particle and gas emissions from the combustion of agricultural fuels fired in a 20 kW burner. Energy and Fuels 22 (3):2033–2042. doi:https://doi.org/10.1021/ef700766y.
- Torvela, T., J. Tissari, O. Sippula, T. Kaivosoja, J. Leskinen, A. Virén, A. Lähde, and J. Jokiniemi. 2014. Effect of wood combustion conditions on the morphology of freshly emitted fine particles. Atmospheric Environment 87:65–76. doi:https://doi.org/10.1016/j.atmosenv.2014.01.028.
- Verma, V., S. Bram, G. Gauthier, and J. De Ruyck. 2011a. Evaluation of the performance of a multi-fuel domestic boiler with respect to the existing European standard and quality labels: Part-1. Biomass and Bioenergy 35 (1):80–89. doi:https://doi.org/10.1016/j.biombioe.2010.08.028.
- Verma, V., S. Bram, G. Gauthier, and J. De Ruyck. 2011b. Performance of a domestic pellet boiler as a function of operational loads: Part-2. Biomass and Bioenergy 35 (1):272–279. doi:https://doi.org/10.1016/j.biombioe.2010.08.043.
- Wilnhammer, M., S. Wittkopf, K. Richter, and G. Weber-Blaschke. 2017. The impact of a new emission control act on particulate matter emissions from residential wood energy use in Bavaria, Germany. Journal of Cleaner Production 145:134–141. doi:https://doi.org/10.1016/j.jclepro.2017.01.039.
- World Health Organization, 2006. Air quality guidelines: global update 2005: Particulate matter, ozone, nitrogen dioxide, and sulphur dioxide. A EURO Publication. World Health Organization. ISBN 9289021926, 9789289021920 (484 pages).
- Zhang, K. M., and A. S. Wexler. 2004. Evolution of particle number distribution near roadways – Part I: Analysis of aerosol dynamics and its implications for engine emission measurement. Atmospheric Environment 38 (38):6643–53. doi:https://doi.org/10.1016/j.atmosenv.2004.06.043.