
 ?Mathematical formulae have been encoded as MathML and are displayed in this HTML version using MathJax in order to improve their display. Uncheck the box to turn MathJax off. This feature requires Javascript. Click on a formula to zoom.
Abstract
We evaluated the effectiveness of 11 face coverings for material filtration efficiency, inward protection efficiency on a manikin, and outward protection efficiency on a manikin. At the most penetrating particle size, the vacuum bag, microfiber cloth, and single-layer surgical-type mask had material filtration efficiencies >50%, while the other materials had much lower filtration efficiencies. However, these efficiencies increased rapidly with particle size, and many materials had efficiencies >50% at 2 μm and >75% at 5 μm. The vacuum bag performed best, with efficiencies of 54–96% for all three metrics, depending on particle size. The thin acrylic and face shield performed worst. Inward protection efficiency and outward protection efficiency, defined for close-range, face-to-face interactions, were similar for many masks; the two efficiencies diverged for stiffer materials and those worn more loosely (e.g., bandana) or more tightly (e.g., wrapped around the head) compared to an earloop mask. Discrepancies between material filtration efficiency and inward/outward protection efficiency indicated that the fit of the mask was important. We calculated that the particle size most likely to deposit in the respiratory tract when wearing a mask is ∼2 μm. Based on these findings, we recommend a three-layer mask consisting of outer layers of a flexible, tightly woven fabric and an inner layer consisting of a material designed to filter out particles. This combination should produce an overall efficiency of >70% at the most penetrating particle size and >90% for particles 1 μm and larger if the mask fits well.
Copyright © 2021 American Association for Aerosol Research
EDITOR:
Introduction
Amid mounting evidence that COVID-19 is transmitted via inhalation of virus-laden aerosols (Allen and Marr Citation2020; Asadi, Bouvier, et al. Citation2020; Hadei et al. Citation2020; Morawska et al. 2020; Prather, Wang, and Schooley Citation2020), universal masking has emerged as one of a suite of intervention strategies for reducing community transmission of the disease (Howard et al. Citation2021). There is a correlation between widespread mask wearing (The Economist Citation2020), or at least interest in masks (Wong et al. Citation2020), and lower incidence of COVID-19 by country and between mask mandates and county-level COVID-19 growth rates in the US (Lyu and Wehby Citation2020), but a causal relationship has not been confirmed.
Due to a shortage of medical masks and respirators, some public health agencies have recommended the use of cloth face coverings. While there have been numerous studies on the ability of surgical masks and N95 respirators to filter out particles, less is known about the ability of cloth masks to provide both inward protection for reducing the wearer’s exposure and outward protection for source control. In response to the pandemic, there has been a spate of studies on the filtration efficiency of different materials, but how this translates to both inward and outward protection over a wide range of particle sizes is not well known.
Reviews on the use of masks in both healthcare and non-healthcare settings to reduce transmission of respiratory diseases mostly show a protective effect. A systematic review and meta-analysis of interventions against respiratory viruses found that wearing simple masks was highly effective at reducing transmission of severe acute respiratory syndrome (SARS) in five case control studies (Jefferson et al. Citation2008). In contrast, a review of 10 randomized controlled trials of mask wearing in non-healthcare settings concluded that there was not a substantial effect on influenza transmission in terms of risk ratio, although most of the studies were underpowered and compliance was not perfect (Xiao et al. Citation2020). A systematic review of interventions against SARS-CoV-2 and the coronaviruses that cause SARS and Middle East respiratory syndrome found that the use of face masks could result in a large reduction in the risk of infection (Chu et al. Citation2020).
Laboratory studies have demonstrated the ability of surgical masks to provide both inward and outward protection against viruses. Testing of eight different surgical masks on a manikin with influenza virus in droplets/aerosols of size 1–200 μm found that the amount of virus detected behind the mask was reduced by an average of 83%, with a range of 9% to 98% (Makison Booth et al. Citation2013). The ability of a mask to block influenza virus was correlated with its ability to block droplets/aerosols containing only phosphate buffered saline (PBS) and bovine serum albumin (BSA). Surgical masks used for source control on influenza patients during breathing and coughing reduced the amount of virus released into the air in coarse (>5 μm) and fine (≤5 μm) aerosols by 96% and 64%, respectively (Milton et al. Citation2013). In a follow-up study, surgical masks blocked the release of seasonal coronaviruses in coarse and fine aerosols to undetectable levels, while they blocked influenza virus in most but not all patients (Leung et al. Citation2020).
There have been some studies of cloth masks, which have been found to be less protective than surgical masks in most, but not all, cases. A variety of cloth materials mounted in a filter holder removed 49% to 86% of aerosolized bacteriophage MS2, compared to 89% removal by a surgical mask (Makison Booth et al. Citation2013). According to fit tests on 21 adults in the same study, homemade, 100% cotton masks provided median inward filtration efficiencies of 50%, compared to 80% for surgical masks. Homemade masks made from tea cloths and worn by volunteers had a median inward filtration efficiency of 60%, compared to 76% for a surgical mask (van der Sande, Teunis, and Sabel Citation2008).
Several recent studies have evaluated the filtration efficiency of different materials and the ability of different types of face coverings to block cough-generated particles. The filtration efficiencies of 44 materials and medical masks, challenged with sodium chloride (NaCl) particles of diameter 0.03–0.25 μm, ranged from <10% for polyurethane foam to nearly 100% for a vacuum cleaner bag (Drewnick et al. Citation2021). Other studies involving NaCl test particles have also found a wide range of material filtration efficiencies for common fabrics, including cotton, polyester, nylon, and silk; many materials had low filtration efficiencies for submicron particles (Konda et al. Citation2020b; Rengasamy, Eimer, and Shaffer Citation2010; Zangmeister et al. Citation2020; Zhao et al. Citation2020). Pieces of a bandana, veil, shawl, handkerchief, and cotton t-shirt mounted in a filter holder and challenged with volcanic ash particles were found to have filtration efficiencies of 18% to 43% in terms of mass concentration (Mueller et al. Citation2018). A study involving particles generated by coughing human subjects reported an outward protection efficiency of 77% at a distance of 0.3 m from the source for a cloth mask, but only 4% for a face shield (Li, Niu, and Zhu Citation2021). Similarly, a study of outward protection efficiency using simulated coughs found that a three-ply cotton mask, single-layer polyester neck gaiter, double-layer polyester neck gaiter, and face shield blocked 51%, 47%, 60%, and 2% of particles, respectively (Lindsley et al. Citation2021).
N95 respirators and cloth masks serve different purposes, so the testing procedure for N95s is not necessarily well-suited for cloth masks. An N95 must be able to protect an individual worker in high-risk situations. A critical component of its efficacy is the fit test to ensure that the respirator seals completely to the face with no leaks. On the other hand, the overall goal of wearing cloth masks during the COVID-19 pandemic is to reduce community transmission. Cloth masks provide some degree of both source control and exposure reduction. While an N95 must block at least 95% of NaCl particles of the most penetrating size, 0.3 μm, cloth masks can be effective if they remove at least some particles, particularly those of the size that is most relevant for transmission. Although we do not yet know which size particles are most important, we can make some inferences from existing studies. SARS-CoV-2 and other viruses are carried by particles ranging in size from <1 μm to >5 μm (Chia et al. Citation2020; Liu et al. Citation2020; Yan et al. Citation2018; Yang, Elankumaran, and Marr Citation2011). A SARS-CoV-2 virion is 0.1 μm in diameter, but it is carried in respiratory droplets that also contain salts, proteins, and other components of respiratory fluid. Even if all the water evaporates, the mass of the nonvolatile components is expected to be orders of magnitude larger than that of any viruses that might be present (Marr et al. Citation2019), so the size of a particle carrying an intact virus must be quite a bit larger than 0.1 μm. The smaller mode of respiratory particles produced during breathing and speaking is centered around 1 μm, and there are relatively few particles smaller than 0.5 μm (Johnson et al. Citation2011). Influenza transmission between ferrets has been shown to be mediated by particles larger than 1.5 μm (Zhou et al. Citation2018). Thus, it seems prudent to evaluate mask performance over a range of particle sizes, particularly those larger than 0.3 μm.
Given the advice of public health agencies for the general public to wear face coverings and the paucity of knowledge about their effectiveness, the objective of this study is to evaluate the efficiency of cloth masks compared to a surgical mask and a face shield at blocking particles over a wide range of sizes. We first measure the filtration efficiency of materials under ideal conditions and then investigate both inward and outward protection efficiency of the materials when worn as masks on a manikin. We expect that efficiency on a manikin will be lower than in a filter holder due to leakage around the mask and that outward efficiency will be higher than inward efficiency due to differences in velocity of the particles as they approach the material. The results of this study will contribute to understanding how universal masking might reduce transmission of COVID-19 and other respiratory diseases.
Methods
Masks
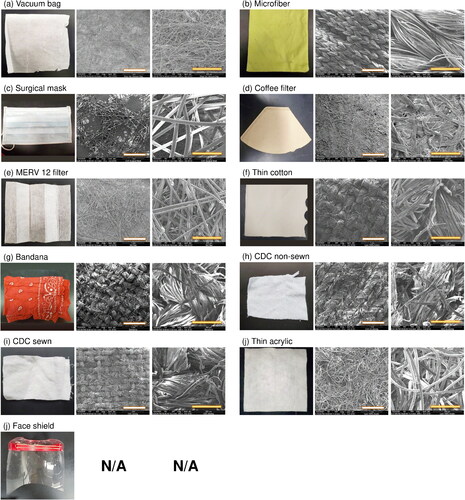
We tested nine materials that were fashioned into masks, one surgical mask, and one face shield, shown in . To make the masks, we cut materials into 15.5 cm × 10 cm rectangles and securely taped them to a frame tailored from a procedure mask, except for two designs that followed instructions from the US Centers for Disease Control and Prevention (CDC). These included a sewn mask made of two layers of a 200-thread count cotton pillowcase and a non-sewn mask cut from a cotton t-shirt (Centers for Disease Control and Prevention Citation2020). The instructions for the non-sewn mask used in this study have been supplanted with an updated design involving a large square of fabric and rubber bands. For masks with earloops, we secured the loops around the manikin’s ears using pins to hold them in place. We did not tape the face coverings to the manikin’s face. The surgical-type mask, technically a procedure mask, had a single layer and was advertised to meet ASTM level 1 specifications, which require ≥95% filtration efficiency of particles larger than 1 μm. We characterized the texture and structure of the masks using a scanning electron microscope (FEI Quanta 600 FEG). Because it is not possible to generate or characterize particles spanning a wide range of sizes with a single experimental setup, we designed several different protocols for testing masks, optimizing among different types of equipment and detection limits, as described below.
Figure 1. Ten mask materials and a face shield. All materials have a single layer except the thin cotton, which has two layers. SEM images are shown at two scales: the white scale bar represents 1 mm and the yellow one represents 200 μm. There are no SEM images for the face shield, which was made of a plastic sheet.
Material filtration efficiency
Evaluation of the materials for filtration efficiency followed a protocol based on National Institute of Occupational Safety and Health (NIOSH) testing procedures. Using a Collison 3-jet nebulizer (MRE-3, BGI Inc., MA, USA), we generated challenge particles of size 0.04 to 1 μm from a 2% NaCl solution. The particles filled a 280 L polyethylene chamber (Sigma AtmosBag, Sigma–Aldrich, ON, Canada), in which we placed a small fan to promote mixing. The temperature and humidity inside the chamber were 22 °C and 25–35% RH, respectively. We measured particle concentrations and size distributions over the range from 0.04 to 1 μm using a scanning mobility particle sizer (SMPS 3936, TSI Inc., MN, USA), with the particle density set to 2.165 g/cm3 (NaCl) to convert from mobility diameter to aerodynamic diameter.
We cut out circular pieces of each material to mount in a 25 mm stainless steel filter holder (Advantec, Cole Parmer, IL, USA) that was connected to a vacuum line whose flow rate was maintained at 2.7 L/min by a mass flow controller (32907-53, Cole Parmer, IL, USA). The SMPS sampled from this line at a rate of 0.3 L/min, producing a total flow rate of 3.0 L/min and a corresponding face velocity of 10 cm/s through the material. Clean make-up air flow to the chamber was provided through a high-efficiency particulate air filter capsule (12144, Pall Corporation, MA, USA). We checked the material filtration efficiency of an N95 respirator and the microfiber cloth with and without a Kr-85 radioactive neutralizer (3012, TSI Inc., MN, USA) or soft x-ray neutralizer (XRC-05, HCT Co., Ltd, Republic of Korea) after the nebulizer, and did not find significant differences (Figures S1–S3), so we did not employ a neutralizer in subsequent tests. To calculate the size-resolved filtration efficiency, we compared measurements with the material in the filter holder to those made with an empty filter holder, as shown in EquationEquation (1)(1)
(1) , where FE is the material filtration efficiency; DP is the particle diameter; Cblank is the concentration of challenge particles measured downstream of the empty filter holder, and Cmaterial is the concentration of particles downstream of the material:
(1)
(1)
For Cblank, we used the average of measurements conducted immediately before and after testing each material; these measurements differed by less than 10%. We conducted these experiments in triplicate using three different pieces cut from each material.
In addition to challenging the masks with submicron particles generated by the Collison nebulizer, we also tested larger particles ranging in size from 2 to 5 μm. We generated these from a 2% NaCl solution using a flow focusing monodisperse aerosol generator (FMAG, TSI Inc., MN, USA). We measured the particles using an aerodynamic particle sizer spectrometer (APS 3321, TSI Inc., MN, USA), which covers the size range from 0.5 to 20 μm. Because the APS samples at a flow rate of 1.0 L/min, we adjusted the vacuum line to 2.0 L/min to produce a total flow rate of 3.0 L/min, the same as used for testing smaller particles. Clean make-up air was also applied as described above. We calculated the filtration efficiency according to EquationEquation (1)(1)
(1) in triplicate. We also measured the pressure drop of each material in the filter holder using a differential pressure gauge (Minihelic II 2-5005, Dwyer Instruments, IN, USA).
Inward and outward protection efficiency at close distance
We evaluated both inward protection efficiency (IPE) for the ability to reduce the wearer’s exposure and outward protection efficiency (OPE) for source control using two manikins mounted on opposite sides of a 57-L acrylic chamber (51 cm × 34 cm × 33 cm), mimicking the situation of close talking with a mouth-to-mouth distance of 33 cm (). Due to constraints of the experimental setup, the IPE and OPE should be interpreted to apply in the face-to-face direction at 33 cm distance. The IPE combines the effects of filtration and reduction in exposure to a respiratory plume directed at the wearer, and the OPE combines the effects of filtration and reduction in exposure resulting from the diversion of flow by the face covering. Thus, the IPE and OPE are indicators of protection afforded to the wearer and of source control, respectively, but are not necessarily generalizable to all conditions.
Figure 2. Schematic of experimental setup for determining (a) inward protection efficiency and (b) outward protection efficiency.
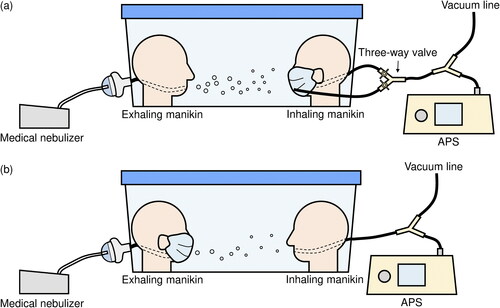
The “exhaling” manikin was connected to a medical nebulizer (AIRIAL) filled with 2% NaCl solution, that produced a flow rate of 5.3 L/min through 0.79 cm i.d. tubing. The “inhaling” manikin was connected to both the APS and a vacuum line, with flow rates of 1 L/min and 14 L/min, respectively, resulting in a total flow rate of 15 L/min through 1 cm i.d. tubing. The air velocity at the “exhaling” manikin's mouth was 1.8 m/s, similar to that of breathing (Tang et al. Citation2013). The air velocity at the "inhaling" manikin's mouth was 3.2–3.4 m/s, similar to that of breathing and talking (Gupta, Lin, and Chen Citation2010; Xie et al. Citation2009). Make-up air entered the chamber around the top perimeter, to minimize disruption to air flow that might be introduced by a port. At a flow rate of 5 L/min, the average downward velocity would be 0.05 cm/s, so downward motion of the aerosols is expected to be negligible during their brief transit time between the manikins. The make-up air had a background particle concentration of at most 0.5% (around 50 #/cm3 for particles detectable by the APS) of that generated in the chamber by the nebulizer. We also estimated the impact of losses due to particle settling. If the exhaling manikin was maskless, then the aerosol flow traveled in a jet directly toward the inhaling manikin. We calculated that it would take less than 1 s for particles along the centerline to travel between the two manikins, while it would take 60 s for 5-μm particles to settle from this height to the bottom of the chamber. If the exhaling manikin was masked, then the travel time would be longer for particles that escaped sideways from the mask and were then pulled toward the inhaling manikin, but we still expect settling losses to be minor in this system. The relatively small size of the chamber introduced physical constraints to the aerosol flow but was required for concentrations to be maintained above the limit of detection, particularly for the larger particles. To minimize losses of particles, we used conductive tubing in lengths as short as possible.
To evaluate inward protection efficiency, we attached face coverings to the inhaling manikin ( and S4) and tested two scenarios. In scenario 1, we ran the medical nebulizer for 3 s through the exhaling manikin, generating particles of size 0.5–2 μm. Using a three-way valve, we set up the APS to sample either through the inhaling manikin’s mouth or through tubing whose inlet was placed outside the face covering, near the manikin’s mouth. The flow rate through the inhaling manikin remained constant at 15 L/min. We then waited 30 s for particle concentrations to decay below the upper limit of detection of the APS, switched the valve to sample from outside the mask, and measured the size distribution in the chamber for 5 s, denoted Cc1. We then switched the valve so that the APS sampled through the inhaling manikin’s mouth and measured particles that penetrated the mask, denoted Cm. We discarded the measurements for 1 s after each switch to allow for flushing of the tubing, to avoid interference among Cc1, Cc2, and Cm. To account for the continually decaying particle concentration in the chamber, we then switched back to measuring particles in the chamber again, denoted as Cc2. The difference between Cc1 and Cc2 was less than 10% in all cases. Therefore, we used the average of Cc1 and Cc2 to represent Cc at the time when we measured Cm. We calculated the inward protection efficiency based on EquationEquation (2)(2)
(2) . The temperature and humidity inside the chamber were 22 °C and 50–70% RH, respectively. In a separate experiment, we demonstrated that the three-way valve and the location of sampling inlets did not bias the calculation. There was no difference in the concentration and size distribution of particles whether the APS sampled directly from the chamber or through the inhaling manikin without the mask. Measurements in scenario 2 followed a similar protocol as in scenario 1 except that the medical nebulizer ran for 30 s instead of 3 s to generate larger particles, up to 5 μm, thanks to coagulation.
(2)
(2)
To evaluate outward protection efficiency, we removed the three-way valve and connected the APS and vacuum line directly to the inhaling manikin (). In each test, we ran the medical nebulizer for 30 s and then allowed particle concentrations to decay, as in scenario 2 of the inward protection protocol, and we measured the chamber concentration (Cc1) using the APS at 1-s resolution. After introducing the HEPA-filtered air to flush particles from the chamber, we then put the mask or face shield on the exhaling manikin and ran the medical nebulizer for 30 s again to measure the concentration (Cm). Then we flushed the chamber again, ran the nebulizer to measure the chamber concentration Cc2, and calculated the average Cc as described in scenario 1. We calculated the outward protection efficiency according to EquationEquation (3)(3)
(3) as well. We conducted all measurements in triplicate and applied a Student’s t-test to compare the differences between two data points.
(3)
(3)
Droplet deposition analysis
We evaluated the ability of the face coverings to block droplets larger than 20 μm, which can be generated by talking, coughing, and sneezing and which exceed the upper limit of the APS, using a modified droplet deposition analysis (DDA) (Johnson et al. Citation2011; Xie et al. Citation2009). The setup was similar to that of the outward protection protocol but with an air brush (MP290001AV, Campbell Hausfeld, OH, USA) in place of the medical nebulizer to generate larger droplets (Lindsley et al. Citation2013). We connected the air brush to HEPA-filtered air and a gas regulator set at 165.5 kPa, resulting in a total flow rate of 10 L/min, the same as the flow rate of the medical nebulizer. We filled the air brush with 2% NaCl solution and red food dye at a ratio of 4:1. We taped five glass slides (75 mm × 25 mm) to the face of the inhaling manikin. We pre-cleaned each slide using 70% isopropyl alcohol wipes.
First, we sprayed the air brush for 3 s without the face covering on the exhaling manikin. We then removed the glass slides from the inhaling manikin and inspected them under an optical microscope at 10× magnification (EVOS FL Auto, Life Technologies, CA, USA). We put the face covering on the exhaling manikin and repeated the same steps. To identify droplets on the slides, we processed the images using ImageJ and then manually counted the stains and measured their size with a limit of detection of 12.3 μm/pixel. Because the droplets spread upon impaction with the slides, we corrected their size assuming a spread factor of 1.5, the ratio of the size of the stain to the original diameter of the droplet (Johnson et al. Citation2011). We conducted all measurements in triplicate.
Results
Size of challenge particles
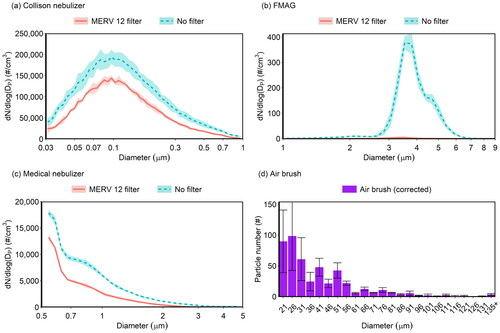
We used four different types of aerosol generators to cover a broad size range and to accommodate different setups. The Collison nebulizer and FMAG, used to determine material filtration efficiency, generated particles ranging in size from 0.04 to 1 μm and from 2 to 5 μm, respectively (). The Collison nebulizer produced particles with a geometric mean diameter (GMD) of 0.12 μm and geometric standard deviation (GSD) of 1.4, and the FMAG a GMD of 4 μm and GSD of 1.21. The figure also shows the size distribution measured downstream of a MERV 12 filter to illustrate the data used to calculate filtration and protection efficiencies. The medical nebulizer produced particles ranging in size from 0.5 to 5 μm; the GMD was below the detection limit of the APS (). As the medical nebulizer covered a relatively large size range, we chose to use it to evaluate the inward and outward protection efficiencies (). The air brush generated large particles ranging in size from 20 μm to greater than 135 μm ().
Figure 3. Concentration and size distribution of particles as a function of aerodynamic diameter generated by (a) collison nebulizer, (b) FMAG, (c) medical nebulizer, without a filter (blue dashed line) or downstream of a MERV 12 filter (red solid line), and (d) air brush. In panel (d), the diameter was corrected from the measured size of the droplet stains on the slide by a factor of 1.5. Shading and error bars represent the standard deviations of triplicates.
Material filtration efficiency
We tested the material filtration efficiency of nine common homemade mask materials and one surgical mask. We did not test the face shield because it does not allow air flow through it. shows results obtained using the Collison nebulizer and SMPS over the size range 0.04 to 1 μm. The efficiency curves exhibit the expected U shape with a minimum in most cases in the range 0.1–0.3 μm, where no collection mechanism is especially efficient (Hinds Citation1999).
Figure 4. Material filtration efficiency of 10 mask materials as a function of aerodynamic diameter. The bandana appears twice because it was tested in both 1-ply and 2-ply configurations. Shading represents the standard deviations of triplicates.
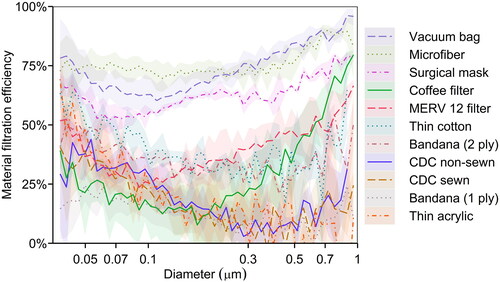
The vacuum bag and microfiber performed best, with a minimum efficiency of 60%. Other studies have also reported that vacuum bags have high filtration efficiencies (Drewnick et al. Citation2021; Zangmeister et al. Citation2020), whereas the performance of microfiber varies depending on the manufacturer and fabric structure (Drewnick et al. Citation2021; Zhao et al. Citation2020). The surgical mask was ∼50–75% efficient over this size range, falling with the range reported for surgical masks in previous studies (Makison Booth et al. Citation2013; Oberg and Brosseau Citation2008; Zangmeister et al. Citation2020; Zhao et al. Citation2020). The minimum efficiency of the coffee filter was only 10% for particles at 0.17 μm, lower than the reported value of 34.4% in another study (at a face velocity of 6.3 cm/s) (Zangmeister et al. Citation2020), but its efficiency rapidly increased with particle size to 75% for particles at 1 μm. The MERV 12 filter reached its lowest efficiency of 25% at 0.1 μm and had an efficiency >50% at the extremes shown in . Common fabrics, including the thin cotton and bandana (2 ply), had low efficiencies, mostly between 30% and 50%. The fabrics fashioned into the CDC non-sewn and CDC sewn masks, bandana (1 ply), and thin acrylic had even lower efficiencies of 5–40% for submicron particles.
Most of the materials exhibited a much better material filtration efficiency for particles >1 μm than for smaller ones, as shown by the black solid line in . The vacuum bag, microfiber, surgical mask, and MERV 12 filter achieved 90% or higher efficiency at 2 μm, and thin cotton and coffee filter were around 80% efficient at this size. The 2-ply bandana performed much better than the 1-ply bandana, with efficiencies of ∼75% and <40% at 2 μm, respectively. The CDC non-sewn and CDC sewn mask materials had efficiencies of ∼50% at 2 μm, and their efficiencies increased with particle size to up to 75% at 5 μm. The thin acrylic still ranked at the bottom. Its efficiency was <30% at 2 μm but reached 75% at 5 μm.
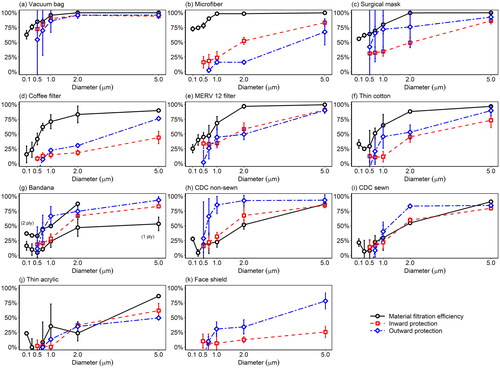
Figure 5. Inward and outward protection efficiency of 10 masks and a face shield. These efficiencies are defined for close-range, face-to-face interactions. The face shield was not tested for material filtration efficiency because it did not allow air flow through the material. Error bars represent the standard deviations of triplicates.
shows the pressure drop across all materials, measured at a flow rate of 3.0 L/min through a sample 25 mm in diameter. Microfiber had the highest pressure drop, nearly 1000 Pa, followed by the coffee filter and thin cotton at ∼380 Pa. The pressure drop through the other materials was <150 Pa, among which the thin acrylic and MERV 12 filter had the lowest values, ∼70 Pa. We further related the pressure drop to the material filtration efficiency using the filter quality factor (Q), as defined by EquationEquation (4)(4)
(4) (Hinds Citation1999; Podgórski, Bałazy, and Gradoń Citation2006), where FE(DP) is the material filtration efficiency at a particle size of DP, and ΔP is the pressure drop:
(4)
(4)
Figure 6. Pressure drop and filter quality factor at 0.3 μm of 10 mask materials, sorted on the basis of material filtration efficiency (). The bandana appears twice because it was tested in both 1-ply and 2-ply configurations. Error bars represent standard deviations of triplicates. In panel (a), there are no error bars for the last two materials as the measurements fell below the detection limit of the pressure gauge.
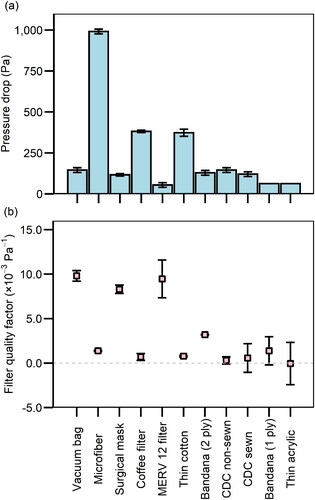
We chose 0.3 μm as the representative particle size for the calculation of Q for ease of comparison with other studies (). Since pressure drop is directly correlated with the breathability of the material, a high Q means a high filtration efficiency can be achieved with a low pressure drop, indicating that the material is efficient and easy to breathe through. The vacuum bag and MERV 12 filter, which are both designed to filter out particles, had the highest Q of all the materials (∼10 × 10−3 Pa−1). The surgical mask also performed well, with an average Q of 7.6 × 10⁻³ Pa−1, not significantly different from Q of the previous two. These results are comparable to those reported in another study conducted under similar conditions (Zangmeister et al. Citation2020). The Q values of the thin cotton, bandana (2 ply), and the other fabrics were <5 × 10⁻³ Pa−1, similar to previously reported values (Zangmeister et al. Citation2020; Zhao et al. Citation2020). Notably, an increase in the number of layers of the bandana resulted in an increase in Q.
SEM images of the materials’ structure can partly explain the differences in the performance. The vacuum bag, which had the highest material filtration efficiency, had the smallest-diameter fibers and such a compact structure that the pores or intervals between fibers were the least perceptible among all the materials (). The fibers of the microfiber cloth were also more tightly woven than those of other materials (), resulting in good filtration efficiency. The materials with low efficiency were generally loosely woven, such as the bandana (1 ply), 200-thread-count pillow case used for the CDC non-sewn mask, cotton t-shirt used for the CDC sewn mask, and thin acrylic (). However, the tightness of the weave was not the only factor influencing the filtration efficiency. For example, the fiber intervals were large for the surgical mask, yet it was composed of multiple layers of different materials (Zhao et al. Citation2020), which made it unique from other materials. Fabric structure alone does not explain filtration efficiency nor the filter quality factor. For instance, the vacuum bag had a compact texture yet a low pressure drop, resulting in a high Q value. Likewise, the surgical mask was not tightly woven, but it was more efficient and thus had a higher Q than many other materials. The number of layers (Drewnick et al. Citation2021), the properties of the fibers including diameter and electrostatic charges (Konda et al. Citation2020a; Ou et al. Citation2020; Podgórski, Bałazy, and Gradoń Citation2006; Zangmeister et al. Citation2020), and the material composition (Zangmeister et al. Citation2020; Zhao et al. Citation2020) all contribute to differences in filter quality factors.
Inward and outward protection efficiency
In this study, the inward protection efficiency (IPE) quantifies the capability of a mask, as worn on a manikin, to protect the wearer by filtering out particles moving in the inward direction through the mask, from the surrounding air to the wearer’s respiratory tract. The outward protection efficiency (OPE) quantifies the capability of a mask for source control, to filter out particles moving in the outward direction through the mask, from the wearer to the surrounding air. Fashioned into a mask, the vacuum bag still ranked first for protection efficiency in both directions, with its IPE and OPE curves close to the material filtration efficiency curve (), especially for particles larger than 1 μm. Both IPE and OPE were >50% at 0.5 μm and >90% for particles larger than 2 μm. However, there were large variations in OPE for particles smaller than 0.7 μm. The IPE and OPE were also similar to the respective material filtration efficiency for the CDC-sewn and thin acrylic masks (), though their performance was much worse than that of the vacuum bag. The OPEs of the CDC sewn mask and thin acrylic mask were ∼75% and ∼50%, respectively, for particles larger than 2 μm, and both masks were not effective at blocking particles smaller than 0.7 μm. Notably, the OPE of the CDC sewn mask was slightly higher than its IPE at 2.0 μm, whereas no significant differences (p > 0.05) between OPE and IPE were observed across all sizes for the thin acrylic mask.
In contrast, the microfiber and coffee filter masks had a much worse IPE and OPE than their material filtration efficiency (), indicating leakage and a poor fit. The OPE for the microfiber mask was <25% for particles smaller than 2 μm, a difference of >50 percentage points compared to its material filtration efficiency. Its IPE was slightly better but still 20–50 percentage points lower than its material filtration efficiency for particles smaller than 2 μm. Similar trends were also observed for the coffee filter, except that its OPE was slightly higher than its IPE at particle sizes larger than 2 μm.
For the surgical mask, thin cotton, and MERV 12 filter, the differences between OPE or IPE and material filtration efficiency were moderate, usually within 25 percentage points (, e, and f). The OPEs of the surgical mask and thin cotton mask were higher than their IPEs but not significantly; and these efficiencies were lower than the corresponding material filtration efficiency. In particular, the average OPE of the surgical mask was substantially better than its IPE at particle sizes ranging from 0.7 to 2 μm, but given the large variability in OPE, such differences were not statistically significant (p > 0.05). There were no significant differences (p > 0.05) between IPE and OPE for the MERV 12 filter across all sizes.
The bandana, CDC non-sewn mask, and the face shield had unique forms. The bandana was folded in half in a triangle to mimic how people would normally wear it; its IPE and OPE fell in between the single-layered and double-layered material filtration efficiency (), with the OPE higher than IPE at a particle size of 1 μm (p < 0.05). The CDC non-sewn mask, whose fit can be adjusted by tightening or loosening the straps, had an OPE that was significantly (p < 0.05) higher than the material filtration efficiency at sizes ranging from 1 to 2 μm. It is likely that stretching or loosening the fabric altered its filtration efficiency. Its average OPE was also higher than the IPE, whereas no significant difference was found between its IPE and material filtration efficiency. The face shield did not block almost any aerosols smaller than 0.7 μm, as expected, for it did not fit closely to the manikin and thus allowed aerosols to travel freely around the shield. However, it exhibited a decent OPE for particles at 5 μm (∼75%) and an IPE of ∼25% for such particles.
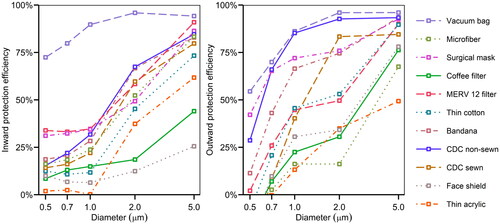
compares the IPE and OPE across all masks. The vacuum bag mask had the best performance in both directions, while the coffee filter mask, thin acrylic mask, and face shield ranked at the bottom. The CDC non-sewn mask and surgical mask followed the vacuum bag closely for OPE but not IPE. Interestingly, the OPE values for masks tested spanned a wide range, whereas their IPE values were closer, except for the vacuum bag. In addition, direct comparison of the two panels in reveals that OPE tended to be higher than IPE, illustrating that many face coverings work better for source control than protection of the wearer, although the difference was not significant in most cases.
Figure 7. Inward and outward protection efficiency for all masks. For improved readability, error bars are not shown here, but they appear in .
In response to a study that suggested that neck gaiters offer very little protection (Fischer et al. Citation2020), we measured the OPE of two neck gaiters, one made of thin 100% polyester and another made of a double layer of microfiber fabric that was 87% polyester and 13% elastane. Their average OPEs were at least 50% at 1 μm and >90% at 5 μm (Figures S5 and S7), similar to the results for the CDC non-sewn mask. When doubled over, the thin polyester neck gaiter achieved an OPE of >90% over the size range of 0.5–5 μm (Figure S6). Due to the late addition of these face coverings and expectation of the donors that they be returned in usable condition, we were not able to measure their material filtration efficiency or IPE.
Droplet deposition analysis found no stains on the slides for all face coverings, indicating that all of them were able to prevent droplets larger than 20 μm from spreading 33 cm away. This result indicated that these large droplets either fell to the bottom of the chamber before reaching the inhaling manikin or were absorbed by the mask fabric, as proven by the red stains on the mask after the DDA measurements. We can attribute both mechanisms to the OPE of masks according to its definition.
Discussion
For most of the face coverings tested, those with a high material filtration efficiency also had a better OPE and IPE. One example is the vacuum bag, which achieved outstanding performance compared to other materials with regards to material filtration efficiency, IPE, and OPE. It was able to filter out at least 60% of particles when tested on the filter holder (i.e., without leakage) and had an OPE and IPE of at least 50% and 75%, respectively, for particles 0.5 μm and larger. The MERV 12 filter, surgical mask, thin cotton, and CDC sewn mask also had decent material filtration efficiencies, OPEs, and IPEs, whereas the thin acrylic mask performed worst or near-worst on all three metrics. However, there were some exceptions, such as the microfiber cloth and coffee filter. The material filtration efficiencies of these two masks was much higher than their OPEs and IPEs (). The coffee filter and microfiber were thick and stiff, resulting in a poor fit with larger gaps between the manikin and the mask, through which particles could short circuit the mask. In contrast, the vacuum bag was thin and soft, which allowed it to conform to the face easily and achieve a high IPE and OPE. Hence, we propose that the stiffness of the material impacts the fit of the mask and can be responsible for large discrepancies between the material filtration efficiency and OPE and IPE. Additionally, differences in mask use among individuals will lead to variability in fit and thus effectiveness.
The CDC non-sewn mask was another exception. Generally, the IPE or OPE should be lower than the material filtration efficiency because the latter was tested in a filter holder with no opportunity for leaks. Nonetheless, the CDC non-sewn mask had a higher OPE than its material filtration efficiency. This unexpected result may be due to its unique form, resulting in a different way of it being stretched. Its two straps can be adjusted to fit it more tightly to the manikin face, especially to the mouth opening. Hence, the increased pressure caused by the expiratory flow was not able to push the CDC non-sewn mask outwards to create gaps between masks and the manikin like other conventional masks do (Lei et al. Citation2013; Liu et al. Citation1993; Mittal, Ni, and Seo Citation2020), minimizing air leakage and bypass through the gaps. The stretching of the fabric may have caused a change in pore size and woven structure, which further impacted the filtration efficiency. In addition, the masks themselves also reduced the expired air velocity, which caused the particles to deposit before they could reach the sampling device, as shown in other studies (Hsiao et al. Citation2020; Mittal, Ni, and Seo Citation2020; Tang et al. Citation2009). The combined effects of reduced gaps and reduced air velocity resulted in a uniquely high OPE for the CDC non-sewn mask. For other masks with a conventional shape, however, these two effects seemed compensatory during evaluation of OPE. While the masks caused a decrease in the expiratory air velocity, they were also pushed outwards by the outgoing flow, creating larger gaps between the masks and manikin. The contradiction in part explained why the differences between OPE and IPE were not as large as expected for the masks with conventional shapes, and why the bandana achieved an OPE better than expected, because it created a larger plenum between itself and the manikin that provided additional containment of the flow to lower the pressure drop and slow the flow jets through the gaps.
During the testing of IPE, we noticed that the vacuum through the inhaling manikin can suck the mask tightly against inlet opening, thus reducing the size of any gaps. This can explain the small differences between the material filtration efficiency and IPE, except for the coffee filter and microfiber as they were stiff and hard to move. However, this phenomenon also illustrates the tradeoff between breathability and filtration efficiency. Therefore, it is important to select fabrics that can achieve both high filtration efficiency and low pressure drop for making masks.
We also observed variable hydrophobicity of the mask material during the testing of IPE and OPE. The fabrics (e.g., thin cotton and thin acrylic) and coffee filter were wetted easily by droplets, whereas the filter materials, including the vacuum bag and the MERV 12 filter, were hydrophobic and kept the droplets on the surface of the material. El-Atab et al. developed a reusable hydrophobic mask and proposed that the hydrophobicity of the mask material might contribute to repelling the droplets (El-Atab et al. Citation2020). However, the role of hydrophobicity in filtration efficiency, IPE, and OPE remains unclear. We recommend future investigations into the influence of wettability or hydrophobicity of the face coverings on their performance.
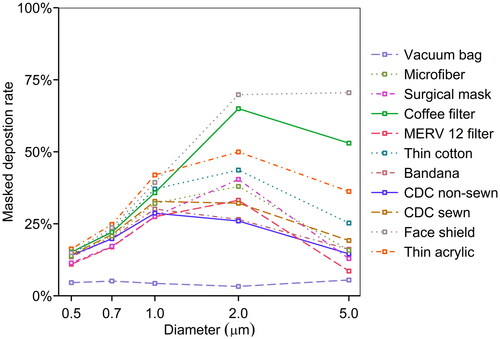
Whether particles actually deposit along the respiratory tract, potentially delivering an inhaled pathogen to a receptor, depends on two factors: (1) their ability to be inhaled into the respiratory tract and (2) their likelihood of depositing. The first can be reduced by a mask, and the second can be predicted as a function of particle size. Accounting for these two factors, we calculated the masked deposition rate (MD) by combining the inward protection effectiveness (IPE) and the International Commission and Radiological Protection (ICRP) model for the total deposition fraction (Hinds Citation1999), as shown in EquationEquation (5)(5)
(5) :
(5)
(5)
shows the masked deposition rate as a function of particle size. Here, lower values are better. The vacuum bag performed best, with a deposition rate of <10% across all sizes. The thin acrylic mask, the coffee filter mask, and the face shield were the worst, with a 50% or higher deposition rate at a particle size of 2 μm. Although there is considerable concern about exposure to virus in the smaller particles, the particles with the highest deposition rate were those around 2 μm. For example, SARS-CoV-2 RNA has been detected in particles in the size range of 1–4 μm (Chia et al. 2020). The smallest particle size considered in this analysis was 0.5 μm, but the deposition efficiency of 0.3 μm particles in the respiratory tract is even lower, so it is possible that concerns about mask efficiency at this size are overstated.
Figure 8. Masked deposition rate of 10 masks and a face shield as a function of the aerodynamic diameter.
This study was designed to test masks under tightly controlled conditions, which necessitate the use of mechanical particle generation and manikins instead of humans. However, this approach presents several limitations. The manikins are much more rigid than human skin, so masks may not fit as tightly. A study involving a head form with pliable, elastomeric skin found that fit factors of respirators were comparable to those measured on humans (Bergman et al. Citation2015), whereas in prior studies with head forms made of more rigid material, the fit factors were not as good (Bergman et al. Citation2014). In addition, our manikins did not perfectly mimic human respiratory activities because the aerosol flow traveled in only one direction in the inhaling manikin and the exhaling manikin. As discussed above, inhalation and exhalation will alter the plenum between the mask and the manikin, thus resulting in changes of the pressure drop and expiratory jets. We investigated only one flow rate out of the possible spectrum from gentle breathing to vigorous sneezing.
The experimental setup was designed to measure OPE in a close-conversation scenario. With a face covering on the exhaling manikin, the aerosol flow could be diverted downwards or sideways, leading to a longer path length to the inhaling manikin and allowing for more time for particles to be removed by settling. Thus, the OPE values reported here are not generalizable to all source control scenarios. In reality, people standing to the side of the emitter may be exposed to more aerosols than indicated by our measurements. This possibility merits further investigation in a follow-up experiment with measurements in multiple locations. Moreover, the chamber may restrict the aerosol flow from fully and freely developing as in the real world, although this impact is expected to be small based on the radius of the jet and dimensions of the chamber (Xu and Antonia Citation2002). On the other hand, the chamber isolated sampling activities from the internal flow field. As in all experiments, there are tradeoffs among simulating a real-world situation, controlling variables, and managing the limitations of equipment. Because an aerosol generator that produces a uniform distribution of particles spanning a wide range of sizes does not exist, compromises are required in the experimental design. For example, large particles were formed by coagulation of small particles, and thus an excessive number of small particles was present, causing some detection issues. Development of methods to produce large concentrations of supermicron particles would be very useful for future studies.
After multiple measurements of the same masks, the fabrics may be overloaded with particles and then release them back to the flow, resulting in resuspension of the particles (Figures S8 and S9). Additionally, masks fit differently on different head shapes. Therefore, the performance of the masks on a human face under real-world conditions will certainly vary from the experimental results in this study. However, there are still some advantages of manikin heads over human faces, as the particle emissions from human clothes and other activities may interfere with the measurements. Particularly, the friction between human faces, jaws, and mask fabrics can release small fabric pieces into the flow stream, complicating the measurement (Asadi, Cappa, et al. Citation2020). We did not test multiple layers of fabric, as prior work has shown that the material filtration efficiency is readily predicted by combining individual layers in series (Drewnick et al. Citation2021). An exception is that the OPE of the doubled-over neck gaiter was much greater than expected from combining a single layer in series. When folded over, the neck gaiter was much more difficult to stretch over the manikin. It fit more tightly, so the pores between fibers were probably smaller than in the single-layer configuration, and performance was greatly improved.
Based on these results and other studies (Drewnick et al. Citation2021), we recommend a three-layer mask consisting of two outer layers of a very flexible, tightly woven fabric and an inner layer consisting of a material designed to filter out particles. The inner layer could be a high efficiency particulate air (HEPA) filter, a MERV 14 or better filter (Azimi, Zhao, and Stephens Citation2014), or a vacuum bag. This approach enables a good fitting mask with high performance in both directions. If the filter material is 60% efficient at the most penetrating particle size and the outer layers are 20% efficient (), the mask would have a minimum efficiency of 74%. At a particle size of 1 μm, where filter materials can easily have an efficiency of 75% and common fabrics 40%, the overall efficiency would be greater than 90%.
Conclusion
In this study, we evaluated the material filtration efficiency, inward protection efficiency, and outward protection efficiency of 10 masks and a face shield on a manikin, using NaCl aerosols over the size range of 0.04 μm to >100 μm. The vacuum bag performed best on all three metrics; it was capable of filtering out 60–96% of particles, and achieved an outward protection efficiency of 50%–95% and an inward protection efficiency of 75%–96% for particles of aerodynamic diameter 0.5 μm and greater. The thin acrylic performed worst, with a material filtration efficiency of <25% for particles at 0.1 μm and larger, and inward and outward protection efficiencies of <50%. The material filtration efficiency was generally positively correlated with either inward or outward protection effectiveness, but stiffer materials were an exception to this relationship as they did not fit as closely to the manikin. Factors including stiffness of the material, the way of wearing the mask (e.g., earloops vs. tied around the head), and material hydrophobicity affected the fit of the mask and thus its performance. Future studies may focus on the influence of material properties on the fit of the mask, and how the transmission of real viruses, including SARS-CoV-2, is altered by wearing the masks.
Supplemental Material
Download PDF (309.9 KB)Acknowledgments
Jin Pan was supported by an Edna B. Sussman Foundation fellowship. Virginia Tech’s Fralin Life Sciences Institute and Institute for Critical Technology and Applied Science provided additional support for this work. Elizabeth Cantando acquired SEM images. TSI Inc. generously loaned the Flow Focusing Monodisperse Aerosol Generator 1520 to the Marr lab. This work used shared facilities at the Virginia Tech National Center for Earth and Environmental Nanotechnology Infrastructure (NanoEarth), a member of the National Nanotechnology Coordinated Infrastructure (NNCI), supported by NSF (ECCS 1542100 and ECCS 2025151).
Additional information
Funding
References
- Allen, J. G., and L. C. Marr. 2020. Recognizing and controlling airborne transmission of sars-cov-2 in indoor environments. Indoor Air. 30 (4):557–8. doi:https://doi.org/10.1111/ina.12697.
- Asadi, S., N. Bouvier, A. S. Wexler, and W. D. Ristenpart. 2020. The coronavirus pandemic and aerosols: Does covid-19 transmit via expiratory particles? Aerosol Sci. Technol. 54:1–638. doi:https://doi.org/10.1080/02786826.2020.1749229.
- Asadi, S., C. D. Cappa, S. Barreda, A. S. Wexler, N. M. Bouvier, and W. D. Ristenpart. 2020. Efficacy of masks and face coverings in controlling outward aerosol particle emission from expiratory activities. Sci. Rep. 10 (1):15665. doi:https://doi.org/10.1038/s41598-020-72798-7.
- Azimi, P., D. Zhao, and B. Stephens. 2014. Estimates of hvac filtration efficiency for fine and ultrafine particles of outdoor origin. Atmos. Environ. 98:337–46. doi:https://doi.org/10.1016/j.atmosenv.2014.09.007.
- Bergman, M. S., X. He, M. E. Joseph, Z. Zhuang, B. K. Heimbuch, R. E. Shaffer, M. Choe, and J. D. Wander. 2015. Correlation of respirator fit measured on human subjects and a static advanced headform. J. Occup. Environ. Hygiene 12 (3):163–71. doi:https://doi.org/10.1080/15459624.2014.957832.
- Bergman, M. S., Z. Zhuang, D. Hanson, B. K. Heimbuch, M. J. McDonald, A. J. Palmiero, R. E. Shaffer, D. Harnish, M. Husband, and J. D. Wander. 2014. Development of an advanced respirator fit-test headform. J. Occup. Environ. Hyg. 11 (2):117–25. doi:https://doi.org/10.1080/15459624.2013.816434.
- Centers for Disease Control and Prevention. 2020. How to make masks. Accessed October 23, 2020. https://www.cdc.gov/coronavirus/2019-ncov/prevent-getting-sick/how-to-make-cloth-face-covering.html.
- Chia, P. Y., K. K. Coleman, Y. K. Tan, S. W. X. Ong, M. Gum, S. K. Lau, X. F. Lim, A. S. Lim, S. Sutjipto, P. H. Lee, et al. 2020. Detection of air and surface contamination by sars-cov-2 in hospital rooms of infected patients. Nat. Commun. 11 (1):2800. doi:https://doi.org/10.1038/s41467-020-16670-2.
- Chu, D. K., E. A. Akl, S. Duda, K. Solo, S. Yaacoub, H. J. Schünemann, D. K. Chu, E. A. Akl, A. El-Harakeh, A. Bognanni, et al. 2020. Physical distancing, face masks, and eye protection to prevent person-to-person transmission of sars-cov-2 and covid-19: A systematic review and meta-analysis. The Lancet 395 (10242):1973–87. doi:https://doi.org/10.1016/S0140-6736(20)31142-9.
- Drewnick, F., J. Pikmann, F. Fachinger, L. Moormann, F. Sprang, and S. Borrmann. 2021. Aerosol filtration efficiency of household materials for homemade face masks: Influence of material properties, particle size, particle electrical charge, face velocity, and leaks. Aerosol Sci. Technol. 55 (1):63–79. doi:https://doi.org/10.1080/02786826.2020.1817846.
- El-Atab, N., N. Qaiser, H. Badghaish, S. F. Shaikh, and M. M. Hussain. 2020. Flexible nanoporous template for the design and development of reusable anti-covid-19 hydrophobic face masks. ACS Nano 14 (6):7659–65. doi:https://doi.org/10.1021/acsnano.0c03976.
- Fischer, E. P., M. C. Fischer, D. Grass, I. Henrion, W. S. Warren, and E. Westman. 2020. Low-cost measurement of face mask efficacy for filtering expelled droplets during speech. Sci. Adv. 6 (36):eabd3083. doi:https://doi.org/10.1126/sciadv.abd3083.
- Gupta, J. K., C.-H. Lin, and Q. Chen. 2010. Characterizing exhaled airflow from breathing and talking. Indoor Air. 20 (1):31–9. doi:https://doi.org/10.1111/j.1600-0668.2009.00623.x.
- Hadei, M., P. K. Hopke, A. Jonidi, and A. Shahsavani. 2020. A letter about the airborne transmission of sars-cov-2 based on the current evidence. Aerosol Air Qual. Res. 20 (5):911–4. doi:https://doi.org/10.4209/aaqr.2020.04.0158.
- Hinds, W. C. 1999. Aerosol technology: Properties, behavior, and measurement of airborne particles. New York: John Wiley & Sons.
- Howard, J., A. Huang, Z. Li, Z. Tufekci, V. Zdimal, H.-M. van der Westhuizen, A. von Delft, A. Price, L. Fridman, L.-H. Tang, et al. 2021. An evidence review of face masks against covid-19. Proc. Natl. Acad. Sci. USA. 118 (4):e2014564118. doi:https://doi.org/10.1073/pnas.2014564118.
- Hsiao, T.-C., H.-C. Chuang, S. M. Griffith, S.-J. Chen, and L.-H. Young. 2020. Covid-19: An aerosol’s point of view from expiration to transmission to viral-mechanism. Aerosol Air Qual. Res. 20:905–10. doi:https://doi.org/10.4209/aaqr.2020.04.0154.
- Jefferson, T., R. Foxlee, C. Del Mar, L. Dooley, E. Ferroni, B. Hewak, A. Prabhala, S. Nair, and A. Rivetti. 2008. Physical interventions to interrupt or reduce the spread of respiratory viruses: Systematic review. BMJ 336 (7635):77–80. doi:https://doi.org/10.1136/bmj.39393.510347.BE.
- Johnson, G. R., L. Morawska, Z. D. Ristovski, M. Hargreaves, K. Mengersen, C. Y. H. Chao, M. P. Wan, Y. Li, X. Xie, D. Katoshevski, et al. 2011. Modality of human expired aerosol size distributions. J. Aerosol Sci. 42 (12):839–51. doi:https://doi.org/10.1016/j.jaerosci.2011.07.009.
- Konda, A., A. Prakash, G. A. Moss, M. Schmoldt, G. D. Grant, and S. Guha. 2020a. Aerosol filtration efficiency of common fabrics used in respiratory cloth masks. ACS Nano 14 (5):6339–47. doi:https://doi.org/10.1021/acsnano.0c03252.
- Konda, A., A. Prakash, G. A. Moss, M. Schmoldt, G. D. Grant, and S. Guha. 2020b. Response to letters to the editor on aerosol filtration efficiency of common fabrics used in respiratory cloth masks: Revised and expanded results. ACS Nano. 14 (9):10764–70. doi:https://doi.org/10.1021/acsnano.0c04897.
- Lei, Z., J. Yang, Z. Zhuang, and R. Roberge. 2013. Simulation and evaluation of respirator faceseal leaks using computational fluid dynamics and infrared imaging. Ann. Occup. Hyg. 57 (4):493–506. doi:https://doi.org/10.1093/annhyg/mes085.
- Leung, N. H. L., D. K. W. Chu, E. Y. C. Shiu, K.-H. Chan, J. J. McDevitt, B. J. P. Hau, H.-L. Yen, Y. Li, D. K. M. Ip, J. S. M. Peiris, et al. 2020. Respiratory virus shedding in exhaled breath and efficacy of face masks. Nat. Med. 26 (5):676–80. doi:https://doi.org/10.1038/s41591-020-0843-2.
- Li, L., M. Niu, and Y. Zhu. 2021. Assessing the effectiveness of using various face coverings to mitigate the transport of airborne particles produced by coughing indoors. Aerosol Sci. Technol. 55 (3):332–12. doi:https://doi.org/10.1080/02786826.2020.1846679.
- Lindsley, W. G., F. M. Blachere, B. F. Law, D. H. Beezhold, and J. D. Noti. 2021. Efficacy of face masks, neck gaiters and face shields for reducing the expulsion of simulated cough-generated aerosols. Aerosol Sci. Technol. 55 (4):449–457. doi:https://doi.org/10.1080/02786826.2020.1862409.
- Lindsley, W. G., J. S. Reynolds, J. V. Szalajda, J. D. Noti, and D. H. Beezhold. 2013. A cough aerosol simulator for the study of disease transmission by human cough-generated aerosols. Aerosol Sci. Technol. 47 (8):937–44. doi:https://doi.org/10.1080/02786826.2013.803019.
- Liu, B. Y. H., J.-K. Lee, H. Mullins, and S. G. Danisch. 1993. Respirator leak detection by ultrafine aerosols: A predictive model and experimental study. Aerosol Sci. Technol. 19 (1):15–26. doi:https://doi.org/10.1080/02786829308959617.
- Liu, Y., Z. Ning, Y. Chen, M. Guo, Y. Liu, N. K. Gali, L. Sun, Y. Duan, J. Cai, D. Westerdahl, et al. 2020. Aerodynamic analysis of sars-cov-2 in two Wuhan hospitals. Nature 582 (7813):557–60. doi:https://doi.org/10.1038/s41586-020-2271-3.
- Lyu, W., and G. L. Wehby. 2020. Community use of face masks and covid-19: Evidence from a natural experiment of state mandates in the US. Health Aff. (Millwood) 39 (8):1419–25. doi:https://doi.org/10.1377/hlthaff.2020.00818.
- Makison Booth, C., M. Clayton, B. Crook, and J. M. Gawn. 2013. Effectiveness of surgical masks against influenza bioaerosols. J. Hosp. Infect. 84 (1):22–6. doi:https://doi.org/10.1016/j.jhin.2013.02.007.
- Marr, L. C., J. W. Tang, J. Van Mullekom, and S. S. Lakdawala. 2019. Mechanistic insights into the effect of humidity on airborne influenza virus survival, transmission and incidence. J. R. Soc. Interface 16 (150):20180298. doi:https://doi.org/10.1098/rsif.2018.0298.
- Milton, D. K., M. P. Fabian, B. J. Cowling, M. L. Grantham, and J. J. McDevitt. 2013. Influenza virus aerosols in human exhaled breath: Particle size, culturability, and effect of surgical masks. PLoS Pathog. 9 (3):e1003205. doi:https://doi.org/10.1371/journal.ppat.1003205.
- Mittal, R., R. Ni, and J.-H. Seo. 2020. The flow physics of covid-19. J. Fluid Mech. 894: article number: F2. doi:https://doi.org/10.1017/jfm.2020.330.
- Morawska, L., J. W. Tang, W. Bahnfleth, P. M. Bluyssen, A. Boerstra, G. Buonanno, J. Cao, S. Dancer, A. Floto, F. Franchimon, et al. 2020. How can airborne transmission of covid-19 indoors be minimised? Environ. Int. 142:105832. doi:https://doi.org/10.1016/j.envint.2020.105832.
- Mueller, W., C. J. Horwell, A. Apsley, S. Steinle, S. McPherson, J. W. Cherrie, and K. S. Galea. 2018. The effectiveness of respiratory protection worn by communities to protect from volcanic ash inhalation. Part i: Filtration efficiency tests. Int. J. Hyg. Environ. Health. 221 (6):967–76. doi:https://doi.org/10.1016/j.ijheh.2018.03.012.
- Oberg, T., and L. M. Brosseau. 2008. Surgical mask filter and fit performance. Am. J. Infect. Control. 36 (4):276–82. doi:https://doi.org/10.1016/j.ajic.2007.07.008.
- Ou, Q., C. Pei, S. C. Kim, E. Abell, and D. Y. H. Pui. 2020. Evaluation of decontamination methods for commercial and alternative respirator and mask materials - View from filtration aspect. J. Aerosol Sci. 150:105609. doi:https://doi.org/10.1016/j.jaerosci.2020.105609.
- Podgórski, A., A. Bałazy, and L. Gradoń. 2006. Application of nanofibers to improve the filtration efficiency of the most penetrating aerosol particles in fibrous filters. Chem. Eng. Sci. 61 (20):6804–15. doi:https://doi.org/10.1016/j.ces.2006.07.022.
- Prather, K. A., C. C. Wang, and R. T. Schooley. 2020. Reducing transmission of sars-cov-2. Science 368 (6498):1422–24. doi:https://doi.org/10.1126/science.abc6197.
- Rengasamy, S., B. Eimer, and R. E. Shaffer. 2010. Simple respiratory protection-evaluation of the filtration performance of cloth masks and common fabric materials against 20-1000 nm size particles. Ann. Occup. Hyg. 54 (7):789–98. doi:https://doi.org/10.1093/annhyg/meq044.
- Tang, J. W., T. J. Liebner, B. A. Craven, and G. S. Settles. 2009. A schlieren optical study of the human cough with and without wearing masks for aerosol infection control. J. R. Soc. Interface 6 (suppl_6): S727–S36. doi:https://doi.org/10.1098/rsif.2009.0295.focus.
- Tang, J. W., A. D. Nicolle, C. A. Klettner, J. Pantelic, L. Wang, A. B. Suhaimi, A. Y. Tan, G. W. Ong, R. Su, C. Sekhar, D. D. Cheong, and W. Tham. 2013. Airflow dynamics of human jets: sneezing and breathing - potential sources of infectious aerosols. PloS One 8 (4): e59970.
- The Economist. 2020. Masks probably slow the spread of covid-19. Accessed October 23, 2020. https://www.economist.com/science-and-technology/2020/05/28/masks-probably-slow-the-spread-of-covid-19.
- van der Sande, M., P. Teunis, and R. Sabel. 2008. Professional and home-made face masks reduce exposure to respiratory infections among the general population. PLOS One. 3 (7):e2618. doi:https://doi.org/10.1371/journal.pone.0002618.
- Wong, S. H., J. Y. C. Teoh, C.-H. Leung, W. K. K. Wu, B. H. K. Yip, M. C. S. Wong, and D. S. C. Hui. 2020. Covid-19 and public interest in face mask use. Am. J. Respir. Crit. Care Med. 202 (3):453–5. doi:https://doi.org/10.1164/rccm.202004-1188LE.
- Xiao, J., E. Y. C. Shiu, H. Gao, J. Y. Wong, M. W. Fong, S. Ryu, and B. J. Cowling. 2020. Nonpharmaceutical measures for pandemic influenza in nonhealthcare settings-personal protective and environmental measures. Emerg. Infect. Dis. 26 (5):967–75. doi:https://doi.org/10.3201/eid2605.190994.
- Xie, X., Y. Li, H. Sun, and L. Liu. 2009. Exhaled droplets due to talking and coughing. J. R. Soc. Interface 6 (suppl_6): S703–S14. doi:https://doi.org/10.1098/rsif.2009.0388.focus.
- Xu, G., and R. Antonia. 2002. Effect of different initial conditions on a turbulent round free jet. Exp. Fluids 33 (5):677–83. doi:https://doi.org/10.1007/s00348-002-0523-7.
- Yan, J., M. Grantham, J. Pantelic, P. J. Bueno de Mesquita, B. Albert, F. Liu, S. Ehrman, and D. K. Milton. 2018. Infectious virus in exhaled breath of symptomatic seasonal influenza cases from a college community. Proc. Natl. Acad. Sci. USA 115 (5):1081–1086. doi:https://doi.org/10.1073/pnas.1716561115.
- Yang, W., S. Elankumaran, and L. C. Marr. 2011. Concentrations and size distributions of airborne influenza a viruses measured indoors at a health centre, a day-care centre and on aeroplanes. J. R. Soc. Interface 8 (61):1176–1184. doi:https://doi.org/10.1098/rsif.2010.0686.
- Zangmeister, C. D., J. G. Radney, E. P. Vicenzi, and J. L. Weaver. 2020. Filtration efficiencies of nanoscale aerosol by cloth mask materials used to slow the spread of sars-cov-2. ACS Nano. 14 (7):9188–9200. doi:https://doi.org/10.1021/acsnano.0c05025.
- Zhao, M., L. Liao, W. Xiao, X. Yu, H. Wang, Q. Wang, Y. L. Lin, F. S. Kilinc-Balci, A. Price, L. Chu, et al. 2020. Household materials selection for homemade cloth face coverings and their filtration efficiency enhancement with triboelectric charging. Nano Lett. 20 (7):5544–5552. doi:https://doi.org/10.1021/acs.nanolett.0c02211.
- Zhou, J., J. Wei, K.-T. Choy, S. F. Sia, D. K. Rowlands, D. Yu, C.-Y. Wu, W. G. Lindsley, B. J. Cowling, J. McDevitt, et al. 2018. Defining the sizes of airborne particles that mediate influenza transmission in ferrets. Proc. Natl. Acad. Sci. USA 115 (10):E2386–92. doi:https://doi.org/10.1073/pnas.1716771115.