
 ?Mathematical formulae have been encoded as MathML and are displayed in this HTML version using MathJax in order to improve their display. Uncheck the box to turn MathJax off. This feature requires Javascript. Click on a formula to zoom.
Abstract
Accurate and precise retrievals of aerosol complex refractive indices (m) are essential to constraining the direct radiative effect of atmospheric aerosols. Despite this, there is no generally accepted method for constraining the uncertainty in full-distribution aerosol complex refractive index retrievals. This is in part due to condition-dependent and solution-dependent uncertainties which propagate through retrievals. Here, the Refractive Index Confidence Explorer (RICE), a program written in WaveMetrics Igor Pro, is presented. RICE applies a Monte Carlo-like method to propagate uncertainties through a full size distribution inverse Mie method (FD-IMM) for m retrievals. The m retrieval and RICE uncertainty analysis use absorption coefficients, scattering coefficients, aerosol size distributions, and measurement uncertainties as inputs. RICE iteratively tests a series of m values for their ability to produce the retrieved m under perturbed conditions. Perturbations account for uncertainties in optical, particle size, and particle number concentration measurements. RICE then uses these data to calculate semi-empirical probability distributions which are used to provide confidence intervals for the real (n) and imaginary (k) components of m. RICE provides measurement by measurement uncertainty estimations enabling estimation of uncertainty even when conditions are highly dynamic, like those associated with field measurements. When RICE is applied to idealized test cases and external data, uncertainty is shown to be dynamic in relation to the value of the retrieved m (solution) and the nature of the particle size distribution (measurement condition). Within these cases, m uncertainties were shown to be large for the upper end of n and k values explored here (i.e., n = 1.8 and k = 0.5, at 375 nm) under uncertainty conditions typical of modern particle and optical measurement technologies, suggesting FD-IMM’s usefulness may be limited by instrumental uncertainties under some measurement conditions. However, FD-IMM retrievals may still provide reasonable estimates of m when n <∼1.6 and k < 0.1.
Copyright © 2021 American Association for Aerosol Research
EDITOR:
1. Introduction
The largest uncertainties in modern climate models are aerosol direct and indirect effects (Intergovernmental Panel on Climate Change Citation2014). Aerosol direct effects occur when a suspended particle scatters or absorbs solar radiation, causing, in conjunction with the albedo of the underlying scene (e.g., surface or cloud albedo) cooling or heating at the top of the atmosphere (TOA) and affecting the global radiation budget, local cloud cover, weather, and surface temperatures (Bond et al. Citation2013; Ramanathan and Carmichael Citation2008; Perrone, Tafuro, and Kinne Citation2012; Chylek and Wong Citation1995). The magnitude of aerosols’ direct radiative forcing is partially controlled by particle concentration, size distribution, vertical distribution, and complex refractive index (m). Therefore, if global climate models are to be improved, the uncertainty of measurements of these parameters must be constrained. Here, we present the Refractive Index Confidence Explorer (RICE), a new method to constrain uncertainties in determination of m from aerosol particles.
The complex refractive index is a compositionally controlled and wavelength dependent measure of how a material interacts with radiation (Hecht Citation2002). A material’s m is composed of a real component (n) and an imaginary component (k) (EquationEquation (1.1)(1.1)
(1.1) ).
(1.1)
(1.1)
Within a bulk material, the real component describes the phase velocity of radiation, and the imaginary component describes the absorption of radiation, i.e., the physical conversion of radiation into thermal energy. For particles, the relationship between m and optical effects are complicated. When radiation interacts with a particle, it can maintain its original trajectory, have its direction changed (scattering), or transform into thermal energy (absorption). Because aerosol scattering can redirect solar radiation back to space, in the context of the Earth’s atmosphere, scattering is a cooling process. Conversely, absorption increases the thermal energy of the air parcels surrounding the particles, leading to atmospheric heating. Actual net radiative effects of particles are also determined by the particle location in the atmosphere and its size (Pilinis, Pandis, and Seinfeld Citation1995).
Since m is fixed for a given substance at a given wavelength, it can be used to predict the optical properties of aerosol particles of a given substance. In fact, many models predict aerosol radiative effects by combining compositionally dependent m values, size distribution estimates, and a model of particle-radiation interactions, such as Mie theory (Balzarini et al. Citation2015; Myhre et al. Citation2013; Wang et al. Citation2014). The use of measured m values to predict aerosol particles optical properties in models makes it essential to understand the accuracy and precision of m measurements.
This work specifically aims to provide a tool for analyzing the precision of a method for retrieving m in-situ from an aerosol. These m retrievals rely heavily on assumptions of aerosol homogeneity and sphericity. Special care should be taken when applying the methods discussed below to an aerosol with non-homogenous particle compositions and/or containing non-spherical particles. In these cases, the retrievals may be referred to as, “effective m”, which is the m value that produces the observed optical properties if the particles were homogeneous and spherical, but not the true m of the material constituting the particles. Such values may be used to infer chemical or morphological composition changes in aerosols but shouldn’t be used to extrapolate to optical properties of non-spherical aerosols with similar compositions.
Although m values of the major aerosol components have been studied for decades,(Toon, Pollack, and Khare Citation1976) m values of many aerosol components, and particularly organic aerosols (OA), are uncertain. OA account for a large fraction of fine atmospheric aerosols (Q. Zhang et al. Citation2007; Murphy et al. Citation2006) and are known to play a significant role in the Earth’s radiative budget (Y. Zhang et al. Citation2017). Despite this, the m of a given OA at a specific wavelength is difficult to characterize due to complexity of OA composition and the uncertainties associated with in-situ measurement techniques of m (Moise, Flores, and Rudich Citation2015). To increase certainty in the radiative effects of OA, and other aerosols, how uncertainties propagate through m measurement techniques must be understood.
By assuming particle sphericity, inter-, and intra-particle homogeneity, and that all particles share the same m, Inverse Mie Methods (IMMs) can apply Mie theory to describe the optical behavior of aerosols (Bohren and Huffman Citation1983; Mie Citation1908). It should be noted that shape, intra-, and inter-particle inhomogeneity present sources of error from IMMs not accounted for by RICE. Mie theory is an analytical solution to the Maxwell equations that describes radiation scattering and absorption by spherical or cylindrical particles. Mie theory is particularly useful when particle diameters are on the same scale as the radiation wavelength, as they are with submicron aerosols, because Raleigh and geometric optics do not provide accurate representations of these interactions.
Simply stated, IMMs compare predicted scattering and absorption coefficients of aerosol particles at different test m values, obtained using Mie theory and the particle size distributions, to the observed scattering and absorption coefficients of the aerosol particles. The test m which best predicts the observed scattering and absorption coefficients is then selected as the “retrieved” m (mr). If all assumptions of IMMs are known to be met, the retrieved value is reported as the m of the aerosol particles. If all the assumptions of Mie theory are not met, as is often the case in field studies, mr values have been reported as the equivalent or effective m (Zhao et al. Citation2020; Jurányi and Weller Citation2019; Lee et al. Citation2011). This does not apply to all field studies; for example, aged secondary organic aerosol systems generally conform to IMM assumptions.
One commonly used IMM is size-selected (SS-IMM), where multiple monodisperse distributions from the same aerosol population are sampled (Mason et al. Citation2012; Miles et al. Citation2011; Zarzana, Cappa, and Tolbert Citation2014). The applicability of SS-IMMs to field and chamber datasets is somewhat limited due to the need for high concentrations of particles at multiple predetermined diameters and the time required to sample multiple mono-disperse distributions from an aerosol population. Another IMM, which can retrieve m quick enough for field applications, is the full distribution inverse Mie method (FD-IMM). The FD-IMM method uses a size distribution measured over a large range of particle diameters (e.g., sub-micrometer range) and its corresponding optical properties to retrieve m on a time scale of several minutes. The rate of retrieval is currently limited by the collection rate of size distribution data. Variations on FD-IMM have been recently applied under a variety of field and chamber conditions (Bluvshtein et al. Citation2016; Bluvshtein et al. Citation2017; Denjean et al. Citation2014; Denjean, Formenti, Picquet-Varrault, Camredon, et al. Citation2015; Denjean, Formenti, Picquet-Varrault, Pangui, et al. Citation2015; De Haan et al. Citation2017; Dingle et al. Citation2019; Jiang et al. Citation2019). Within these studies, the FD-IMM methodology varies; for example, Dingle et al. applied a chi squared based—and Jiang et al. applied a difference based-minimization methodology.
FD-IMM and SS-IMMs discussed above generally rely on integrated optical properties (i.e., there is no accounting for the directionality of scattering). Other IMMs investigate m though the observations of the phase function (angle dependence of scattering) of population of particles and comparison with the expected phase function, generated by Mie theory (Hovenier et al. Citation2003; Barkey, Paulson, and Chung Citation2007). These methods have some advantages over FD-IMMs and SS-IMMs in that they directly observe the forward and back scattering of population of particles. If Mie and IMM assumptions are known to be true, retrievals from any of these methods can be used to predict the scattering phase function of particles.
Methods currently applied to estimate uncertainties associated with m retrievals include repeated measurement of a standard material or a sample (Lambe et al. Citation2013), estimating a maximum and minimum (hereafter min-max) bound by mathematically considering the extremes of analytical uncertainties (Dingle et al. Citation2019; Jiang et al. Citation2019), determining possible minimum and maximum solutions with the PyMieScatt package which graphically investigates bounds (Sumlin, Heinson, and Chakrabarty Citation2018; Sumlin et al. Citation2017), or a combination of these methods (Nakayama et al. Citation2010, Citation2018, Citation2015). The uncertainty of an IMM, and FD-IMM, depends on the uncertainty in analytical measurements of absorption coefficients, scattering coefficients, particle diameters, and particle number concentrations. In light of this, Monte-Carlo methods and uncertainty sensitivity analyses have also been recently applied to help constrain the uncertainties in IMMs (Cotterell et al. Citation2020; Radney and Zangmeister Citation2018).
Estimating IMM uncertainty is complicated by solution-dependent uncertainty (solution being the retrieved m of the aerosol) and condition-dependent uncertainty (condition being the state of the optical measurement instrument or the shape of the measured particle size distribution) (Radney and Zangmeister Citation2018). An example system with no solution-dependent uncertainty is a meter stick: no matter the value measured, the uncertainty will be the smallest unit of a measure on the stick. Conversely, many systems, such as a nephelometer, often report their uncertainty as a value relative to the magnitude of the solution (i.e., 5%, in the detectable range), so the uncertainty can be estimated for any measurement magnitude by knowing only the solution. Since the m relates to particle optical properties in a complex manor, different retrieved m (i.e., solutions) will have differing uncertainties even in the case of identical measurement conditions. Condition-dependent uncertainty can be thought of as that dependent on the measurement conditions, including instrumental uncertainties or the unique size distribution used in a retrieval. For a case with a fixed m, m retrievals from two compositionally identical aerosols with different particle size distributions may have different uncertainties due to the complex relationship between m, particle diameter, and aerosol optical properties. In reality, there is an interplay between these uncertainty drivers, and thus each retrieval of m has unique uncertainty conditions. The uniqueness of each retrieval means traditional methods of uncertainty estimation, such as the repeated measurement of a known standard or mathematical propagation of analytical uncertainties, should not be applied to FD-IMM measurements. Due to this, there is not a generally accepted method of propagating uncertainties through FD-IMM.
In this work, we demonstrate a stochastic modeling tool which semi-empirically estimates the uncertainties associated with mr by FD-IMM. This tool, RICE, seeks to provide a method of estimating the uncertainty associated with each discrete m retrieval, by actively accounting for both solution- and condition-dependent uncertainties. RICE performs this task by iteratively testing a series of m values for the probability they yield the mr under the known analytical uncertainty conditions, assuming random gaussian uncertainties. Using this approach, RICE semi-empirically estimates concrete and statistically meaningful values (i.e., confidence intervals) for m components in aerosol-relevant m ranges and under typical uncertainty conditions. It should be noted that RICE does not account for errors caused by violating the major assumptions of IMMs (e.g., particle sphericity and homogeneous intra- and inter-particle composition), instead RICE assesses the precision of these IMM methods, not the accuracy. In this work, RICE is demonstrated using uncertainties similar to those found in current aerosol microphysical measurements and evaluated over a range of m values and representative size distributions. The RICE code is freely available as part of this publication and has been included in the online supplementary information (SI). Additionally, the code can be accessed at https://github.com/FrieCookies/RICE.
2. Description of RICE
In this section the theory and structure of RICE is presented. First, the FD-IMM around which RICE is built is detailed (Section 2.1). Second, the major steps of the RICE analysis are described at a high level (Section 2.2.1). Third, the major steps of RICE are explained in detail (Sections 2.2.2–2.2.6).
2.1. Basic complex refractive index retrieval
Complex refractive index retrievals discussed hereafter are based upon Mie Theory scattering and absorption by a homogeneous sphere, as described in detail by Bohren and Huffman (Citation1983) (). For a given size distribution and potential m (mtest), the theoretical optical coefficients ( are calculated (EquationEquation (2.1)
(2.1a)
(2.1a) ):
(2.1a)
(2.1a)
(2.1b)
(2.1b)
Figure 1. General schematic of an m retrieval used within RICE. Secondary filters, (two large black boxes) help ensure outputs are reasonable given the analytical uncertainties and input mtest list. σscat and σabs are, respectively, the relative uncertainty associated with the measurement of the scattering and absorption coefficients. Larger version included in the supplement as .
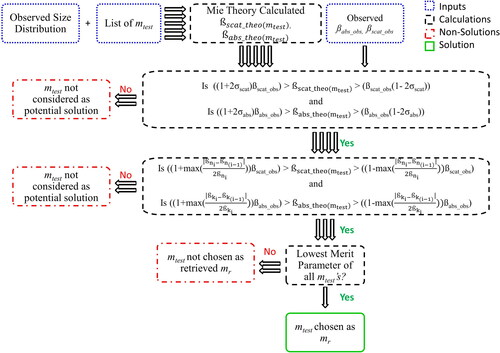
where Qscat and Qabs are the size dependent scattering and absorption efficiencies of a particle as calculated using Mie theory. Optical efficiencies relate the amount of radiation attenuated by each process to the particle diameter (dp) at a given wavelength ( and m. N(i) is the number concentration of particles within each size bin; dp(i) is the representative particle diameter of a size bin. The results are summed from the smallest bin diameter to the largest. Before inputting N data into an m retrieval, or RICE, it is important that the data be corrected for presence of multiply charge particles which otherwise could potentially lead to erroneous results (Zarzana, Cappa, and Tolbert Citation2014; Mason et al. Citation2012; Miles et al. Citation2011).
To retrieve mr ( and SI Figure S1), and
are compared to the observed values (
) through a merit parameter over a range of possible m (mtest). The range of mtests for the retrieval is chosen manually, prior to input into RICE, which determines mtest iteratively. In this work, before mr is determined, mtest are first filtered with “reasonability test” thresholds, which are based on the measurement uncertainties and the range of mtest values. These thresholds ensure that the theoretical optical coefficients which yield the lowest merit parameter are not unreasonably different from the observations. The first is based on the principle that 95% of true values should be within ±2σ of the observed value, assuming gaussian errors. The second limits the tolerance for theoretical absorption and scattering coefficients to be different from the observations, using the theoretical optical coefficients calculated with the input mtest to prevent overweighting of either observations. For
the first threshold is set at
(where
is the relative instrumental uncertainty associated with
defined as one relative standard deviation) and the second at half the maximum relative
difference between theoretical scattering coefficients using consecutive ntest values, i.e., max(
) (k held constant). For
the first threshold is set at
(where
is relative instrumental uncertainty associated with
defined as one relative standard deviation) and the second at half the maximum relative
difference between theoretical absorption coefficients using consecutive ktest values, i.e., max(
(n held constant).
After filtering, a merit parameter is calculated for each mtest and the mtest with the smallest merit parameter is chosen as mr. Different merit parameters have been used for m retrievals. Examples include the summed difference ( EquationEquation (2.2)
(2.2)
(2.2) ) and chi squared (
EquationEquation (2.3)
(2.3)
(2.3) ) (Denjean, Formenti, Picquet-Varrault, Camredon, et al. Citation2015; Denjean, Formenti, Picquet-Varrault, Pangui, et al. Citation2015; Denjean et al. Citation2014; De Haan et al. Citation2017; Bluvshtein et al. Citation2017; Bluvshtein et al. Citation2016; Jiang et al. Citation2019; Dingle et al. Citation2019; Lambe et al. Citation2013):
(2.2)
(2.2)
(2.3)
(2.3)
Where and
are the relative standard deviations associated with the averaging of ßscat and ßabs measurements during the time period of a size distribution measurement. For this work,
is used as the merit parameter, but RICE is also able to analyze uncertainties associated with
2.2. RICE procedure
RICE is a tool which estimates the uncertainties within the FD-IMM. The goal of RICE is to constrain which m (mtrue=ntrue+iktrue) could have yielded the retrieved m (mr = nr + ikr) under the given uncertainty conditions. RICE defines the mtrue as the m which would accurately reproduce the observed optical properties if instrumental measurements were perfect and all particles were compositionally homogeneous and internally mixed spheres. As an example, if the retrieved value (mr) was 1.48 + 0.001i, RICE determines the probability that a given mtrue, say 1.5 + 0.002i, yielded mr by simulating perturbed cases where mtrue was observed after accounting for the actual instrumental uncertainties. Then, by asking this question of many values of mtrue, the probability distribution of mtrue which potentially had solutions of mr can be obtained.
The output are the bounds of a statistically relevant range (e.g., 95% confidence interval) of mtrue values which could have produced the given mr under the measurement conditions. RICE calculates the mtrue probability distribution through the following steps ( and SI Figure S2). Prior to applying RICE, the user must run the FD-IMM retrieval that is also included with RICE to obtain mr; this requires the size distribution and optical coefficient observations as described in Section 2.1
Figure 2. General schematic of RICE for a single mr value. Larger version included in the supplement as Figure S2. *All mtrue values are used as mtest values for these calculations.
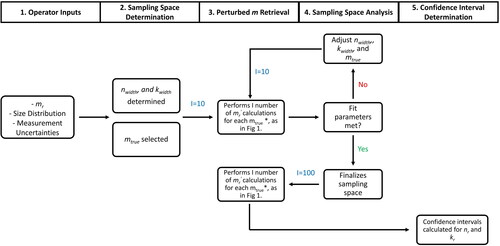
The operator supplies (1) the retrieved m (mr), (2) an observed size distribution, and (3) the relative instrumental uncertainties associated with the measurements of
dp, and N (i.e., σscat, σabs, σdp, σN, respectively).
RICE establishes a trial ntrue and ktrue sampling space around the input mr (Section 2.2.1). This sampling space contains discrete numbers of mtrue values in a matrix of size (i + 1) × (j + 1) where i and j are even numbers respectively equal to the number of discrete ntrue and ktrue around the nr and kr being investigated.
Within the established sampling space, RICE uses the input uncertainties to randomly perturb size distributions and predicted theoretical optical properties for each mtrue 10 times. Then, using these perturbed optical parameters as inputs, RICE performs m retrievals with the discrete mtrue values as possible solutions (i.e., mtrue values are used as mtest in the FD-IMM) (Section 2.2.2).
From these retrievals, the number of iterations each mtrue retrieved the target mr is determined. Treating n and k independently, RICE uses these results to estimate the probability that the m of the aerosol population was mtrue if mr was retrieved (P(mtrue|mr)) (Section 2.2.3):
RICE then calculates the cumulative probability distributions for
2.2.1. Sampling space determination
To ensure RICE’s solution is based off mtrue values that could yield mr, an appropriate sampling space must be determined around mr. The half-width of the initial trial sampling space around mr (nwidth, kwidth) is established using the following equations:
(2.5a)
(2.5a)
(2.5b)
(2.5b)
Considering this sampling space, discrete ntrue and ktrue values are chosen within the nr ± nwidth and kr ± kwidth space. These values are chosen at equal intervals of nstep and kstep around mr (horizontal location of red dots in show the placement of ntrue).
(2.6a)
(2.6a)
(2.6b)
(2.6b)
Figure 3. Example cumulative probability distribution and the associated sigmoidal fit parameters. nwidth, nstep, n0.5, Max, P0, and Height are annotated.
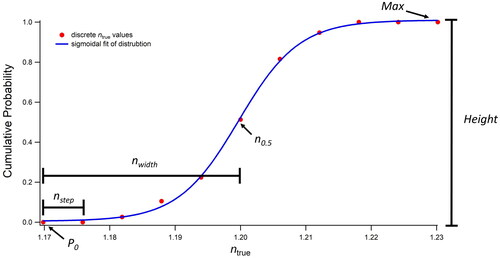
Where i is the number of n and j the number of k to be tested around mr.
2.2.2. Perturbed m retrieval
For each sampling space and final confidence interval determination, RICE performs the following calculations I times for each mtrue (), where each I is a perturbed retrieval with randomly perturbed input, driven by the provided observation uncertainties. The value of I depends on the stage of RICE analysis. During the sampling space determination, I is low (10 for this work) but it is increased when determining the final interval (100 for this work). These values were chosen in an effort to minimize computational effort while maintaining a statistically robust set of results. RICE results for alternate I are presented in the SI (Table S1).
Figure 4. General schematic of the perturbed refractive index calculation RICE uses to determine each mr’. The resulting mr’ is a function of both the specific iteration and mtrue.
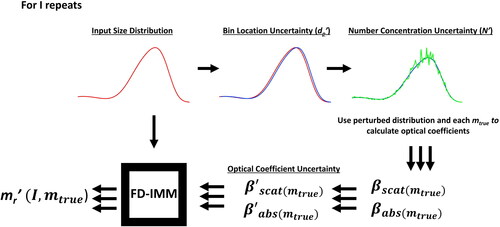
Table 1. Geometric mean, geometric standard deviations, and number concentrations of each sample size distribution.
First, in each perturbation, all dp and N value associated with a size distribution are randomly perturbed (by the same relative value for dp bin and a unique value for each bin for N) using the Igor Pro’s (WaveMetrics, Lake Oswego, OR, USA) Gaussian noise (gnoise) function and the associated uncertainties (σdp and σN, respectively). This creates a possible “true” size distribution for each iteration. Values of dp’ and N’ are then used to calculate optical coefficients for each discrete mtrue value using Mie theory as highlighted in and supporting information S1 (Section 2.1). It should be noted that, to decrease analysis time, only particle size bins which contribute to > =1% of ßabs or ßscat at the center mtrue (mr) or the most extreme tested mtrue (largest and smallest n and k) values are used by RICE.
The calculated optical coefficients are then adjusted using the gnoise function to simulate the observation of the “true” optical properties observed under the expected analytical uncertainties ( and
).
and
are considered as the “observed” optical coefficients for an inverse Mie calcuation as detailed in and SI Figure S1 (Section 2.1). This Mie calculation is performed using the original size distribution parameters (dp and N) and all the mtrue values as possible solutions (mtest). Note that values of m retrieved using the perturbed inputs are described here as mr’ to avoid confusion with the value being investigated, mr. At the end of each iteration, each mtrue value is associated with a resulting mr’.
2.2.3. Semi-empirical probability distribution determination
After I iterations, a matrix (nr’ vs. kr’) is created for each mtrue which describes the number of times mtrue yielded any mr’ with the sum of the number of all elements in the matrix equal to I minus values which fell outside of the reasonability criteria. This matrix is then normalized by I and empirically describes the probability each mr’ was retrieved if mtrue was the actual m (P(mr’|mtrue)) under the given uncertainty conditions. From this normalized matrix the probability of retrieving the target mr if m=mtrue (P(mr|mtrue)) can be extracted. This value is determined for each mtrue and used to create a second matrix which contains P(mr|mtrue) for all mtrue. This second matrix is normalized to I so the sum of the number of elements of the matrix will be one since RICE assumes the sampling space contains all possible m values which could have yielded mr. Since all mtrue values were tested an equal I numbers of times, comparison of the empirical probabilities over different mtrue is appropriate. From this matrix, the probabilities are summed for each ntrue and ktrue, independently, so confidence intervals can be calculated independently. Next, RICE interpolates the probability associated with the untested mtrue values which lie between the tested values as described in Section 2.2.4.
2.2.4. Fitting: Sampling space analysis
Sigmoidal fits, using the Igor Pro’s CurveFit (Sigmoid) function, are used to analyze the appropriateness of the mtrue sampling space and to calculate the final confidence interval. For these analyses, sigmoidal fits of the cumulative probably distributions of ntrue and ktrue are used (, EquationEquation (2.7)(2.7a)
(2.7a) ).
(2.7a)
(2.7a)
(2.7b)
(2.7b)
Where is the cumulative probability that a given ntrue and any values below it retrieved nr; n0.5 is the location of the 50th percentile of the probability; P0 is the lower asymptote of the cumulative probability distribution; Max is the upper asymptote of the cumulative probability distribution. Analogous definitions apply to parameters in EquationEquation (2.7b)
(2.7b)
(2.7b) for k.
While establishing the sampling space, the custom parameters height and idle are used to check the appropriateness of the space.
(2.8)
(2.8)
Height is used to ensure that all probable mtrue values lie within the sampling space. If height is greater than 1.05, RICE expands nwidth or kwidth to nwidth× height or kwidth×height, respectively. The maximum sampling space expansion allowed by for a given sampling space analysis is 125% of the previous sampling space width.
If height is less than 1.05, RICE checks the second quantity, idle. Idle is used to ensure that enough data is included in the RICE result to ensure a good fit by making sure too many probability bins are not empty (i.e., mtrue never yielded mr). Idle is defined as the fraction of ntrue or ktrue that never yielded mr. If idle is greater than 0.65 but less than 0.75, nwidth or kwidth is reduced by 10%; if idle is greater than 0.75, nwidth or kwidth is reduced by 20%.
If RICE adjusts the sampling space, RICE reruns with the new inputs and the lower I condition (Section 2.2, Step 2). If RICE does not adjust the sampling space (i.e., idle and height are acceptable), the final RICE analysis is performed using a larger I (100 for this work) and an increased number of mtrue as described in Section 2.2, step 4.
2.2.5. Fitting: Confidence interval determination
Using the final cycle from the RICE, which has a larger I and larger number of mtrue than the spin up cycles (Section 2.2, step 4 and Section 2.2.4) RICE calculates a final confidence interval for mr using a sigmoidal fit of the cumulative probability distribution (). The sigmoidal fit used to calculate the confidence interval is slightly different than that used to check the sampling space: for the confidence interval calculation, Max is fixed at 1 and P0 at 0, because negative and >1 probabilities are impossible. This assumes all probable mtrue are sampled. If any ntrue or ktrue values are at their minimum physical boundaries (1 or 0, respectively), then RICE fixes P0 to the probability observed at the nearest ntrue or ktrue above the lowest limit.
From this fit, a confidence interval, based on the user-defined confidence level, can be calculated. In the following analysis, the ±2σ space (95% confidence interval) is reported. Furthermore, in all the graphs included in this work, 95% confidence interval refers to the 2σ value.
2.2.6. Flags
Although RICE is designed to isolate a single, reproduceable, estimate of the uncertainty in an FD-IMM m retrieval, due to the probabilistic nature of RICE and the complex nature of particle-radiation interactions, there are scenarios were RICE may be unable to determine a solution. In order to identify these cases, a series of flags are built into RICE.
The first flag (space-n or -k) attempts to identify situations were RICE has identified an inappropriate sampling space which did not include all possible ntrue and/or ktrue. Space- is based on the height of the sigmoidal fit of the final result; when calculating space-, Max and P0 are not fixed as they are in the confidence interval calculation. The space- flag is determined as follows:
Solutions with a space- flag of 2 or 3 should be interpreted cautiously. Ideally, the inputs should be analyzed by RICE again, but if RICE keeps returning a 2 or 3 for space-flag, the conditions may not have a stable solution determinable by RICE.
The second flag, count, attempts to identify solutions where a low number of iterations contributed to the final probability distributions. In the ideal situation (Count = 0), the number of mtrue instances which give mr should be ∼ I if solutions are well distributed among the mr’ values and a few solutions are being excluded by the reasonability criteria described in Section 2.1. Count is set to 1 if the number of values contributing to the probability distribution is less than half of I. In this case, it is possible that RICE has too large or too small nwidth or kwidth, or that the probability distribution does not follow the assumptions that are needed for RICE to provide a robust solution. Solutions with count values of 1 should not be reported.
3. Demonstration and validation
3.1. Test cases
To demonstrate the ability of RICE to constrain uncertainties over a range of analysis conditions, RICE was used to estimate the uncertainty, in triplicate, of idealized m retrievals from 7 size distributions at 12 m values at one wavelength. In these test cases, Mie theory was used to simulate optical properties at an m for a given size distribution. Next, these results were analyzed by RICE under hypothetical uncertainty conditions (described below). Values of tested n were 1.4, 1.6, and 1.8. Values of tested k were 0.001, 0.01, 0.1, 0.5.
Size distributions were chosen to represent a variety of conditions. These distributions are labeled Rainforest High (RFH), Rain Forest Low (RFL), Urban High (UH), Urban Low (UL), Literature Simulation (LS), Chamber Simple (CS), and Chamber Complex (CC). RFH and RFL, respectively, correspond to the dry and wet diurnal averages for aerosols within the Amazon (Rissler et al. Citation2006). UH and UL correspond to size distributions reported near Helsinki, Finland under high pollution and low pollution conditions (Hussein et al. Citation2004). LS corresponds to the simulated size distribution used to test a new broadband RI retrieval method (Bluvshtein et al. Citation2016). CS and CC are based on chamber experiments performed at UC Riverside (Dingle et al. Citation2019). The UL size distribution is most similar to a typical urban size distribution with multiple, well-defined modes.
Geometric mean, geometric standard deviation, and number concentration (N) for each distribution are found in . These values were used to generate lognormal aerosol size distributions for the calculations.
Uncertainty conditions used in this analysis were based on the reported uncertainties of number concentration, size, and optical measurements found within the literature. Values used in this analysis are N ± 10%, dp ± 3%, ßabs ± 5%, ßscat ± 5%. These uncertainty levels are the same as those used by Bluvshtein et al. (Citation2016) to analyze the effect of uncertainty in an IMM.
Tests were performed at 375 nm, a wavelength representing the UV region of the solar spectrum and often used for aerosol optical measurements (Dingle et al. Citation2019; Jiang et al. Citation2019; Veihelmann, Konert, and van der Zande Citation2006; Widmann et al. Citation2005; Sumlin et al. Citation2018; Citation2017; Nakayama et al. Citation2018). The use of a UV wavelength is particularly appropriate as the absorption of BrC, which is a subject of many OA m estimation studies, is significantly enhanced in the UV and near-UV range.
3.2. RICE performance within test cases
To analyze the behavior of RICE and m uncertainties over a range of m values and size distributions, 84 test cases were analyzed in triplicate (Section 3.1). Of these cases, 28 were flagged in at least one of the triplicate runs with the space-n or space-k flag and no runs were flagged with the count flag. Of these flagged cases, 18 were observed when k = 0.5, suggesting that there are distinct analysis regions (in this case, aerosols with high k) where the requirements of RICE are not met. When applying RICE, the output of a flag by RICE indicates that the specific case might not be an ideal application of RICE.
In the triplicate runs, RICE uncertainty intervals displayed good internal reproducibility; the average relative standard deviation of RICE confidence interval width was 9.8 ± 4.1% for n and 8.2 ± 4.5% for k for all non-flagged runs and 15.7 ± 15.0% for n and 12.6 ± 12.1% for k for all runs which produced confidence intervals (i.e., fitting didn’t fail). Note, the aforementioned values are measures of RICE reproducibility, not the confidence interval width, and do not reflect the magnitude of the uncertainties in mr. This suggests that a single RICE analysis should provide a reliable estimation of the magnitude of the uncertainty of mr. Some variability between RICE runs is expected because RICE is a stochastic analysis of uncertainties.
In general, the uncertainty of a RICE result (as measured by the standard deviation of triplicate runs and presence of space- flags) was higher at larger k values or larger n values. This suggests, that in some regions, the assumptions RICE uses about the shape of the probability distribution and near neighbors being the mostly likely solutions for mr may begin to fail. Fortunately, at the tested wavelength, these RI ranges are outside of what has been commonly observed for OA, where RICE is most likely to be applied (Moise, Flores, and Rudich Citation2015; Laskin, Laskin, and Nizkorodov Citation2015). Aerosols with higher k values likely already violate the assumptions of IMMs due to the likelihood that such aerosols contain black carbon, which when fresh, does not conform to Mie theory’s sphericity assumption. Thus, due to the limitations of IMMs, RICE should not be applied to black carbon dominated mixtures. Due to its inability to account for complex morphologies, the FD-IMM applied here can only retrieve the “effective” complex refractive index of mixtures that violate the particle sphericity and composition homogeneity assumptions (Mack et al. Citation2010; Levin et al. Citation2010). For all RICE results, but especially if m is outside of the range typical for OA and common inorganic salts (n=∼1.3–1.7, k=∼0–0.1), attention should be paid for the flags output by RICE to ensure robustness. Additionally, it is best practice to run RICE in triplicate to ensure the interval is repeatedly produced by RICE. For all analyses, attention should be paid to the space- and count flags and caution should be used when reporting data with space- flags while data should not be reported if it has count flags.
3.3. Test case uncertainty results
By applying RICE to a range of size distributions and mr values, the complex behavior of m uncertainty, including condition- and solution-dependent uncertainty, and the ability of RICE to constrain these uncertainties are clearly demonstrated. Here the results from CS and UL size distributions will be discussed in additional detail (). The results from other test cases are included in the SI (Figures S3 and S4).
Figure 5. Chamber Simple (CS) and Urban Low (UL) size distributions used as test cases for RICE (a) and resulting averaged 95% confidence intervals for various n (b) and k (c) values with bars representing one standard deviation of triplicate RICE runs. Larger bars indicate less reproducible results by RICE. Confidence intervals are displayed as half their width, i.e., the value typically reported as ± the mean. For example, the blue circle in the first column of panel b is located at ∼0.09 on the y axis and indicates that for the UL size distribution with an m of 1.4 + 0.1i, the n 95% confidence interval is ∼1.4 ± 0.09.
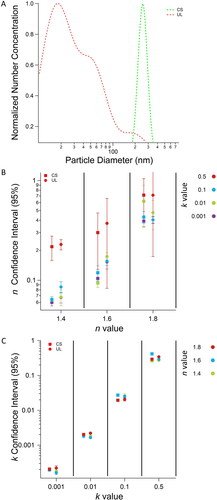
The solution-dependent uncertainty of m retrievals for CS and UL can be observed in the RICE results. Solution dependent uncertainty is influenced only by changes in the target value (m). For example, generally, as nr or kr increased, higher levels of uncertainty were observed for the same size distribution cases (). This demonstrates that the value of the m solution influences the uncertainty. Additionally, the effect of k magnitude on n’s uncertainty is observed when n is low (1.4) and k is high (0.5) (). This effect demonstrates the solution dependence of FD-IMM calculations and validates the need for methods of constraining solution-dependent uncertainties.
The condition-dependent uncertainties within FD-IMM can also be observed within CS and UL RICE results. This uncertainty is observed by RICE when isolating distinct confidence intervals for aerosol populations with the same m but different size distributions. RICE’s ability to account for condition-dependent uncertainty is especially clear for the n = 1.6 test cases (), where the n confidence intervals for UL were, respectively, 0.05, 0.08, 0.04, and 0.07 larger than those for CS at k = 0.001, 0.01, 0.1, and 0.5. This demonstrates that even with the same m and uncertainty conditions, the shape of the size distribution (i.e., condition dependent variability) can dramatically influence the uncertainty of m retrievals. Additional examples of condition dependent uncertainty can be observed for the other tested size distributions, included in SI (Figures S3–S4). It is interesting to note that for the situations tested here, solution-dependent uncertainty effects were generally larger than condition-dependent uncertainty effects.
3.4. Retrieval validation and RICE application to an external dataset
To validate the retrieval algorithm that RICE is based upon, and demonstrate the applicability of RICE to external dataset, RICE was also applied to aerosolized ammonium sulfate and nigrosin measurement data published by Radney and Zangmeister (Citation2018). This dataset contains size distribution and the accompanying optical measurements from mixtures of, and pure, ammonia sulfate and nigrosin aerosol at 660 nm. The data used for comparison were the “set-average “data for full distribution refractive index retrievals from averaged repeated measurements of similar compositions and size distributions. The m retrieval algorithm used by RICE was used to retrieve m from these data and then RICE was applied to these results. The m retrievals were performed using mtest with values of k ranging from 0 to 0.3 at 0.001 intervals and n ranging from 1 to 2 at 0.01 intervals using the merit parameter.
Retrievals very closely matched the values published in Radney and Zangmeister (Citation2018) (). Additionally, the retrievals for pure materials were close to their literature values. The m retrieved for ammonium sulfate was 1.48 + 0.012i and 1.48 + 0.002i, similar to previous published values at 660 nm of n = 1.52 (Toon, Pollack, and Khare Citation1976). The m of nigrosin was retrieved at 1.71 + 0.177i and 1.79 + 0.203i, which are similar to previously reported measurements at 660 nm of 1.70 (± 0.02) + 0.28 (± 0.01)i (Radney and Zangmeister Citation2015), 1.812 (± 0.0068) + 0.2461 (± 0.0031)i (Bluvshtein, Flores, et al. Citation2017). These retrievals indicate that the core m retrieval code of RICE functions similarly to other packages being applied in the aerosol science community.
Table 2. Results of refractive index retrieval and RICE uncertainty analysis of data reported by Radney and Zangmeister (Citation2018).
After retrieval of m, the retrieved m uncertainty was analyzed by RICE. Measurement uncertainties were based on those published in Radney and Zangmeister (Citation2018). The 1σ uncertainties used, respectively for ßext and ßabs, as 2.5 Mm−1 and 5.7 Mm−1 as calculated from reported values (either as 1/3 the LOD or the reported 1σ), respectively. Since ßscat was not reported directly, it was calculated by difference of extinction and absorption coefficients. Instrumental uncertainties were propagated by taking the square root of the sum of squared errors to obtain σscat. Relative uncertainty was input individually for each data point; σabs ranged from 81% to 3% and σscat ranged from 11% to 1.3%. Uncertainty in diameter and number concentration measurements were 2.7% and 10%, respectively. These uncertainty values, and mr values were input into RICE
The confidence intervals determined by RICE and RICE flagged runs are displayed in . RICE 95% confidence intervals were generally larger than the 1σ uncertainties reported by Radney and Zangmeister (Citation2018), which is reasonable given the different uncertainty ranges and the additional sources of uncertainty incorporated into RICE. Among all RICE intervals, there was only a single space-k flag, for a pure ammonium sulfate retrieval (). This flag likely occurred due to the combined occurrence of high σabs and a very low k value, making fitting difficult. Overall, this validation case demonstrates the ability of RICE to produce confidence intervals from third party data with relative simplicity.
3.2. Comparison to Min-Max method
Due to the computational expense of RICE (∼10 min per retrieval on a desktop), it would be useful to be able to apply a quicker tool to estimate the uncertainty in an FD-IMM calculation. The min-max method is one strategy that has been previously applied to gauge uncertainty in m retrievals (Dingle et al. Citation2019; Jiang et al. Citation2019). To evaluate the usefulness of this method, the uncertainty intervals for the test cases were also calculated using the min-max method. The min-max calculates an uncertainty interval by reperforming m retrievals using extreme input parameters. For example, to achieve the “max” k, the quantities (ßabs_obs +σabs× ßabs_obs), (ßscat_obs - σscat× ßscat_obs), and (dp – σdp×dp) would respectively be substituted for ßabs_obs, ßscat_obs, and dp.
The min-max based uncertainty results of CS and UL test cases are compared to the corresponding RICE confidence intervals in . In general, the min-max method captures the scale of k uncertainty over the multiple orders of magnitude tested. Unfortunately, the min-max method has more difficulty constraining n which generally varies within a smaller space for aerosols (∼1.4–1.8). Relative differences between min-max and RICE intervals were up to 72% for n and 16% for k, with the largest discrepancies observed at high n or k values.
Figure 6. Comparison of RICE determined confidence intervals to intervals determined via the min-max method for (a) n and (b) k. Min max intervals are displayed as half their width and RICE confidence intervals are displayed as half their width, i.e., the value typically reported as ± the mean.
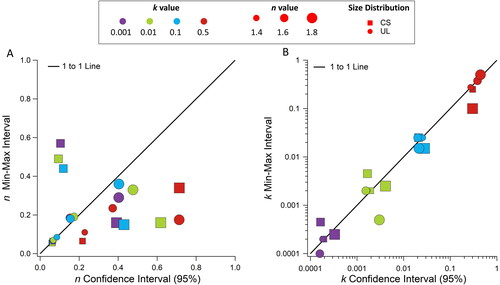
These comparisons suggest that the Min-Max method generally underestimates m uncertainties and is not able to accurately constrain the uncertainties, especially in n.
3.3. Applications and implications
In this work, we have demonstrated RICE, a tool to propagate analytical, condition-, and solution-dependent uncertainties through FD-IMMs. RICE can reproducibly estimate confidence intervals for n and k while accounting for these complex uncertainties. The application of RICE to m retrievals will provide a clearer, and more accurate estimation of uncertainties. Additionally, RICE could be specifically applied in serving the following goals:
RICE can be used to determine uncertainties in field calculated effective m values, where measurement conditions are dynamic. RICE’s ability to account for datapoint-by-datapoint uncertainty means that changing m values and size distributions can be accounted for.
RICE can also be used to probe condition-dependent uncertainties to determine the most confident m measurement conditions. In practice, this could mean using RICE to investigate size distribution’s shape influences on uncertainties, potentially leading to best practices for uncertainty management in FD-IMM.
Additional uncertainty treatments could also be applied within RICE. For example, non-uniform uncertainty treatments could be explored by making simple modifications to the RICE code. These additional refinements could include size-dependent size distribution uncertainty or magnitude-dependent optical coefficient uncertainty.
RICE could be applied to reanalyze m retrievals previously reported to constrain uncertainties on historic measurements (provided availability of analytical uncertainty estimates and primary data).
RICE provides a tool for the improved understanding of the limitations of aerosol m retrievals and a more accurate understanding of the uncertainties associated with the global climate forcing of aerosols. It is also of note that the obtained m uncertainty intervals were quite large for both simulated test cases and external data validation cases. These results indicate a strong need to apply a robust uncertainty analysis technique such as RICE when using IMMs to assess reliability of the retrieved m and quantify the true uncertainties associated with these values. Additionally, these results suggest FD-IMM applications would benefit from reduction in uncertainties of instrumental measurements used as inputs into IMMs.
Supplemental Material
Download MS Word (626.9 KB)Acknowledgments
The authors would like to thank and acknowledge Charles A. Brock, NOAA-ESRL Chemical Sciences Laboratory, Boulder, CO who developed the original Mie Code around which RICE is built.
Disclosure statement
The authors declare no conflicts of interest.
Additional information
Funding
References
- Balzarini, A., G. Pirovano, L. Honzak, R. Žabkar, G. Curci, R. Forkel, M. Hirtl, R. San José, P. Tuccella, and G. A. Grell. 2015. WRF-chem model sensitivity to chemical mechanisms choice in reconstructing aerosol optical properties. Atmos. Environ. 115:604–19. doi:https://doi.org/10.1016/j.atmosenv.2014.12.033.
- Barkey, B., S. E. Paulson, and A. Chung. 2007. Genetic algorithm inversion of dual polarization polar nephelometer data to determine aerosol refractive index. Aerosol Sci. Technol. 41 (8):751–60. doi:https://doi.org/10.1080/02786820701432640.
- Bluvshtein, N., J. M. Flores, Q. He, E. Segre, L. Segev, N. Hong, A. Donohue, J. N. Hilfiker, and Y. Rudich. 2017. Calibration of a multi-pass photoacoustic spectrometer cell using light-absorbing aerosols. Atmos. Meas. Tech. 10 (3):1203–13. doi:https://doi.org/10.5194/amt-10-1203-2017.
- Bluvshtein, N., J. M. Flores, L. Segev, and Y. Rudich. 2016. A new approach for retrieving the UV–vis optical properties of ambient aerosols. Atmos. Meas. Tech. 9 (8):3477–90. doi:https://doi.org/10.5194/amt-9-3477-2016.
- Bluvshtein, N., P. Lin, J. M. Flores, L. Segev, Y. Mazar, E. Tas, G. Snider, C. Weagle, S. S. Brown, A. Laskin, et al. 2017. Broadband optical properties of biomass-burning aerosol and identification of brown carbon chromophores. J. Geophys. Res. Atmos. 122 (10):5441–56. doi:https://doi.org/10.1002/2016JD026230.
- Bohren, C. F., and D. R. Huffman. 1983. Absorption and scattering of light by small particles. Weinheim, Germany: Wiley-VCH. http://www.wiley.com/WileyCDA/WileyTitle/productCd-0471293407.html.
- Bond, T. C., S. J. Doherty, D. W. Fahey, P. M. Forster, T. Berntsen, B. J. DeAngelo, M. G. Flanner, S. Ghan, B. Kärcher, D. Koch, et al. 2013. Bounding the role of black carbon in the climate system: a scientific assessment. J. Geophys. Res. Atmos. 118 (11):5380–552. doi:https://doi.org/10.1002/jgrd.50171.
- Chylek, P., and J. Wong. 1995. Effect of absorbing aerosols on global radiation budget. Geophys. Res. Lett. 22 (8):929–31. doi:https://doi.org/10.1029/95GL00800.
- Cotterell, M. I., K. Szpek, J. M. Haywood, and J. M. Langridge. 2020. Sensitivity and accuracy of refractive index retrievals from measured extinction and absorption cross sections for mobility-selected internally mixed light absorbing aerosols. Aerosol Sci. Technol. 54 (9):1034–26. doi:https://doi.org/10.1080/02786826.2020.1757034.
- De Haan, D. O., L. N. Hawkins, H. G. Welsh, R. Pednekar, J. R. Casar, E. A. Pennington, A. de Loera, N. G. Jimenez, M. A. Symons, M. Zauscher, et al. 2017. Brown carbon production in ammonium- or amine-containing aerosol particles by reactive uptake of methylglyoxal and photolytic cloud cycling. Environ. Sci. Technol. 51 (13):7458–66. doi:https://doi.org/10.1021/acs.est.7b00159.
- Denjean, C., P. Formenti, B. Picquet-Varrault, M. Camredon, E. Pangui, P. Zapf, Y. Katrib, C. Giorio, A. Tapparo, B. Temime-Roussel, et al. 2015. Aging of secondary organic aerosol generated from the ozonolysis of alpha-pinene: effects of ozone, light and temperature. Atmos. Chem. Phys. 15 (2):883–97. doi:https://doi.org/10.5194/acp-15-883-2015.
- Denjean, C., P. Formenti, B. Picquet-Varrault, Y. Katrib, E. Pangui, P. Zapf, and J. F. Doussin. 2014. A new experimental approach to study the hygroscopic and optical properties of aerosols: Application to ammonium sulfate particles. Atmos. Meas. Tech. 7 (1):183–97. doi:https://doi.org/10.5194/amt-7-183-2014.
- Denjean, C., P. Formenti, B. Picquet-Varrault, E. Pangui, P. Zapf, Y. Katrib, C. Giorio, A. Tapparo, A. Monod, B. Temime-Roussel, et al. 2015. Relating hygroscopicity and optical properties to chemical composition and structure of secondary organic aerosol particles generated from the ozonolysis of α-pinene. Atmos. Chem. Phys. 15 (6):3339–58. doi:https://doi.org/10.5194/acp-15-3339-2015.
- Dingle, J. H., S. Zimmerman, A. L. Frie, J. Min, H. Jung, and R. Bahreini. 2019. Complex refractive index, single scattering albedo, and mass absorption coefficient of secondary organic aerosols generated from oxidation of biogenic and anthropogenic precursors. Aerosol Sci. Technol. 53 (4):449–63. doi:https://doi.org/10.1080/02786826.2019.1571680.
- Hecht, E. 2002. Optics. Reading, Massachusetts, USA: Addison-Wesley.
- Hovenier, J. W., H. Volten, O. Muñoz, W. J. van der Zande, and L. B. F. M. Waters. 2003. Laboratory studies of scattering matrices for randomly oriented particles: Potentials, problems, and perspectives. Journal of Quantitative Spectroscopy and Radiative Transfer, Electromagnetic and Light Scattering by Non-Spherical Particles 79-80:741–55. doi:https://doi.org/10.1016/S0022-4073(02)00319-9.
- Hussein, T., A. Puustinen, P. P. Aalto, J. M. Mäkelä, K. Hämeri, and M. Kulmala. 2004. Urban aerosol number size distributions. Atmos. Chem. Phys. 4 (2):391–411. doi:https://doi.org/10.5194/acp-4-391-2004.
- Intergovernmental Panel on Climate Change 2014. Fifth Assessment Report - Synthesis Report. https://www.ipcc.ch/report/ar5/syr/.
- Jiang, H., A. L. Frie, A. Lavi, J. Y. Chen, H. Zhang, R. Bahreini, and Y.-H. Lin. 2019. Brown carbon formation from nighttime chemistry of unsaturated heterocyclic volatile organic compounds. Environ. Sci. Technol. Lett. 6 (3):184–90. doi:https://doi.org/10.1021/acs.estlett.9b00017.
- Jurányi, Z., and R. Weller. 2019. One year of aerosol refractive index measurement from a coastal antarctic site. Atmos. Chem. Phys. 19 (22):14417–30. doi:https://doi.org/10.5194/acp-19-14417-2019.
- Lambe, A. T., C. D. Cappa, P. Massoli, T. B. Onasch, S. D. Forestieri, A. T. Martin, M. J. Cummings, D. R. Croasdale, W. H. Brune, D. R. Worsnop, et al. 2013. Relationship between oxidation level and optical properties of secondary organic aerosol. Environ. Sci. Technol. 47 (12):6349–57. doi:https://doi.org/10.1021/es401043j.
- Laskin, A., J. Laskin, and S. A. Nizkorodov. 2015. Chemistry of atmospheric brown carbon. Chem. Rev. 115 (10):4335–82. doi:https://doi.org/10.1021/cr5006167.
- Lee, S. Y., H. Chang, T. Ogi, F. Iskandar, and K. Okuyama. 2011. Measuring the effective density, porosity, and refractive index of carbonaceous particles by tandem aerosol techniques. Carbon 49 (7):2163–72. doi:https://doi.org/10.1016/j.carbon.2011.02.002.
- Levin, E. J. T., G. R. McMeeking, C. M. Carrico, L. E. Mack, S. M. Kreidenweis, C. E. Wold, H. Moosmüller, W. P. Arnott, W. M. Hao, J. L. Collett, et al. 2010. Biomass burning smoke aerosol properties measured during fire laboratory at Missoula experiments (FLAME). J. Geophys. Res. 115 (D18):D18210. doi:https://doi.org/10.1029/2009JD013601.
- Mack, L. A., E. J. T. Levin, S. M. Kreidenweis, D. Obrist, H. Moosmüller, K. A. Lewis, W. P. Arnott, G. R. McMeeking, A. P. Sullivan, C. E. Wold, et al. 2010. Optical closure experiments for biomass smoke aerosols. Atmos. Chem. Phys. 10 (18):9017–26. doi:https://doi.org/10.5194/acp-10-9017-2010.
- Mason, B. J., S.-J. King, R. E. H. Miles, K. M. Manfred, A. M. J. Rickards, J. Kim, J. P. Reid, and A. J. Orr-Ewing. 2012. Comparison of the accuracy of aerosol refractive index measurements from single particle and ensemble techniques. J. Phys. Chem. A. 116 (33):8547–56. doi:https://doi.org/10.1021/jp3049668.
- Mie, G. 1908. Beiträge Zur Optik Trüber Medien, Speziell Kolloidaler Metallösungen. Ann. Phys. 330 (3):377–445. doi:https://doi.org/10.1002/andp.19083300302.
- Miles, R. E. H., S. Rudić, A. J. Orr-Ewing, and J. P. Reid. 2011. Sources of error and uncertainty in the use of cavity ring down spectroscopy to measure aerosol optical properties. Aerosol Sci. Technol. 45 (11):1360–75. doi:https://doi.org/10.1080/02786826.2011.596170.
- Moise, T., J. M. Flores, and Y. Rudich. 2015. Optical properties of secondary organic aerosols and their changes by chemical processes. Chem. Rev. 115 (10):4400–39. doi:https://doi.org/10.1021/cr5005259.
- Murphy, D. M., D. J. Cziczo, K. D. Froyd, P. K. Hudson, B. M. Matthew, A. M. Middlebrook, R. E. Peltier, A. Sullivan, D. S. Thomson, and R. J. Weber. 2006. Single-particle mass spectrometry of tropospheric aerosol particles. J. Geophys. Res. 111 (D23):D23S32. doi:https://doi.org/10.1029/2006JD007340.
- Myhre, G., B. H. Samset, M. Schulz, Y. Balkanski, S. Bauer, T. K. Berntsen, H. Bian, N. Bellouin, M. Chin, T. Diehl, et al. 2013. Radiative forcing of the direct aerosol effect from aerocom phase II simulations. Atmos. Chem. Phys. 13 (4):1853–77. doi:https://doi.org/10.5194/acp-13-1853-2013.
- Nakayama, T., Y. Matsumi, K. Sato, T. Imamura, A. Yamazaki, and A. Uchiyama. 2010. Laboratory studies on optical properties of secondary organic aerosols generated during the photooxidation of toluene and the ozonolysis of α-pinene. J. Geophys. Res. 115 (D24):D24204. doi:https://doi.org/10.1029/2010JD014387.
- Nakayama, T., K. Sato, T. Imamura, and Y. Matsumi. 2018. Effect of oxidation process on complex refractive index of secondary organic aerosol generated from isoprene. Environ. Sci. Technol. 52 (5):2566–74. doi:https://doi.org/10.1021/acs.est.7b05852.
- Nakayama, T., K. Sato, M. Tsuge, T. Imamura, and Y. Matsumi. 2015. Complex refractive index of secondary organic aerosol generated from isoprene/NOx photooxidation in the presence and absence of SO2. J. Geophys. Res. Atmos. 120 (15):7777–87. doi:https://doi.org/10.1002/2015JD023522.
- Perrone, M. R., A. M. Tafuro, and S. Kinne. 2012. Dust layer effects on the atmospheric radiative budget and heating rate profiles. Atmos. Environ. 59:344–54. (November): . doi:https://doi.org/10.1016/j.atmosenv.2012.06.012.
- Pilinis, C., S. N. Pandis, and J. H. Seinfeld. 1995. Sensitivity of direct climate forcing by atmospheric aerosols to aerosol size and composition. J. Geophys. Res. 100 (D9):18739–54. doi:https://doi.org/10.1029/95JD02119.
- Radney, J. G., and C. D. Zangmeister. 2015. Measurement of gas and aerosol phase absorption spectra across the visible and near-IR using supercontinuum photoacoustic spectroscopy. Anal. Chem. 87 (14):7356–63. doi:https://doi.org/10.1021/acs.analchem.5b01541.
- Radney, J. G., and C. D. Zangmeister. 2018. Comparing aerosol refractive indices retrieved from full distribution and size- and mass-selected measurements. J. Quant. Spectrosc. Radiat. Transf. 220:52–66. doi:https://doi.org/10.1016/j.jqsrt.2018.08.021.
- Radney, J., and C. Zangmeister. 2018. Data for: Comparing Aerosol Refractive Indices Retrieved from Full Distribution and Size- and Mass-Selected Measurements. doi:https://doi.org/10.17632/y3jyb5hv7v.1.
- Ramanathan, V., and G. Carmichael. 2008. Global and regional climate changes due to black carbon. Nat. Geosci. 1 (4):221–7. doi:https://doi.org/10.1038/ngeo156.
- Rissler, J., A. Vestin, E. Swietlicki, G. Fisch, J. Zhou, P. Artaxo, and M. O. Andreae. 2006. Size distribution and hygroscopic properties of aerosol particles from dry-season biomass burning in Amazonia. Atmos. Chem. Phys. 6 (2):471–91. doi:https://doi.org/10.5194/acp-6-471-2006.
- Sumlin, B. J., W. R. Heinson, and R. K. Chakrabarty. 2018. Retrieving the aerosol complex refractive index using PyMieScatt: A mie computational package with visualization capabilities. J. Quant. Spectrosc. Radiat. Transf. 205:127–34. doi:https://doi.org/10.1016/j.jqsrt.2017.10.012.
- Sumlin, B. J., Y. W. Heinson, N. Shetty, A. Pandey, R. S. Pattison, S. Baker, W. M. Hao, and R. K. Chakrabarty. 2018. UV–vis–IR spectral complex refractive indices and optical properties of brown carbon aerosol from biomass burning. J. Quant. Spectrosc. Radiat. Transf. 206:392–8. doi:https://doi.org/10.1016/j.jqsrt.2017.12.009.
- Sumlin, B. J., A. Pandey, M. J. Walker, R. S. Pattison, B. J. Williams, and R. K. Chakrabarty. 2017. Atmospheric photooxidation diminishes light absorption by primary brown carbon aerosol from biomass burning. Environ. Sci. Technol. Lett. 4 (12):540–5. doi:https://doi.org/10.1021/acs.estlett.7b00393.
- Toon, O. B., J. B. Pollack, and B. N. Khare. 1976. The optical constants of several atmospheric aerosol species: Ammonium sulfate, aluminum oxide, and sodium chloride. J. Geophys. Res. 81 (33):5733–48. doi:https://doi.org/10.1029/JC081i033p05733.
- Veihelmann, B., M. Konert, and W. J. van der Zande. 2006. Size distribution of mineral aerosol: Using light-scattering models in laser particle sizing. Appl. Opt. 45 (23):6022–9. doi:https://doi.org/10.1364/ao.45.006022.
- Wang, X., C. L. Heald, D. A. Ridley, J. P. Schwarz, J. R. Spackman, A. E. Perring, H. Coe, D. Liu, and A. D. Clarke. 2014. Exploiting simultaneous observational constraints on mass and absorption to estimate the global direct radiative forcing of black carbon and brown carbon. Atmos. Chem. Phys. 14 (20):10989–10. doi:https://doi.org/10.5194/acp-14-10989-2014.
- Widmann, J. F., J. Duchez, J. C. Yang, J. M. Conny, and G. W. Mulholland. 2005. Measurement of the optical extinction coefficient of combustion-generated aerosol. J. Aerosol Sci. 36 (2):283–9. doi:https://doi.org/10.1016/j.jaerosci.2004.09.005.
- Zarzana, K. J., C. D. Cappa, and M. A. Tolbert. 2014. Sensitivity of aerosol refractive index retrievals using optical spectroscopy. Aerosol Sci. Technol. 48 (11):1133–44. doi:https://doi.org/10.1080/02786826.2014.963498.
- Zhang, Q., J. L. Jimenez, M. R. Canagaratna, J. D. Allan, H. Coe, I. Ulbrich, M. R. Alfarra, A. Takami, A. M. Middlebrook, Y. L. Sun, et al. 2007. Ubiquity and dominance of oxygenated species in organic aerosols in anthropogenically-influenced northern hemisphere midlatitudes. Geophys. Res. Lett. 34 (13): L13801. doi:https://doi.org/10.1029/2007GL029979.
- Zhang, Y., H. Forrister, J. Liu, J. Dibb, B. Anderson, J. P. Schwarz, A. E. Perring, J. L. Jimenez, P. Campuzano-Jost, Y. Wang, et al. 2017. Top-of-atmosphere radiative forcing affected by brown carbon in the upper troposphere. Nat. Geosci. 10 (7):486–9. doi:https://doi.org/10.1038/ngeo2960.
- Zhao, D., Y. Yin, M. Zhang, H. Wang, C. Lu, L. Yuan, and S. Shi. 2020. The optical properties of aerosols at the summit of mount Tai in May and June and the retrieval of the complex refractive index. Atmosphere 11 (6):655. doi:https://doi.org/10.3390/atmos11060655.