
Abstract
The composition of wildfire smoke particulate matter (PM) was investigated during a 2018 smoke episode in the San Francisco Bay Area and compared to non-wildfire periods. Scanning electron microscopy (SEM) of passive PM samples deployed at four sites exhibited a higher concentration of submicron, spherical, carbonaceous PM (“tar balls”) during the wildfire period compared to the non-wildfire period. Coarse ash aluminosilicates and potassium bearing particles were enhanced as well. Disproportionately more UV light was absorbed by PM during the wildfire period than during the non-wildfire period, indicating a higher organic content consistent with the observed tar balls. An indoor PM sample from a residence operating a medium-efficiency furnace filter during the smoke episode exhibited fine, carbonaceous PM comparable to outdoors, but reduced coarse ash PM. Indoor/outdoor ratios for PM2.5, PM10-2.5, and PM10 were 0.6, 0.1, and 0.5 respectively. SEM of the wildfire furnace filter revealed a greater proportion of tar balls compared to a non-wildfire filter. Relatively rare particles enriched in Cu, Zn, Sn and Pb were observed in wildfire samples, but not in non-wildfire samples. Higher concentrations of Cu, Zn, and Pb during the wildfire were confirmed by inductively coupled plasma mass spectrometry (ICP-MS) of the furnace filter. The use of low-cost passive samplers enabled rapid deployment at multiple locations and indoors and outdoors during the wildfire episode. These measurements suggest smoke impacts were regional in scale and similar across sites, though local variations in PM2.5 magnitudes, particle types, and confounding by local sources were observed.
Copyright © 2021 American Association for Aerosol Research
EDITOR:
Introduction
Wildfire smoke is a mixture of particle- and gas-phase chemicals produced by incomplete combustion of various fuels (Urbanski et al. Citation2009). When wildfire perimeters include residential or commercial property in addition to biomass, the burning fuels can include building materials, consumer products, vehicles, commercial facilities, plastics, and waste products (Fabian et al. Citation2010). When smoke from these fires is transported aloft from a burning area down to the breathing zones of populated areas, it has the potential to result in substantial exposures (Jaffe et al. Citation2020).
Current guidelines for wildfire smoke exposure are based on previously established guidelines for non-wildfire airborne particulate matter with aerodynamic diameters smaller than 2.5 µm (PM2.5) and 10 µm (PM10). Numerous studies have shown that inhalation of non-wildfire PM2.5 and coarse PM (PM10-2.5) are associated with increased inflammation, mortality, hospitalization, and asthma emergency room visits (Adar et al. Citation2014; Lee, Wong, and Lau Citation2006; Peters et al. Citation2001; Pope and Dockery Citation2006).
Comparable epidemiology, toxicology, and particle characterization studies are needed for wildfire-specific PM to determine whether it produces similar or different health effects than non-wildfire PM. Wildfire smoke exposures have been associated with increased hospital admissions and symptoms for respiratory, cardiovascular, and cerebrovascular events in the general population (Jones et al. Citation2020; Wettstein et al. Citation2018; Yao et al. Citation2020; Kiser et al. Citation2020) and wildland firefighters, though there is a need for more research on intermittent exposures over multiple years (Austin Citation2008; Domitrovitch et al. Citation2017).
Characterizations of wildfire PM size, metals, and carbonaceous composition in real-world smoke plumes can help elucidate their potential health effects. The aerodynamic sizes of wildfire PM can be used to assess their inhalation efficiency and respiratory deposition (Hinds Citation1982). Wildfire PM may have unique metal exposures, especially if structures or metal equipment burned in the fire (Wolf et al. Citation2010). Although differing study designs and PM mixtures have led to mixed conclusions regarding PM species-specific toxicity (HEI Citation2013), several authors have reported stronger health effect associations with carbonaceous PM than with PM mass in general (Croft et al. Citation2020; Grahame Citation2009; Schwartz et al. Citation2005; Steiner et al. Citation2016). The organic carbon fraction in smoldering, incomplete combustion particles has been reported to contain several known toxics and carcinogenic PAHs (CARB Citation2003; Robinson et al. Citation2011; Wang et al. Citation2017; Nelson et al. Citation2021).
One method of detecting relative amounts of organic carbon involves comparing two optical indicators of carbonaceous PM—black carbon (BC), a measure of elemental carbon that absorbs a broad spectrum of wavelengths, and UVPM, a measure of PM that, due to increased organic content, absorbs disproportionately in the UV range relative to BC (Andreae and Gelencsér Citation2006; Kirchstetter, Novakov, and Hobbs Citation2004; Olson et al. Citation2015). UVPM, also referred to as brown carbon, is correlated with toxic species such as PAHs and has been observed to be elevated in biomass burning smoke (Black et al. Citation2016; Huang et al. Citation2018; Samburova et al. Citation2016).
Measuring differences in wildfire-specific PM between outdoors and indoors, or across a geographic region, may help individuals follow guidance to avoid smoke during wildfire events (CDPH Citation2019; EPA Citation2019).
In November 2018, the San Francisco Bay Area (SFBA) experienced a period of heavy smoke impact due to wildfire smoke from the Camp Fire, approximately 250 km to the Northeast. During the wildfire period, a stagnant weather system trapped smoke that had been transported to the SFBA, causing visibility degradation and increased ground-level PM concentrations from approximately 8–21 November (Delp and Singer Citation2020; NASA Citation2018; Rooney et al. Citation2020).
In this work, PM compositions at several locations across the SFBA were studied during this period of smoke impact using three different approaches. First, scanning electron microscopy plus energy-dispersive X-ray spectroscopy (SEM-EDS) was used to compare PM collected with passive samplers during and before the smoke episode in terms of particle size, elemental chemistry, and morphology. Second, indoor PM was compared to outdoor PM in a residence during the wildfire smoke episode, and furnace filters from that residence were analyzed using SEM-EDS and with inductively coupled plasma mass spectrometry (ICP-MS) to quantify metal concentrations. Third, BC and UVPM data were compared as indicators of changing organic content of PM in wildfire smoke.
Methods
Sampling description
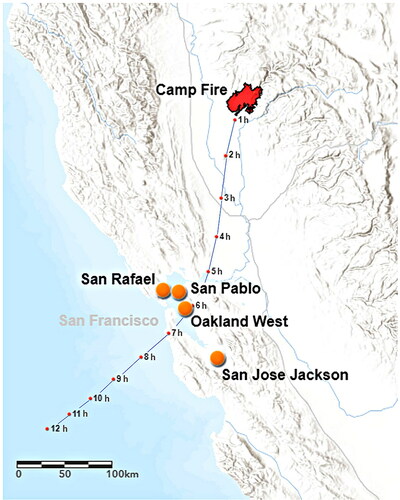
Outdoor passive PM samples were collected at three Bay Area Air Quality Management District (BAAQMD) monitoring stations (Oakland West, San Jose Jackson, and San Pablo Rumrill) for consecutive 28 day monitoring periods in 2018 (Castillo et al. Citation2019). Beta attenuation monitor (BAM) PM2.5 data from the BAAQMD sites were obtained either directly from BAAQMD or from an online database (AirNow-Tech, Citation2020). We analyzed samples from a “wildfire period” from 23 October–20 November, 2018, about half of which was impacted by the smoke episode, and compared them with a “non-wildfire period” from 15 March to 10 April, 2018. Additional passive PM samplers were deployed inside and outside at a fourth regional site (San Rafael) at a private residence during the wildfire period from 10–21 November. These four urban sites cover a large distance within the SFBA, approximately 150 km from north to south (). Each possesses local weather patterns influenced by their positions around the SFBA, as well as unique non-wildfire sources (Nguyen et al. Citation2019). San Pablo is impacted by refineries and local industries, Oakland West is impacted by industry and truck and ship traffic from the Port of Oakland, and San Rafael and San Pablo are influenced mostly by traffic and regional transport.
Figure 1. Locations of passive PM samplers and November 2018 Camp Fire. Map was generated using ArcGIS Online (ESRI, Redlands, USA) and wildfire perimeter data (CAL FIRE Citation2019). Also shown is a typical HYSPLIT, 12 h wind trajectory during the smoke episode, generated for 8 November, 2018 (NOAA, 2020).
The low-cost, passive aerosol samplers used in this study (UNC-PAS, RJ Lee Group, Monroeville, USA) collect particles onto coated, 0.1 µm polycarbonate filter substrates optimized for computer-controlled electron microscopy analysis (Wagner and Macher Citation2003). When exposed, the sampler collects particles by gravitational settling, diffusion and inertia, and mass concentrations are calculated using a particle deposition velocity model that accounts for collection as a function of particle size (Wagner and Leith Citation2001). Though not suitable for regulatory purposes, UNC-PAS mass size fractions and particle size distributions have shown good precision and correlation with active PM samplers (e.g., Wagner et al. Citation2012; Arashiro and Leith Citation2013; Peters et al. Citation2016; Castillo et al. Citation2019) and have utility for community PM source assessments.
For outdoor sampling, each UNC-PAS was deployed inside a weather shelter (Ott and Peters Citation2008). An unexposed sampler from the same lot as the field samples was analyzed as a laboratory blank. The 28-day PM2.5 and PM10-2.5 concentration equivalents for the blank were determined to be 0.3 and 0.06 µg/m3. Except for in San Rafael site, all passive samplers were shipped inside their weather shelters in anti-static bags. To deploy them, each weather shelter was removed from its bag, mounted onto an L-bracket, and the time and date were recorded. This process was reversed to stop sampling.
The passive samplers deployed inside and outside the San Rafael site were deployed in a similar manner to the other sites, except samplers were transported in single sampler vials to and from the site. The outdoor San Rafael samples were deployed in a weather shelter in the back yard, while the indoor samples were mounted in the bottom half of the single sampler vial on top of a bedroom bookcase. Both were deployed at an approximately 2 m breathing zone height.
Furnace filters were collected from the San Rafael residential site in order to determine whether analyzing home filters after an incident is useful for estimating exposures. One was in use from 20 October, 2018 to 2 December, 2018, encompassing the period of smoke impact from the fire. The other, used from 2 December, 2018 to 7 May, 2019, was collected during a time period not impacted by smoke from wildfires and is considered a background filter. A filter of the same type that was never used in a furnace was also collected as a blank. The filter type for all was Filtrete brand Micro Allergen Defense 1000, 12″ x 24″ x 1″ with a MERV rating of 11. The furnace was a central air type, with a furnace filter at the air inlet mounted on the wall, near the floor level in a central hallway. The furnace was run in normal heating mode for approximately 1 h each weekday morning, 8 h each weekend day, and 5 h each night. The windows of the San Rafael residence were kept closed for the entire wildfire period, but the windows and doors were consistent with a typical US home of its construction era (1918) and were not well sealed.
Since the passive samplers and furnace filters were sampling for multiple weeks, they were exposed to a range of smoke plume ages, from relatively fresh outflow a few hours downwind from the fire, to smoke trapped for days in the stagnant weather pattern.
Electron microscopy analyses
Detailed SEM-EDS analysis parameters and equations are given in the online supplementary information (SI). Briefly, a set of two computer-controlled SEM analyses (CCSEM) was run for each passive sample. First, a particle size-only analysis was run at a lower (5 kV) accelerating voltage to decrease sample beam penetration and improve imaging of sub-micrometer, carbonaceous particles. Second, a sizing plus EDS chemistry analysis (CCSEM-EDS) was run at a higher voltage (20 kV) to increase the maximum detectable X-ray energy for detection of heavy metals. Custom code incorporating a validated, size-dependent deposition model was used to calculate deposition rates and convert the CCSEM particle count, size, and elemental chemistry data into PM2.5, PM10-2.5, PM10, mass size distributions, and elemental concentration size distributions. The number of analyzed particles ranged from 1000 to 10,000 particles per passive sample, except the blank analysis, which stopped after 500 fields. In addition to the CCSEM analyses, manual SEM-EDS analyses were performed on the passive samples, as well as on subsections of the blank, background, and wildfire period furnace filters.
ICP-MS analysis
Three filter subsamples approximately 3 cm2 in area were cut from each of the three San Rafael furnace filters (blank, background, and one used during the wildfires). Each filter subsample was digested in concentrated nitric acid (Optima, Fisher Scientific) using a MARS 6 Microwave Digestion System and then diluted to a 2% nitric acid solution. Each sample was analyzed twice by an Agilent 7700 ICP-MS using Helium mode (4.5 mL/min) for chromium (Cr), manganese (Mn), cobalt, nickel (Ni), copper (Cu), zinc (Zn), arsenic, cadmium, and lead (Pb). Repeatability of measurements above the detection limit was within 14%. Gravimetric sample masses could not be determined for these types of furnace filters, but assuming 50% of the smoke PM was trapped by the MERV11 filter (Fazli, Zeng, and Stephens Citation2019), an average furnace air flow of 1700 m3/h (Jump, Walker, and Modera Citation1996), an 11% average runtime (= 33% programmed operation and 33% duty cycle when on), a filter area of 5000 cm2, and 20 µg/m3 average indoor PM10 during the smoke episode (obtained from the indoor passive sampler; see Results), the estimated PM mass was 380 µg per cm2 of filter.
Measured metal concentrations were normalized by filter cut area before averaging across each filter. The blank filter average was used to correct the background and wildfire furnace filters. To determine relative metal loading rates, the filter concentrations were divided by number of days the filter was in use (44 days for the wildfire filter and 156 days for the background filter). ICP-MS analysis was only performed on furnace filters, as the total mass collected by the passive samplers was too small for detection by ICP-MS.
UVPM and BC data analysis
UVPM and BC data was analyzed from an aethalometer operated by BAAQMD at the Oakland West monitoring site (). The aethalometer (Magee Scientific/Teledyne 633, Berkeley, CA, USA) measures absorption of particles collected on a filter tape at 880 and 370 nm. BC is determined using the absorption at 880 nm converted to a concentration using the BC absorption cross section. UVPM is defined as UV absorption measured at 370 nm, converted to a concentration via the BC absorption cross section, minus the measurement of BC. Although it is reported in units of concentration, UVPM is not a measure of a real physical quantity, but rather a measure indicating the excess absorption in the UV range compared to that of BC (Hansen Citation2005; Wang et al. Citation2011). Organic species with a limited number of carbon rings will absorb disproportionately more in the UV range than the elemental carbon typical in BC which has extensive conjugated carbon rings (Andreae and Gelencsér Citation2006). Thus, UVPM is a measure of organic content in PM relative to BC.
Hourly UVPM and BC data were available for the year of 2018 through 18 December. UVPM, BC, and the ratio of UVPM/BC were investigated during the 2018 fires and compared to the rest of the year. For this dataset, the period of wildfire influence is defined as from 8 November at 11 AM local time to 21 November at 9 AM local time. This reflects the period of elevated PM from when smoke first arrived at the Oakland West site to when it was cleared out by rainfall. Data was not available for a portion of this period from 11 to 14 November.
Results
Wildfire vs. non-wildfire PM and elemental size distributions
Passive PM samples from all three BAAQMD sites during the wildfire period recorded elevated PM2.5, PM10-2.5, and PM10 compared to samples from the non-wildfire period ( and SI Table S1). During the wildfire period, the 5 kV size distributions at all four sites were similar and dominated by the submicron particle fraction ( and ). The mean fraction of submicron PM (PM1/PM2.5) was significantly higher during the wildfire period (0.80) compared to the non-wildfire period (0.52) (p < 0.05). San Pablo recorded the highest levels, followed by San Jose, Oakland West, and San Rafael, respectively. Although the site with the highest levels, San Pablo, was physically closest to the fire, the other sites do not follow this N-S trend, consistent with the fact the smoke had spread regionally in a non-linear path across Northern California (NASA Citation2018).
Figure 2. PM mass concentration size distributions measured during wildfire periods (solid lines) and non-wildfire periods (dashed lines) using passive PM samplers and 5 kV analyses, showing enhanced sub-micrometer mode during wildfires. PM mass per volume air is normalized by the dimensionless width of each size bin (dC/dlogda [µg/m3]) and plotted as a function of midpoint aerodynamic diameter (da, m).
![Figure 2. PM mass concentration size distributions measured during wildfire periods (solid lines) and non-wildfire periods (dashed lines) using passive PM samplers and 5 kV analyses, showing enhanced sub-micrometer mode during wildfires. PM mass per volume air is normalized by the dimensionless width of each size bin (dC/dlogda [µg/m3]) and plotted as a function of midpoint aerodynamic diameter (da, m).](/cms/asset/08efc11f-c42f-45c3-a44b-d80b2d8e07c4/uast_a_1895429_f0002_c.jpg)
Table 1. Relative accumulation rates of metals on residential MERV11 furnace filters.
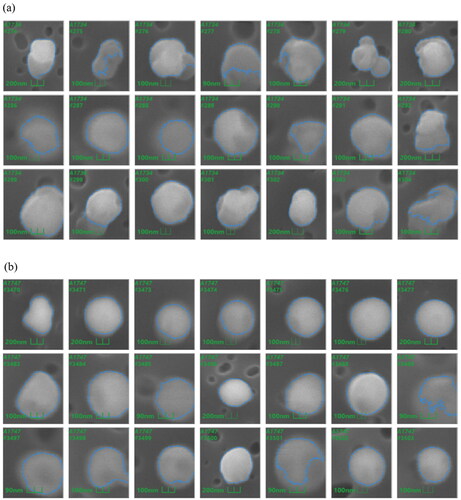
Manual examination of the 5 kV CCSEM micro images revealed that for all sites except San Jose Jackson, these submicron particles were dominated by carbonaceous, nearly spherical, beam-resilient, single particles 150 − 450 nm in diameter, consistent with organic carbon “tar balls” ( and , and SI Figure S1a). These tar balls exhibited carbon and minor oxygen, and on rare occasions, minor potassium (K) peaks (), consistent with other woodsmoke and tar ball measurements (Zhang et al. Citation2013; Adachi et al. Citation2019). San Jose wildfire period PM2.5 also contained biogenic particles, and agglomerates with ten times larger primary particles than typical diesel emissions, possibly agglomerated tar balls (SI Figure S2b).
In contrast, particles collected at the same sites during the non-wildfire period were mostly crustal particles, spores, salts, and vehicle emissions (SI Figure S1b). Rare particles consistent with tar balls were found in the non-wildfire samples at the industry-impacted Oakland West and San Pablo sites, and may be associated with local, low-temperature burning. The non-wildfire prevalence was 1–2 particles per sample, 2 orders of magnitude lower than in the wildfire samples.
Aluminum (Al) and silicon (Si) were highly correlated for all 20 kV CCSEM-EDS elemental size distributions (), consistent with crustal soil particles and ash, and were enhanced in the wildfire samples. Coarse mode K was elevated in the San Pablo and Oakland West wildfire samples when compared to non-wildfire periods. Sodium (Na) and chlorine (Cl) were highly correlated and enhanced in the non-wildfire period at all locations except San Rafael, implying marine salt and seasonal coastal fogs. The magnitude of the non-wildfire salt PM10-2.5 was comparable to the wildfire aluminosilicate PM10-2.5. Sulfur (S) was correlated with calcium (Ca) in the Oakland West wildfire sample, suggesting the presence of gypsum particles.
Wildfire vs. non-wildfire UVPM and BC
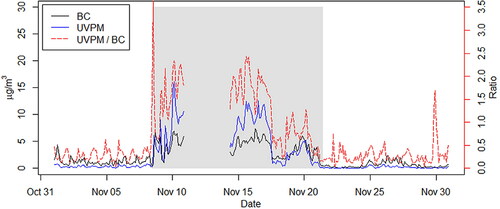
The time series in shows the change in UVPM, BC, and the UVPM/BC ratio during November. UVPM and BC were elevated during this wildfire period, with respective average values of 5.5 and 3.9 µg/m3 during the wildfire period compared to 0.35 and 0.65 µg/m3 averaging over all of 2018. The ratio of UVPM to BC was also higher during the wildfire period, with an average of 1.29 compared to 0.37, indicating a different composition of aerosol and more chemical species that absorb disproportionately in the UV range. The UVPM/BC ratio was highest at the beginning of the wildfire period, and was lower in the last few days, which may indicate aging of the aerosol during the period of stagnation.
Outdoor vs. indoor wildfire PM and elemental size distributions
Collocated passive PM samplers deployed in San Rafael yielded high PM2.5 both outdoors (30.2 µg/m3) and indoors (18.9 µg/m3), as calculated with the 5 kV CCSEM data (SI Table S1). PM10 outdoors (40.5 µg/m3) and indoors (19.9 µg/m3) was dominated by the PM2.5 fraction (75% and 95%, respectively). Plots of the outdoor and indoor size distributions for PM mass and elemental concentration reveal similar fine PM distributions, but substantially reduced coarse PM indoors ( and ).
Figure 3. Indoor/outdoor PM mass concentrations from San Rafael passive PM samplers. (a) Mass concentration size distributions as a function of midpoint aerodynamic diameter of each size bin. (b) Indoor-outdoor penetration ratio of size distributions in (a).
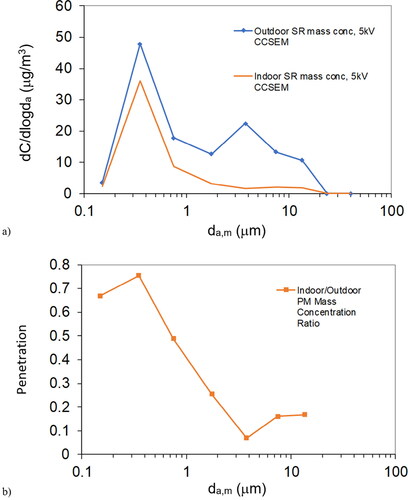
The passive sampler indoor/outdoor penetration ratio for PM2.5 was much greater than for PM10-2.5 (0.63 vs. 0.10), consistent with previous investigations of residential PM (Liu and Nazaroff Citation2003). The ratio plotted for each size bin exhibits a smoothly decreasing function of particle size (). Penetration ratios were as high as 0.8 for tar balls smaller than 500 nm. The high penetration for this particle type is consistent with the CCSEM micro-images, which show that PM2.5 outdoors and indoors were both dominated by submicron, organic carbon tar balls (). These results are consistent with the elemental size distributions in , which show a minor indoor reduction in carbonaceous fine PM but a substantial reduction in inorganic coarse PM and coarse mode K.
Figure 4. Typical micro-images of particles detected automatically by 5 kV CCSEM in San Rafael wildfire samples collected (a) outdoors and (b) indoors, both clearly dominated by nearly spherical, 200 nm, low-contrast BSE particles, consistent with carbonaceous tar balls. The scale for each micro-image ranges between 0.4 and 9 µm.
Coarse PM10 ash and metals in wildfire samples
Passive samples from the wildfire period exhibited combustion and metal-enriched particles not observed in the non-wildfire period, predominantly Mn, Sn, Cu, Zn, Ni, and Pb (SI Figures S4 and S5). Similarly, particles enriched in Cu, Zn, and Pb from the San Pablo wildfire sample were previously reported by Castillo et al. (Citation2019).
The majority of the metal bearing particles detected were in the coarse PM10 size range, though some were in the fine/PM2.5 fraction, including submicron particles with Zn and Ni (SI Figure S4). Various coarse PM10-2.5 particles containing Cu, Zn, Pb, tin (Sn), zirconium (Zr), Mn, antimony (Sb), and iron (Fe) are shown in SI Figures S4 and S5. A few metal-rich particles larger than PM10 were also observed, including 15–25 µm particles enriched in Mn and Fe with high-temperature-characteristic morphologies and 5−50 µm long elongated mineral particles (not shown).
Biomass ash particles, defined here as inorganic particles with enriched K, Phosphorus (P), or Ca and lower levels of Al and Si, were observed less frequently in these wildfire samples (SI Figure S5b) compared to a similar, previous study of agricultural crop burning PM (Wagner et al. Citation2012). It is likely that the greater distance from the fires in this study (300 km compared to 1 km) resulted in more coarse ash particles settling out from the plume before it reached the SFBA. Numerous particles of other types did exhibit enriched K, including fine K-Cl salts and coarse aluminosilicate soils with K and Ca (SI Figure S4d), but these particles could not be distinguished from the non-wildfire background.
Figure 5. SEM-EDS of carbonaceous combustion PM collected during wildfires in San Rafael. (a) typical 200 nm amorphous spheroid morphology of tar ball from biomass combustion. (b) 20 nm primary particles in rarely observed chain agglomerate, typical of diesel vehicle emissions. (c) 300 nm tar ball CCSEM-EDS spectrum (X-ray counts vs. energy [keV]) with K peak.
![Figure 5. SEM-EDS of carbonaceous combustion PM collected during wildfires in San Rafael. (a) typical 200 nm amorphous spheroid morphology of tar ball from biomass combustion. (b) 20 nm primary particles in rarely observed chain agglomerate, typical of diesel vehicle emissions. (c) 300 nm tar ball CCSEM-EDS spectrum (X-ray counts vs. energy [keV]) with K peak.](/cms/asset/ab363ebd-33fa-4c82-8bd7-d3344391d099/uast_a_1895429_f0005_c.jpg)
Figure 6. 20 kV CCSEM-EDS elemental mass concentration size distributions measured by UNC passive PM samplers (a) outdoors at the same three sites during wildfire and non-wildfire periods. (b) San Rafael wildfire samples from outdoors and indoors.
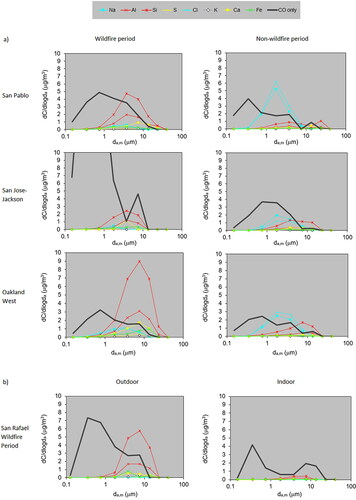
Figure 7. Concentrations of BC and UVPM along with UVPM/BC ratio at the Oakland West site during November 2018. The period of impact from the Camp Fire is shaded in gray. Time resolution is every 2 h.
Fine and coarse metals were also observed in the non-wildfire period, especially at the shipping- and industry-impacted Oakland West site. These background metals included Fe, barium (Ba), titanium (Ti), Cu, vanadium (V), and chromium (Cr), a different profile than that seen during the wildfire period. Large, 50 µm char particles with V- and Ni-rich inclusions were observed in both the Oakland West wildfire and non-wildfire samples (SI Figure S5f), consistent with char from oil combustion (Huffman et al. Citation2000; Lippmann et al. Citation2006), possibly ship emissions from the nearby port or other local burning of heavy fuels. One V-rich particle was observed during the non-wildfire period also in San Pablo, a sampling location also associated with oil and chemical processing facilities.
Particles on home filters collected during wildfires
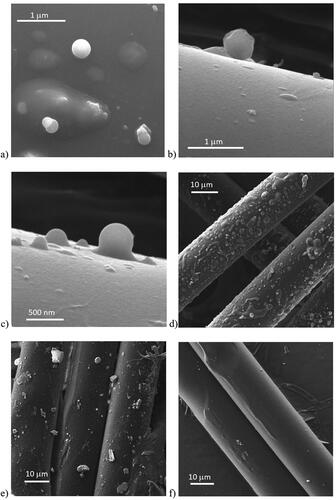
Manual SEM/EDS of the residential MERV11 furnace filter used during the wildfires exhibited particles with morphologies and elemental chemistry consistent with wildfire-generated tar balls (). The wildfire filter also was covered with amorphous, carbonaceous deposits which may represent coagulated tar balls over time (). Heavy metals were detected rarely in fine particles on the wildfire furnace filter, including mixtures of crustal materials and Cu, Sn, Fe, Ti, and Zn. The background San Rafael filter possessed coagulated organic deposits to a much lesser extent, and was instead dominated by crustal dust particles and biogenic particles such as mold hyphae, spores, skin flakes, and hair (). The blank San Rafael filter was quite clean in comparison but exhibited some crustal particles ( and ). The furnace filters themselves consisted of smooth, polymeric fibers that were 20 µm thick. These structures prevented automated CCSEM-EDS analyses, but were much larger than the particles of interest and did not interfere with the manual analyses.
Figure 8. SEM images from San Rafael furnace filters. (a)–(c) Spherical, carbonaceous, submicron tar balls collected during wildfires. (d) Typical fiber surfaces from wildfire filter. (e) Typical fiber surfaces from background filter. (f) Typical fiber surfaces from blank filter.
Of the metals tested by ICP-MS, detectable levels of Cu, Zn, and Pb were found on both the wildfire furnace filter and the background filter, but not the blank. Concentrations of all other metals measured were below detection limits. The area-normalized concentrations of Cu, Zn, and Pb on the background and wildfire filters, while low, were statistically significantly greater than that of the blank filter (p < 0.05). Metal accumulation rates were low, on the order of ng per cm2 of filter per day, and were faster during the wildfire period than during the background period: 173%, 298%, and 371% faster for Cu, Zn, and Pb, respectively (). This is consistent with the observation of metal-enriched particles with Cu, Zn, and Pb in passive samplers during the wildfire that were not present in the non-wildfire period.
Discussion
Implications for wildfire particle exposures
The 150 − 450 nm tar balls that dominated these wildfire samples ( and ) are consistent with other air masses dominated by biomass combustion (China et al. Citation2013; Hand et al. Citation2005; Nussbaumer et al. Citation2008; Posfai et al. Citation2004; Wagner et al. Citation2012). Relatively few soot agglomerates were detected (), consistent with other studies of biomass fires (Adachi and Buseck Citation2008; Li et al. Citation2004). Tar balls are roughly 10 times larger than the 20 nm primary spheroids in typical vehicle emission soot agglomerates (Clague et al. Citation1999), and are dominated by organic rather than elemental carbon (Adachi and Buseck Citation2008; Adachi et al. Citation2019). Air masses dominated by tar balls may thus be associated with different lung retention and health effects than demonstrated by vehicle-emitted soot health studies. In addition, the optical differences between tar balls and typically larger, inorganic test dusts imply that low-cost sensor measurements of wildfire smoke-dominated air require adjustment of their default calibrations (Delp and Singer Citation2020).
Observations of higher UVPM/BC ratios during the wildfires are consistent with a higher organic carbon content that may cause different health effects than non-wildfire PM. While most studies have only been able to account for a small percentage of the specific species that contribute to UV absorption in UVPM, UVPM has been found to be correlated with species such as PAHs and nitrogen-containing aromatics (Huang et al. Citation2018; Samburova et al. Citation2016; Xie et al. Citation2019). Samburova et al. (Citation2016) further suggest that many of the species in biomass burning smoke possess similar structures to 16 PAHs with known toxicity. While it is difficult to speciate all the compounds in PM that contribute to UV-absorption, UVPM is a measure of their collective effect and serves as an indicator that more of these types of toxic compounds may be present. The increased UVPM/BC ratio during the November 2018 wildfires suggest higher organic carbon content in PM, consistent with the observation of tar balls, and therefore the potential for increased toxicity of wildfire PM compared with non-wildfire PM.
Heavy metals were most often observed in the coarse PM fraction. It is possible that the observed metals come from structures and vehicles burned in the fire, which was the most destructive in California history to date with 18,804 structures burned (CAL FIRE Citation2020). The PM10-2.5 wildfire exposures observed in this work are consistent with previous biomass studies which revealed ash remnants of burned plants and building materials, mostly > 2.5 µm on a mass basis, and elements including K, Cl, Ca, Si, S, and Na (Kurkela et al. Citation1997; Li et al. Citation2004; Pitman Citation2006; Wagner et al. Citation2012). Inhalation of PM10-2.5 is associated with inflammation (Adar et al. Citation2014; Kim et al. Citation2014), and is more likely to deposit in the upper airways and throat (Hinds Citation1982), Coarse ash is more likely to settle out of a plume when meteorological conditions otherwise favor the air mass and PM2.5 to stay aloft (Harnly et al. Citation2012; Hinds Citation1982). In such cases, typical ground-based PM2.5 monitors may report low numbers and will not detect the larger PM10-2.5 ash exposure.
The observed particle size dependence of smoke penetration indoors and abundance of tar balls in the indoor passive sample imply that wildfire tar balls are more likely to be found indoors than coarse wildfire ash. In this work, a house intermittently running active ventilation with furnace filters encountered penetration ratios as high as 0.8 for submicron tar balls. SEM/EDS images of the wildfire furnace filter () demonstrate it did capture some tar balls, though published efficiency curves for MERV11 filters suggest it may have done so with poor efficiency (Fazli, Zeng, and Stephens Citation2019). On the other hand, the filtration system and building envelope successfully reduced exposure to coarse PM and associated heavy metals by 90%.
By combining the measured metal masses on the furnace filters with the furnace flow assumed in the Methods and a higher 0.9 filter efficiency corresponding to coarse particles (Fazli, Zeng, and Stephens Citation2019), the average metal concentrations of air passing through the filters for Cu, Zn, and Pb were estimated at 0.49, 4.1, and 0.26 ng/m3, respectively. These estimates are orders of magnitude lower than the OSHA PEL standards of 0.1, 5, and 0.05 mg/m3, indicating that despite accumulating faster during the wildfire, by the time the smoke reached San Rafael, metal concentrations were well below safety thresholds (OSHA Citation1989).
Smoke sampling with passive samplers and furnace filters
Sampling with low cost passive PM samplers enabled rapid deployment at multiple locations and indoors and outdoors during the wildfire episode. Although these measurements suggest that the smoke impacts of this episode were regional in scale, the deployment of multiple samplers enabled assessment of relative PM2.5 magnitudes, particle types and sizes, PM penetration indoors, and confounding by local sources. More field testing is needed to assess smoke-specific PM2.5 and PM10-2.5 quantitation with these passive samplers, including further comparison with other reference and low cost sensor types during wildfires.
Passive PM size distributions measured by the 5 and 20 kV CCSEM-EDS analyses (SI Figure S3) demonstrate that the 5 kV analyses were much more successful at detecting wildfire tar balls, and are recommended when PM is expected to be dominated by combustion particles. The addition of automated classification of tar balls and other submicron particle species would be beneficial, and could be implemented with modified sampler substrates in future work. See SI for more discussion.
Collection of furnace filters from a residence enabled analysis by SEM-EDS and ICP-MS and offers a potential method to collect samples from homes after future wildfires if no other air sample types are available. The relatively low efficiency of many common furnace filters for trapping submicron particles poses a limitation to this approach. Analysis of filters with higher efficiencies (e.g., MERV 13 furnace filters or HEPA filters from portable air cleaners), where they exist, would enable improved capture of submicron particles. In either case, availability of matching filter blanks and filters from non-wildfire periods is essential for meaningful comparisons.
Conclusions
Electron microscopy was used to characterize airborne PM collected by low-cost passive samplers in an urban area during periods impacted by regional wildfire smoke. PM size distributions were similar across the region, though spatial differences were observed in PM magnitudes and confounding by local sources. The passive PM2.5 wildfire samples were dominated by submicron tar balls, and possessed a significantly higher fraction of submicron PM than non-wildfire samples. Coarse ash and K particles were enhanced during wildfires, and rare particles enriched in Cu, Zn, Sn and Pb were observed. An increase in UV absorption by wildfire smoke PM, as evidenced by a higher UVPM/BC ratio, indicated a higher organic content in the PM. The UVPM data was consistent with the observation of enhanced tar balls during a wildfire smoke episode, and may be a potential tracer for biomass smoke-specific PM.
The indoor concentration of wildfire tar balls was found to be comparable to the outdoor concentration in one residence that employed furnace filters during the wildfire smoke episode, suggesting the filter’s relative ineffectiveness for particles in this size range. Coarse ash, however, was reduced substantially indoors. More heavy metals were captured by the furnace filter during the wildfire period than during a later period not influenced by wildfire smoke, but estimates of the metals on the filter suggest concentrations were well below OSHA limits by the time the smoke was transported 300 km to the SFBA.
This work involved a rapid response to a smoke episode and employed a limited number of samples. The passive samplers, UVPM data, and home air filter analyses nevertheless showed some utility for characterizing PM components specific to biomass smoke in urban environments downwind of wildfires. Future work during wildfire episodes should employ additional indoor/outdoor analyses to compare different community and residential environments and further evaluate smoke-specific air pollutants.
Supplemental Material
Download PDF (988.8 KB)Acknowledgments
We thank Charity Garland, Jonathan Bower, Steven Randall, and Brett Yamaichi from BAAQMD for assistance with sampling at their sites and their aethalometer data, as well as Gary Casuccio and Roger West from RJ Lee Group for discussions on the CCSEM-EDS analyses.
Additional information
Funding
References
- Adachi, K., and P. R. Buseck. 2008. Internally mixed soot, sulfates, and organic matter in aerosol particles from Mexico City. Atmos. Chem. Phys. 8 (21):6469–81. doi:https://doi.org/10.5194/acp-8-6469-2008.
- Adachi, K., A. J. Sedlacek, L. Kleinman, S. R. Springston, J. Wang, D. Chand, J. M. Hubbe, J. E. Shilling, T. B. Onasch, T. Kinase, et al. 2019. Spherical tarball particles form through rapid chemical and physical changes of organic matter in biomass-burning smoke. Proc Natl Acad Sci USA. 116 (39):19336–41. doi:https://doi.org/10.1073/pnas.1900129116.
- Adar, S. D., P. A. Filigrana, N. Clements, and J. L. Peel. 2014. Ambient coarse particulate matter and human health: A systematic review and meta-analysis. Curr. Environ. Health Rep. 1:258–74. doi:https://doi.org/10.1007/s40572-014-0022-z.
- AirNow-Tech. 2020. Accessed October 30, 2020. https://www.airnowtech.org/.
- Andreae, M. O., and A. Gelencsér. 2006. Black carbon or brown carbon? The nature of light-absorbing carbonaceous aerosols. Atmos. Chem. Phys. 6 (10):3131–48. doi:https://doi.org/10.5194/acp-6-3131-2006.
- Arashiro, M., and D. Leith. 2013. Precision of PM measurements with the UNC passive aerosol sampler. J. Aerosol Sci. 57:181–4. doi:https://doi.org/10.1016/j.jaerosci.2012.09.001.
- Austin, C. 2008. Wildland firefighter health risks and respiratory protection. In Chemical substances and biological agents studies and research projects. Montréa: IRSST - Institut de Recherche en Santé & Sécurité du Travail.
- Black, R. R., J. Aurell, A. Holder, I. J. George, B. K. Gullett, M. D. Hays, C. D. Geron, and D. Tabor. 2016. Characterization of gas and particle emissions from laboratory burns of peat. Atmos. Environ. 132:49–57. doi:https://doi.org/10.1016/j.atmosenv.2016.02.024.
- CAL FIRE. 2019. Fire perimeters. Accessed September 30, 2020. https://egis.fire.ca.gov/arcgis/rest/services/FRAP/FirePerimeters_FS/FeatureServer
- CAL FIRE. 2020. Top 20 most destructive california wildfires. Accessed November 30, 2020. https://www.fire.ca.gov/media/11417/top20_destruction.pdf
- CARB. 2003. Air quality and the wildland fires of southern California October, 2003: California Air Resources Board. Accessed March 3, 2021. https://haze.airfire.org/webaccess/susan/HAQAST/Wildfires_TT/References/HealthImpacts/ARB_socal_report_revised_sept2010.pdf
- Castillo, M. D., J. Wagner, G. S. Casuccio, R. R. West, F. R. Freedman, H. M. Eisl, Z. Wang, J. P. Yip, and P. L. Kinney. 2019. Field testing a low-cost passive aerosol sampler for long-term measurement of ambient PM2.5 concentrations and particle composition. Atmos. Environ. 216:116905. doi:https://doi.org/10.1016/j.atmosenv.2019.116905.
- CDPH. 2019. Wildfire smoke: Considerations for California's public health officials. California Department of Public Health. Accessed March 3, 2021. https://www.cdph.ca.gov/Programs/EPO/CDPH%20Document%20Library/Wildfire%20Smoke%20Considerations%20for%20California's%20Public%20Health%20Officials%20(August%202019)_508.pdf
- China, S., C. Mazzoleni, K. Gorkowski, A. C. Aiken, and M. K. Dubey. 2013. Morphology and mixing state of individual freshly emitted wildfire carbonaceous particles. Nat. Commun. 4:2122 doi:https://doi.org/10.1038/ncomms3122.
- Clague, A. D. H., J. B. Donnet, T. K. Wang, and J. C. M. Peng. 1999. A comparison of diesel engine soot with carbon black. Carbon. 37 (10):1553–65. doi:https://doi.org/10.1016/S0008-6223(99)00035-4.
- Croft, D. P., W. Zhang, S. Lin, S. W. Thurston, P. K. Hopke, E. van Wijngaarden, S. Squizzato, M. Masiol, M. J. Utell, and D. Q. Rich. 2020. Associations between source-specific particulate matter and respiratory infections in New York state adults. Environ. Sci. Technol. 54 (2):975–84. doi:https://doi.org/10.1021/acs.est.9b04295.
- Delp, W. W., and B. C. Singer. 2020. Wildfire smoke adjustment factors for low-cost and professional PM(2.5) monitors with optical sensors. Sensors. 20 (13):3683. doi:https://doi.org/10.3390/s20133683.
- Domitrovitch, J. W., G. A. Broyles, R. D. Ottmar, T. E. Reinhardt, L. P. Naeher, M. T. Kleinman, K. M. Navarro, C. E. Mackay, and O. Adetona. 2017. Wildland fire smoke health effects on wildland firefighters and the public. US Forest Service. Accessed March 3, 2021. https://www.firescience.gov/projects/13-1-02-14/project/13-1-02-14_final_report.pdf
- EPA. 2019. Wildfire smoke: A guide for public health officials. Environmental Protection Agency. Accessed March 3, 2021. https://www.airnow.gov/publications/wildfire-smoke-guide/wildfire-smoke-a-guide-for-public-health-officials/
- Fabian, R., J. L. Borgerson, S. I. Kerber, P. D. Gandhi, C. S. Baxter, C. S. Ross, J. E. Lockey, and J. M. Dalton. 2010. Firefighter exposure to smoke particulates. Underwriters Laboratories. Accessed March 3, 2021. https://ulfirefightersafety.org/research-projects/firefighter-exposure-to-smoke-particulates.html
- Fazli, T., Y. Zeng, and B. Stephens. 2019. Fine and ultrafine particle removal efficiency of new residential HVAC filters. Indoor Air. 29 (4):656–69. doi:https://doi.org/10.1111/ina.12566.
- Grahame, T. J. 2009. Does improved exposure information for PM2.5 constituents explain differing results among epidemiological studies? Inhal. Toxicol. 21 (5):381–93. doi:https://doi.org/10.1080/08958370802380495.
- Hand, J. L., W. C. Malm, A. Laskin, D. Day, T. Lee, C. Wang, C. Carrico, J. Carrillo, J. P. Cowin, J. Collett, et al. 2005. Optical, physical, and chemical properties of tar balls observed during the Yosemite aerosol characterization study. J. Geophys. Res. 110 (D21):D21210. doi:https://doi.org/10.1029/2004JD005728.
- Hansen, A. D. A. 2005. The aethalometer. Operating Manual v.2005.07. Berkeley: Magee Scientific.
- Harnly, M., K. Naik-Patel, S. Wall, P. Quintana, D. Pon, and J. Wagner. 2012. Agricultural burning monitored for air pollutants in Imperial County; exposure reduction recommendations developed. Cal. Ag. 66 (3):85–90. doi:https://doi.org/10.3733/ca.v066n03p85.
- HEI NPACT Review Panel. 2013. Executive summary. HEI’s national particle component toxicity (NPACT) initiative. Boston, MA: Health Effects Institute.
- Hinds, W. C. 1982. Aerosol technology: Properties, behavior, and measurement of airborne particles. New York: John Wiley & Sons.
- Huang, R. J., L. Yang, J. Cao, Y. Chen, Q. Chen, Y. Li, J. Duan, C. Zhu, W. Dai, K. Wang, et al. 2018. Brown carbon aerosol in urban Xi'an, northwest china: The composition and light absorption properties. Environ. Sci. Technol. 52 (12):6825–33. doi:https://doi.org/10.1021/acs.est.8b02386.
- Huffman, G. P., F. E. Huggins, N. Shah, R. Huggins, W. P. Linak, C. A. Miller, R. J. Pugmire, H. L. C. Meuzelaar, M. S. Seehra, and A. Manivannan. 2000. Characterization of fine particulate matter produced by combustion of residual fuel oil. J. Air Waste Manag. Assoc. 50 (7):1106–14. doi:https://doi.org/10.1080/10473289.2000.10464157.
- Jaffe, D. A., S. M. O'Neill, N. K. Larkin, A. L. Holder, D. L. Peterson, J. E. Halofsky, and A. G. Rappold. 2020. Wildfire and prescribed burning impacts on air quality in the United States. J. Air Waste Manag. Assoc. 70 (6):583–615. doi:https://doi.org/10.1080/10962247.2020.1749731.
- Jones, C. G., Rappold, A.G., Vargo, J., Cascio, W.E., Kharrazi, M., McNally, B., Hoshiko, S.,; with the CARES Surveillance Group. 2020. Out-of-hospital cardiac arrests and wildfire-related particulate matter during 2015–2017 California wildfires. J. Am. Heart Assoc. 9(8):e014125. doi:https://doi.org/10.1161/JAHA.119.014125.
- Jump, D. A., I. S. Walker, and M. P. Modera. 1996. Field measurements of efficiency and duct retrofit effectiveness in residential forced air distribution systems. In 1996 ACEEE summer study on energy efficiency in buildings. Pacific Grove, CA: American Council for an Energy Efficient Economy.
- Kim, Y. H., H. Tong, M. Daniels, E. Boykin, Q. T. Krantz, J. McGee, M. Hays, K. Kovalcik, J. A. Dye, and M. I. Gilmour. 2014. Cardiopulmonary toxicity of peat wildfire particulate matter and the predictive utility of precision cut lung slices. Part. Fibre Toxicol. 11:29. doi:https://doi.org/10.1186/1743-8977-11-29.
- Kirchstetter, T. W., T. Novakov, and P. V. Hobbs. 2004. Evidence that the spectral dependence of light absorption by aerosols is affected by organic carbon. J. Geophys. Res. 109 (D21):D21208. doi:https://doi.org/10.1029/2004JD004999.
- Kiser, D., W. J. Metcalf, G. Elhanan, B. Schnieder, K. Schlauch, A. Joros, C. Petersen, and J. Grzymski. 2020. Particulate matter and emergency visits for asthma: A time-series study of their association in the presence and absence of wildfire smoke in Reno, Nevada, 2013-2018. Environ. Health 19 (1):92 doi:https://doi.org/10.1186/s12940-020-00646-2.
- Kurkela, J., J. Latva-Somppi, U. Tapper, and E. Kauppinen. 1997. Inorganic aerosol formation and deposition during fluidized bed combustion of biomasses and wood waste. J. Aerosol Sci. 28:S415–S416. doi:https://doi.org/10.1016/S0021-8502(97)85207-X.
- Lee, S., H. Wong, and Y. Lau. 2006. Association between air pollution and asthma admission among children in Hong Kong. Clin. Exp. Allergy 36 (9):1138–46. doi:https://doi.org/10.1111/J.1365-2222.2006.02555.x.
- Li, J., M. Posfai, P. Hobbs, and P. Buseck. 2004. Individual aerosol particles from biomass burning in southern Africa: 2, compositions and aging of inorganic particles. J. Geophys. Res. 108:8484. doi:https://doi.org/10.1029/2002JD002310.
- Lippmann, M., K. Ito, J. Hwang, P. Maciejczyk, and L. Che. 2006. Cardiovascular effects of nickel in ambient air. Environ. Health Perspect. 114 (11):1662–9. doi:https://doi.org/10.1289/ehp.9150.
- Liu, D.-L., and W. Nazaroff. 2003. Particle penetration through building cracks. Aerosol Sci. Technol. 37 (7):565–73. doi:https://doi.org/10.1080/02786820300927.
- NASA. 2018. Camp fire spread foul air in California. Accessed September 30, 2020. https://earthobservatory.nasa.gov/images/144261/camp-fire-spreads-foul-air-in-california
- Nelson, J., M.-C G. Chalbot, I. Tsiodra, N. Mihalopoulos, and I. G. Kavouras. 2021. Physicochemical characterization of personal exposures to smoke aerosol and PAHs of wildland firefighters in prescribed fires. Expo. Health. 13 (1):105–18. doi:https://doi.org/10.1007/s12403-020-00366-5.
- Nguyen, D., J. Claiborne, R. Lam, C. Normal, K. Hoag, and C. Knoderer. 2019. 2019 air monitoring network plan. Bay Area Air Quality Management District. Accessed March 3, 2021. https://www.baaqmd.gov/˜/media/files/technical-services/2019_network_plan-pdf
- NOAA HYSPLIT Trajectory Model. Accessed November 12, 2020. https://www.ready.noaa.gov/HYSPLIT_traj.php
- Nussbaumer, T., C. Czasch, N. Klippel, L. Johansson, and C. Tullin. 2008. Particulate emissions from biomass combustion in IEA countries - Survey on measurements and emission factors. In International energy agency bioenergy Task 32 report. Zurich: International Energy Agency.
- Olson, M. R., M. Victoria Garcia, M. A. Robinson, P. Van Rooy, M. A. Dietenberger, M. Bergin, and J. J. Schauer. 2015. Investigation of black and brown carbon multiple-wavelength-dependent light absorption from biomass and fossil fuel combustion source emissions. J. Geophys. Res. Atmos. 120 (13):6682–97. doi:https://doi.org/10.1002/2014JD022970.
- OSHA 1989. United States code of federal regulations, cfr 29 1910.1000, air contaminants, final rule. Washington, DC: Occupational Safety and Health Administration.
- Ott, D. K., and T. M. Peters. 2008. A shelter to protect a passive sampler for coarse particulate matter, pm 10-2.5. Aerosol Sci. Technol. 42 (4):299–309. doi:https://doi.org/10.1080/02786820802054236.
- Peters, A., M. Frohlich, A. Doring, T. Immervoll, H. E. Wichmann, W. L. Hutchinson, M. B. Pepys, and W. Koenig. 2001. Particulate air pollution is associated with an acute phase response in men; results from the MONICA-Augsburg study. Eur. Heart J. 22 (14):1198–204. doi:https://doi.org/10.1053/euhj.2000.2483.
- Peters, T. M., E. J. Sawvel, R. Willis, R. R. West, and G. S. Casuccio. 2016. Performance of passive samplers analyzed by computer-controlled scanning electron microscopy to measure PM10-2.5. Environ. Sci. Technol. 50 (14):7581–9. doi:https://doi.org/10.1021/acs.est.6b01105.
- Pitman, R. 2006. Wood ash use in forestry - a review of the environmental impacts. Forestry 79 (5):563–88. doi:https://doi.org/10.1093/forestry/cpl041.
- Pope, C. A., and D. W. Dockery. 2006. Health effects of fine particulate air pollution: Lines that connect. J. Air Waste Manag. Assoc. 56 (6):709–42. doi:https://doi.org/10.1080/10473289.2006.10464485.
- Posfai, M., A. Geleneser, R. Simonics, K. Arato, J. Li, P. Hobbs, and P. Buseck. 2004. Atmospheric tar balls: Particles from biomass and biofuel burning. J. Geophys. Res. 109:D06213. doi:https://doi.org/10.1029/2003JD004169.
- Robinson, M. S., M. Zhao, L. Zack, C. Brindley, L. Portz, M. Quarterman, X. Long, and P. Herckes. 2011. Characterization of PM(2.5) collected during broadcast and slash-pile prescribed burns of predominately ponderosa pine forests in northern Arizona. Atmos. Environ. (1994). 45 (12):2087–94. doi:https://doi.org/10.1016/j.atmosenv.2011.01.051.
- Rooney, B., Y. Wang, J. H. Jiang, B. Zhao, Z.-C. Zeng, and J. H. Seinfeld. 2020. Air quality impact of the Northern California Camp Fire of November 2018. Atmos. Chem. Phys. 20 (23):14597–616. doi:https://doi.org/10.5194/acp-2020-541.
- Samburova, V., J. Connolly, M. Gyawali, R. L. N. Yatavelli, A. C. Watts, R. K. Chakrabarty, B. Zielinska, H. Moosmuller, and A. Khlystov. 2016. Polycyclic aromatic hydrocarbons in biomass-burning emissions and their contribution to light absorption and aerosol toxicity. Sci. Total Environ. 568:391–401. doi:https://doi.org/10.1016/j.scitotenv.2016.06.026.
- Schwartz, J., A. Litonjua, H. Suh, M. Verrier, A. Zanobetti, M. Syring, B. Nearing, R. Verrier, P. Stone, G. MacCallum, et al. 2005. Traffic related pollution and heart rate variability in a panel of elderly subjects. Thorax. 60 (6):455–61. doi: https://doi.org/10.1136/thx.2004.024836.
- Steiner, S., C. Bisig, A. Petri-Fink, and B. Rothen-Rutishauser. 2016. Diesel exhaust: Current knowledge of adverse effects and underlying cellular mechanisms. Arch. Toxicol. 90 (7):1541–53. doi:https://doi.org/10.1007/s00204-016-1736-5.
- Urbanski, S. P., W. M. Hao, S. Baker, A. Bytnerowicz, M. Arbaugh, A. Riebau, and C. Anderson. 2009. Chapter 4 chemical composition of wildland fire emissions. In Wildland fires and air pollution. Developments in environmental science, ed. A. Bytnerowicz, M. Arbaugh, A. Riebau and C. Andersen, vol. 8 79–107. Amsterdam: Elsevier. doi:https://doi.org/10.1016/S1474-8177(08)00004-1.
- Wagner, J., and D. Leith. 2001. Passive aerosol sampler. Part I: Principle of operation. Aerosol Sci. Technol. 34 (2):186–92. doi:https://doi.org/10.1080/027868201300034808.
- Wagner, J., and J. M. Macher. 2003. Comparison of a passive aerosol sampler to size-selective pump samplers in indoor environments. AIHA J (Fairfax, Va). 64 (5):630–9. doi:https://doi.org/10.1080/15428110308984856.
- Wagner, J., K. Naik-Patel, S. Wall, and M. Harnly. 2012. Measurement of ambient particulate matter concentrations and particle types near agricultural burns using electron microscopy and passive samplers. Atmos. Environ. 54:260–71. doi:https://doi.org/10.1016/j.atmosenv.2012.01.067.
- Wang, X., C. P. Meyer, F. Reisen, M. Keywood, P. K. Thai, D. W. Hawker, J. Powell, and J. F. Mueller. 2017. Emission factors for selected semivolatile organic chemicals from burning of tropical biomass fuels and estimation of annual Australian emissions. Environ. Sci. Technol. 51 (17):9644–52. doi:https://doi.org/10.1021/acs.est.7b01392.
- Wang, Y., P. K. Hopke, O. V. Rattigan, and Y. Zhu. 2011. Characterization of ambient black carbon and wood burning particles in two urban areas. J. Environ. Monit. 13 (7):1919–26. doi:https://doi.org/10.1039/c1em10117j.
- Wettstein, Z. S., S. Hoshiko, J. Fahimi, R. J. Harrison, W. E. Cascio, and A. G. Rappold. 2018. Cardiovascular and cerebrovascular emergency department visits associated with wildfire smoke exposure in California in 2015. J. Am. Heart Assoc. 7 (8):e007492. doi:https://doi.org/10.1161/JAHA.117.007492.
- Wolf, R. E., T. M. Hoefen, P. L. Hageman, S. A. Morman, and G. S. Plumlee. 2010. Speciation of arsenic, selenium, and chromium in wildfire impacted soils and ashes. Denver: U.S. Geological Survey, Open File Report 2010–1242. doi:https://doi.org/10.3133/ofr20101242.
- Xie, M., X. Chen, M. D. Hays, and A. L. Holder. 2019. Composition and light absorption of n-containing aromatic compounds in organic aerosols from laboratory biomass burning. Atmos. Chem. Phys. 19 (5):2899–915. doi:https://doi.org/10.5194/acp-19-2899-2019.
- Yao, J., M. Brauer, J. Wei, K. M. McGrail, F. H. Johnston, and S. B. Henderson. 2020. Sub-daily exposure to fine particulate matter and ambulance dispatches during wildfire seasons: A case-crossover study in British Columbia, Canada. Environ Health Perspect. 128 (6):67006. doi:https://doi.org/10.1289/ehp5792.
- Zhang, Y., D. Obrist, B. Zielinska, and A. Gertler. 2013. Particulate emissions from different types of biomass burning. Atmop. Environ. 72:27–35. doi:https://doi.org/10.1016/j.atmosenv.2013.02.026.