
 ?Mathematical formulae have been encoded as MathML and are displayed in this HTML version using MathJax in order to improve their display. Uncheck the box to turn MathJax off. This feature requires Javascript. Click on a formula to zoom.
Abstract
Constraining the climate impact of particulate brown carbon (BrC) will require identification of formation mechanisms and isolation of its different components to allow for source apportionment. For fresh combustion aerosols, the light absorption characteristics and the Absorption Ångstrom Exponent (AAE) are principally controlled by the combustion conditions in which the particles formed and evolved. We investigated the influence of combustion temperatures on the BrC or black carbon (BC) emission characteristics for a miniCAST soot generator (propane fuel) and a modern heavy-duty diesel engine (petroleum diesel and two renewable diesel fuels). Changes in the AAE, mass spectral signatures, and thermal-optical characteristics were studied. We show that changing operating parameters to gradually reduce the combustion temperatures in these two fundamentally different combustion devices result in a regression from BC dominated to BrC dominated particle emissions. The regression toward BrC was associated with: (1) an increasing mass fraction of particulate non-refractory polycyclic aromatic hydrocarbons (PAHs), (2) an increasing fraction of refractory organic carbon, (3) more curved soot nanostructures and shorter fringe lengths, and (4) increased signal from (refractory) large carbon fragments in IR laser-vaporization aerosol mass spectra. Based on these results we argue that fresh BrC dominated combustion aerosols are attributed to primary emissions from low temperature combustion, highlighting the influence of refractory constituents and soot nanostructure. Higher temperatures favor the growth of conjugated polyaromatic structures in the soot, a progression hypothesized to control the evolution from BrC to BC character of the emitted aerosols.
EDITOR:
1. Introduction
Soot, the common term for carbonaceous particulate matter (PM) emitted from combustion of carbonaceous fuels, is an important component of ambient air pollution (Lewtas Citation2007; Sigsgaard et al. 2015) and a potent climate pollutant (Bond et al. Citation2013; The Intergovernmental Panel on Climate Change (IPCC) Citation2013; Gustafsson and Ramanathan Citation2016). Soot forms in flames of natural and anthropogenic combustion processes, and in controlled environments during carbon black production. The physical, chemical, and optical properties of soot depend largely on the evolution of soot properties in the hot combustion environment (Wang Citation2011). This implies that soot characteristics relevant for climate and health are determined by combustion conditions that control the formation of soot precursors and the subsequent nucleation, growth, oxidation, and evolution of carbon nanostructure as combustion progresses. This article focuses on the composition of immature soot, the precursors to refractory black carbon (BC), and the generalizability of these to climate relevant brown carbon (BrC) in combustion emissions.
Refractory BC-related soot components efficiently absorb electromagnetic radiation in the ultra-violet (UV) to infrared spectrum (Bond and Bergstrom Citation2006; Bond et al. Citation2013; Petzold et al. Citation2013), and the direct radiative forcing from BC in the atmosphere has been suggested as second most important after CO2 (IPCC Citation2013; Gustafsson and Ramanathan Citation2016). Organic aerosols mainly scatter incoming solar radiation, and have a cooling effect on the climate. Poorly absorbing organic and inorganic coatings on mature soot particles may however contribute to the positive radiative forcing of combustion emissions by the so-called “lensing” enhancement effect (Schnaiter et al. Citation2003; Schnaiter et al. Citation2005; Peng et al. Citation2016). In addition to BC, light-absorbing organic particles known as BrC can be emitted as primary combustion PM, mainly from biomass combustion, or form by secondary aerosol formation and ageing in the atmosphere (Andreae and Gelencsér Citation2006; Laskin, Laskin, and Nizkorodov Citation2015). BrC materials represent climate relevant classes of PM components characterized by significant light absorption at short wavelengths. While BC light-absorption has a weak wavelength dependence and an absorption Ångström exponent (AAE) of ∼1, BrC have AAEs larger than 1 and exhibit strong wavelength dependent light-absorption. Light absorption by BrC shifts the cooling effect (large negative direct radiative forcing) of scattering organic aerosols to a net-effect closer to zero (Chung, Ramanathan, and Decremer Citation2012), although its effect on global warming is poorly constrained.
Soot emissions can be characterized by refractory and non-refractory materials. Covalently bonded clusters form the refractory soot particles inside the hot flame environment. Non-refractory materials such as small to medium-sized polycyclic aromatic hydrocarbons (PAHs) and larger aliphatic molecules exist only in the gas phase at high temperatures, but can condense on the surfaces of refractory material or nucleate upon cooling and dilution of the combustion emissions. The non-refractory PAHs absorb light predominantly in the UV and visible spectral regions and represent one important class of organic carbon (OC) components responsible for BrC absorption of freshly emitted combustion emissions (Apicella et al. Citation2004; Schnaiter et al. Citation2006). Premixed flame studies have shown that optical properties of soot change as soot evolves with higher distance from the fuel outlet (López-Yglesias, Schrader, and Michelsen Citation2014; Simonsson et al. Citation2015). During this process, the soot becomes more strongly absorbing and obtains a lower AAE, i.e., characteristics that reflect a transition from BrC to BC. It is, however, intriguingly difficult to separate the relative importance of BrC absorption related to refractory and non-refractory materials for real world emissions, where non-refractory and refractory absorbing components are mixed.
The terminology for soot particles depends on the scientific community, and similar soot particle characteristics therefore have different names (Petzold et al. Citation2013). When referring to soot, we propose that the most appropriate terminology is that originating from the combustion community and the study of soot formation in flames. The first carbonaceous particles that form inside hot and fuel-rich environments are termed incipient soot particles. These were recently proposed to form by clustering of hydrocarbons by radical-chain reactions (abbreviated CHRCH) involving five-membered resonance-stabilized radical (RSR) species and addition of vinyl or acetylene (Johansson et al. Citation2018). The RSR clusters form covalently bonded incipient soot particles by reacting with available hydrocarbons, PAHs and smaller hydrocarbons. The clusters continue to grow by surface reactions from the subsequent addition of available hydrocarbons and RSR species to the incipient particle surfaces. As the incipient particle grows it undergoes a graphitization process. The hot flame environment results in a carbonization process where hydrogen is abstracted or emitted and PAHs rearrange from amorphous (disordered) to graphitic-like (ordered) layered structures (Kholghy, Veshkini, and Thomson Citation2016; Johansson et al. Citation2018). This graphitization process is synonymously described as a soot maturation process. While mature soot is more graphitic-like in character and has typical BC absorption properties, immature soot has amorphous character and is found shortly after soot inception in flames.
Light extinction measurements on soot in flames have shown that the refractory components of immature soot are characterized by BrC absorption and increased absorption wavelength dependence (López-Yglesias, Schrader, and Michelsen Citation2014; Simonsson et al. Citation2015). The absorption wavelength dependence decreases when the soot matures and typically approaches AAEs close to 1 for mature soot (refractory BC materials) (Simonsson et al. Citation2015; Wang et al. Citation2016). For real-world combustion emissions, the maturity level of soot and composition of combustion generated PM emissions have a strong dependence on combustion temperature (Bond and Bergstrom Citation2006; Saleh, Cheng, and Atwi Citation2018; Cheng et al. Citation2019). Generalizing, BC is emitted from combustion sources where the soot has evolved in high temperature combustion environments, for example in combustion engines (Maricq Citation2014; Malmborg et al. Citation2017). Soot with BrC absorption properties is predominantly emitted from biomass combustion and appliances where temperatures are relatively low and soot evolution is generally slow (Roden et al. Citation2006; Chakrabarty et al. Citation2010).
Well-designed experiments have shown that strong BrC absorption in biomass combustion emissions is related to low volatility organic compounds resistant to evaporation during heating to 250 °C (Saleh et al. Citation2014; Saleh, Cheng, and Atwi Citation2018). These compounds can either form particles or be internally mixed with refractory BC particles. We recently showed that BrC absorption properties of immature soot emissions from a laboratory propane-flame was only partially related to non-refractory organic components (Török et al. Citation2018) and that AAEs remained elevated (>1.5) after removal of the major part of the non-refractory organic aerosol (upon in-situ thermal conditioning of the aerosol to 500 °C). The remaining material was attributed to low volatility OC that evolve at high temperatures (>450 °C) and compounds that partially form pyrolytic carbon during thermal-optical carbon analysis. This material was not detected as OA with a standard aerosol mass spectrometer (AMS) that uses thermal desorption at 600 °C on short time scales to the vaporize particles. However, fragments from the remaining material was detected as large carbon clusters () in mass spectra from IR laser-vaporization AMS and was consequently identified as refractory OC (Török et al. Citation2018). The same soot was also found to have immature soot characteristics with disordered carbon nanostructures and short fringe lengths (Malmborg et al. Citation2019).
Refractory soot components appear as carbon lamellae (i.e., refractory polycyclic aromatic units) in both immature and mature soot (Andreae and Gelencsér Citation2006; Miller et al. Citation2013; Huang and Vander Wal Citation2016; Malmborg et al. Citation2019). The optical band gap of soot decreases when the size of sp2-bonded aromatic clusters increases (i.e., increasing PAH unit size), and a change to larger aromatic clusters is associated with a decreasing wavelength dependence (i.e., Ångström exponent) and increasing absorption cross section (Andreae and Gelenscér Citation2006; Bond and Bergstrom Citation2006; Laskin, Laskin, and Nizkorodov Citation2015; Botero et al. Citation2016; Menon et al. Citation2019). A smaller size of carbon lamellae has previously been hypothesized to be the explanation to why some soot have BrC characteristics (Bond Citation2001; Schnaiter et al. Citation2006). In this work we present experimental data which supports the hypothesis that a substantial part of the BrC light absorption from fresh combustion emissions is attributed to immature soot, and specifically to smaller sized and curved refractory polycyclic aromatic units. Due to the slower soot maturation process at low flame temperatures, these refractory particles with immature character and BrC absorption are likely to be emitted predominantly during low temperature combustion. Conceptually, this relation allows a more general description and understanding of what type of combustion appliances can be expected to generate BrC emissions.
Direct or near real-time tools to recognize refractory BrC components have so far only been employed in a qualitative manner to identify distinctive differences in the molecular size and mass spectra of refractory BrC and BC components (Maricq Citation2014; Saleh, Cheng, and Atwi Citation2018). The results in this study suggest that the refractory BrC and immature soot components are identifiable in a predictable manner using laser heating/vaporization on-line aerosol mass spectrometry and analysis of the refractory carbon cluster distribution. This is particularly important for studies aimed at advancing our understanding of the relative significance of refractory and non-refractory, primary and secondary, particle components to the BrC radiative climate forcing. It may also aid us in identifying the components of combustion particles that contribute to its adverse health effects.
2. Methodology
Soot properties were analyzed in emissions from a miniCAST soot generator and an experimental heavy-duty diesel engine. Briefly, the experimental set-up consisted of the combustion source, a dilution system, an optional Thermodenuder (TD) set to 250 °C, and techniques to monitor the optical properties and the physicochemical characteristics of the soot.
2.1. MiniCAST soot generator
The miniCAST consists of a co-flow diffusion flame, quenched with N2 gas at a set height. To reduce flame temperatures in the miniCAST diffusion flame, the propane fuel-gas is premixed and diluted at varying flows with N2. Addition of N2 also increases the cold gas flow and thereby reduces the time it takes for the gas molecule to travel from the fuel outlet of the burner to the height at which the flame is quenched. The global equivalence ratio is different between the operating points but was not explicitly derived as this parameter only is meaningful for premixed flames, while here a diffusion flame was utilized. The miniCAST operating points are shown in . Parts of the miniCAST data were published previously, and showed that diluting the fuel with N2 results in reduced BC emissions and less mature soot (Török et al. Citation2018; Malmborg et al. Citation2019). The set-points used in this study were the same as those in our previous study (Török et al. Citation2018), but were extended with one point of even higher N2 dilution (OP8). The dilution system consisted of a single or two ejector dilutors (Dekati, Finland) in series using filtered air at ambient temperature, with a total dilution ratio of approximately 1:10 or 1:100.
Table 1. MiniCAST operating conditions.
Compared to our previous work (Török et al. Citation2018; Malmborg et al. Citation2019), the miniCAST data set shown here also include experiments that used a higher dilution factor before the TD to reduce the eBC concentration to <50 µg/m3. This allowed more efficient evaporation of non-refractory components (such as PAHs) in the TD. It also allowed operation of the aethalometer in a concentration range with less variability due to a less rapid filter loading (mainly for no or low N2 dilution).
2.2. Heavy-duty engine and fuels
Diesel combustion normally occurs at high temperatures of above 2000 K. The diesel engine combustion temperatures were reduced by utilizing exhaust gas recirculation (EGR), where a fraction of the exhaust gases were dried and recirculated back to the engine air intake, diluting the intake air with mainly inert CO2. Less O2 available for combustion and the increased heat capacity of the gas mixture from substitution of O2 with CO2 resulted in significantly reduced combustion temperatures and thereby lowered thermal NO formation (Satoh et al. Citation1997). The temperature reduction from utilizing EGR was not explicitly monitored, but manifested from the exponential decay of thermally produced NOx emissions with the reduced intake O2 concentration (Figure SI1 in the online supplementary information [SI]).
The experiments were performed using a Scania D13 heavy-duty six-cylinder diesel engine modified for single cylinder operation. The engine is described in detail by Shukla et al. (Citation2018). The engine test rig was equipped with an adjustable EGR system which consisted of an EGR valve and an exhaust backpressure valve. The cooled, high-pressure EGR was introduced to the intake plenum for blending with pressurized fresh air.
Four different fuels were used in this study: petroleum-based Swedish MK-1 diesel with a low aromatic content (<5%), Hydrotreated Vegetable Oil (HVO100), Rapeseed Methyl Esther biodiesel (RME100), and a mixture of 20% (by volume) RME and 80% MK-1 diesel (RME20). The renewable HVO and RME have no aromatic content. Two campaigns were carried out. In the first campaign performed in 2016, Diesel, RME100, and RME20 were investigated. The exhaust was in this case diluted 1:100 using two ejector type diluters in series (Dekati, Finland). In the second campaign performed in 2017, diesel, RME100 and HVO100 were investigated. The exhaust gases were in this case diluted using a partial flow dilution tunnel with a dilution of 1:30–1:150 (Gren et al. Citation2020).
The gross indicated mean effective pressure (IMEPg) was 6 bar in both studies, corresponding to a low load engine operating condition. The air excess ratio (λ) was ∼4.6 (i.e., an overall fuel-lean mixture) for all fuels at 20.95% intake O2 concentration, and decreased with EGR to ∼1 at intake O2 concentrations close to 9% O2. The combustion phasing (the crank angle corresponding to 50% heat release, CA50) was held constant at 5 crank angle degrees (CAD) after top dead center (ATDC) by changing the start of injection (SOI) timing. For the engines used in the present study, 5 CAD ATDC is near to the optimum condition for most operating conditions where maximum efficiency and lower emissions can be achieved (Shukla et al. Citation2018). The engines were equipped with an XPI common rail injection system with a 10-hole and 148° spray angled injector. A single fuel injection was applied in each combustion stroke and the start of injection was retarded (earlier injection) at increased EGR. The injection pressure was constant at 1200 bar and the engine speed at 1200 rpm.
2.3. Aerosol characterization
We derived absorption Ångström exponents (AAEs) by linear fitting of logarithmized aethalometer (AE33, Magee Scientific, Berkeley, CA, USA) absorption coefficients (babs, m−1) at all seven wavelengths in the interval 370–950 nm. Additionally, AAEs were determined by linear fitting of logarithmized absorption data at wavelengths in the 660–950 nm interval. The AE33 measures attenuation of light through a filter medium onto which particles are sampled. The measured attenuation in the AE33 is converted to absorption coefficients and equivalent BC after being corrected for scattering, filter loading and filter artifacts (Drinovec et al. Citation2015). The scattering correction factor depends on filter material and does not change significantly with wavelength. In our previous study Török et al. (Citation2018), we showed that AAEs derived from in-situ extinction measurements and the AE33 agreed well (linear regression model with R2 = 0.94 and slope close to unity). The largest deviations were found for the mature soot and for very high mass concentrations sampled by the AE33, something that was avoided here by using a higher dilution ratio. The reason for the good agreement between the two attenuation based methods was likely due to all sampled particles being solid soot aggregates with small (<35 nm) primary particles. This indicates that scattering artifacts and artifacts from filter absorption of liquid aerosols were minor. The particle properties of the diesel soot emissions studied here are similar to the miniCAST emissions in these respects (Gren et al. Citation2020).
The AAE is proportional to the absorption ratio of different wavelengths, and is a parametrization of the spectral dependence of the mass-specific absorption coefficient. Interpolating the absorption data within the aethalometer wavelength interval (370–950 nm) allowed for the estimation of optical band gaps using Tauc analysis. The Tauc analysis was performed assuming a direct allowed transition and follows the method described by Botero et al. (Citation2016). This analysis produced optical band gap energies in a similar range to those reported by Miller et al. (Citation2013), and was used to estimate the conjugation length (La) of the soot PAHs.
A soot particle aerosol mass spectrometer (SP-AMS; Aerodyne Inc., Billerica, MA, USA) (Onasch et al. Citation2012) was used for on-line characterization of the soot particle chemical environment. To relate particle optical properties to its chemical characteristics we employed two related techniques built-in to the soot particle aerosol mass spectrometer. We employed standard thermal-desorption aerosol mass spectrometry to detect non-refractory organic aerosol components, including non-refractory 4–7 ring PAHs (Malmborg et al. Citation2017). In the standard aerosol mass spectrometer (AMS) (DeCarlo et al. Citation2006), particles are focused using an aerodynamic lens system and differential pumping into high vacuum (10−7 mbar) and onto a heated (600 °C) tungsten target where non-refractory aerosol components rapidly vaporize (Drewnick et al. Citation2005; DeCarlo et al. Citation2006). The vapors are subsequently ionized with electron ionization (70 eV) followed by detection of ions in a high-resolution time-of-flight mass spectrometer. IR-absorbing refractory aerosols such as soot were detected in the same SP-AMS system using an additional vaporization step, IR laser heating (Nd:YAG 1064 nm) followed by particle vaporization, ionization and detection (Onasch et al. Citation2012). The SP-AMS was calibrated according to the standard procedure using 300 nm DMA-selected ammonium nitrate particles and an ionization efficiency for non-refractory organic aerosol components relative NO3 (RIENO3) of 1.4, and 300 nm DMA-selected Regal Black (Cabot Inc., Boston, MA, USA) particles to determine relative ionization efficiencies of refractory BC particles relative to NO3 (RIEBC). The derived RIEBC were similar and ranged from 0.29–0.37 for all experiments with one exception; RIEBC was 0.58 for the diesel engine experiments conducted in 2016. In order to detect refractory large carbon clusters (Corbin et al. Citation2014; Onasch et al. Citation2015), the SP-AMS was tuned similarly as described in Malmborg et al. (Citation2019). Measurements on the miniCAST flame soot or aerosolized particles from fullerene soot standards can be used to evaluate the SP-AMS tuning between different experiments as demonstrated in chapter 3.2.1 of Malmborg (Citation2020).
2.4. Transmission electron microscopy (TEM) imaging and nanostructure analysis
The methods to collect soot from the miniCAST on TEM-grids and the nanostructure analysis of carbon-layer fringe length and tortuosity of these samples have been described previously (Malmborg et al. Citation2019). The same methods were here used to collect particles from the diesel engine operating on petroleum diesel at varying O2 levels (rounded to their nearest integer: 10%, 11%, 13%, 17%) and at 13% for HVO100 and RME100 (Gren et al. Citation2020). The soot particles were collected on lacey carbon-coated copper grids using a Nanometer Aerosol Sampler (model 3089, TSI Inc., MN, USA). A high-resolution transmission electron microscope at the national Center for High Resolution Electron Microscopy (nCHREM) in Lund, Sweden (HRTEM, JEOL 3000 F equipped with a Schottky FEG), operating at 300 kV was used to visualize carbon-layer fringes within the sampled soot particles, which were recorded using a Gatan 2kx2k CCD camera with an exposure time of 1–2 s. An overview of the samples was first imaged at 10.000x magnification in order to ensure that the sample was reasonable homogenous. Regions without overlapping structures were then chosen for a number (<10) of agglomerates for the fringe imaging at >300.000x magnification. The detailed internal patterns of nanoscale carbon layers were characterized at the University of New South Wales by post-processing the HRTEM images in a sequential image analysis to obtain key structure parameters such as the fringe length and tortuosity (the ratio between fringe length and the end-to-end distance). The image analysis procedure was adopted from Sakai et al. (Citation2012) and is well documented (Malmborg et al. Citation2019; Zhang et al. Citation2015; Zhang, Kim, et al. Citation2017a; Zhang, Zhang, et al. Citation2017b; Zhang et al. Citation2017c).
2.5. Thermal-optical analysis for organic and elemental carbon
The procedures and the results of the thermal optical analysis of Organic Carbon (OC) and Elemental Carbon (EC) for the miniCAST have been reported previously (Török et al. Citation2018; Malmborg et al. Citation2019). Here we also include OC and EC analysis for engine exhaust, at the same operating points as for the TEM analysis. Briefly, particles were collected on quartz filters (47 mm Pallflex Tissuequartz) and analyzed with a thermal optical analyzer (Model 2001, DRI, USA) using the EUSAAR_2 protocol (Cavalli et al. Citation2010). During the temperature ramping in the inert phase of the analysis, carbonization and/or annealing of the carbonaceous material to highly refractory pyrolytic carbon (PC) results in a darkening of the sample. The darkening is measured continuously with a laser and is used to derive PC and correct the masses assigned to EC and OC. Refractory OC was defined as the sum of OC4 (material evolving in an inert atmosphere above 450 °C) and PC.
3. Results and discussion
3.1. AAE vs. diesel engine intake O2 concentration and miniCAST N2 mixing flow
The diesel engine was operated with varied EGR level for Diesel, HVO100, RME100 and RME20 (). EGR is a common technique that reduces the O2 available for combustion and results in longer premixing times. EGR leads to reduced combustion temperatures and significantly lower formation of NOx (Figure SI1). The particle optical properties changed and AAE increased from values close to 1 up to ∼2.7 when EGR was increased from low to very high levels, corresponding to engine air intake O2 concentrations below ∼10%. AAE values were in general slightly above 1 for cases with O2 in the range 11.5% to 20%. At no EGR (21% O2) there was a larger scatter of the data (AAE 1.0–1.6). HVO showed slightly higher AAEs at O2 concentrations between 15 to 21% O2 compared to the other fuels.
Figure 1. Particle absorption Ångström exponents (AAE) with respect to the diesel engine intake O2 concentration (%), fueled with 80% diesel, HVO, RME, and a 20% RME and 80% diesel blend. Diesel and RME measurements include data from both 2016 and 2017 using the same engine but slightly modified sampling set-ups. Errorbars denote standard errors of the mean.
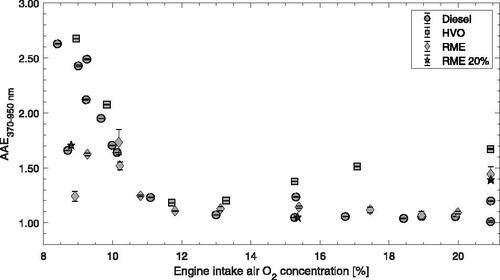
summarize the main observations of AAE for operational changes of the miniCAST and engine operating parameters that were used to control combustion temperatures. The miniCAST N2 mixing gas flow and the engine intake air O2 concentration are here used as proxies for combustion temperature. When combustion temperatures were high (low N2 mixing gas flow for miniCAST and high intake O2 concentration for engine), the particle AAEs were close to 1 and soot emissions showed typical BC characteristics. When the combustion temperatures were reduced in the miniCAST, the AAE increased significantly above 1 and in the most extreme cases reached above 4 (). The diesel engine soot emissions showed a similar evolution in AAE when combustion temperatures were reduced (). These trends demonstrate a connection between the combustion temperature and BrC particle characteristics (i.e., AAEs >1).
The diesel engine soot did not reach the same maximum AAEs in comparison to those observed for the miniCAST, which likely reflects the differences in fuel, combustion characteristics, residence times, exhaust dilution and sampling. We previously reported a similar evolution of in-cylinder diesel engine soot (Malmborg et al. Citation2017). During combustion, the AAE of particles extracted from inside the cylinder evolved from elevated (>1.5) towards 1 with increased time in the hot in-cylinder environment, which means the soot evolved towards BC. A clear effect of intake O2 concentration was observed also for the in-cylinder soot, where a higher intake O2 (and thereby higher combustion temperatures) was associated with reduced AAEs early in the combustion cycle. This latter observation most likely reflects a faster maturation process at higher in-cylinder combustion temperatures.
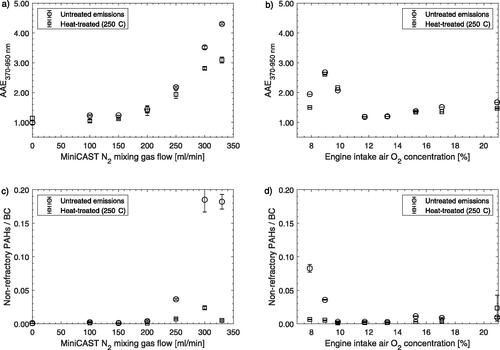
Figure 2. (a, b) Absorption Ångström exponents (AAE370–950 nm). (c, d) Ratios of non-refractory PAHs to equivalent BC. Data is shown for soot prior to (untreated emissions) and after heat-treating soot in a thermodenuder to 250 °C from the miniCAST (a, c) and diesel engine operating on HVO100 (b, d). Errorbars denote standard errors of the mean.
3.2. Removal of non-refractory soot components by evaporation in a Thermodenuder (TD)
The AMS (thermal desorption/vaporization at 600 °C) was used to investigate non-refractory organic particle components and PAHs. When combustion temperatures decreased and AAEs increased, non-refractory PAHs increased with respect to the observed equivalent BC for both the miniCAST and the diesel engine soot (). Increasing PAH emissions with respect to equivalent BC can be expected if reduced combustion temperatures result in a slower formation of incipient soot particles and thereby a reduced number of surfaces onto which PAHs can react with or adsorb onto. However, absolute PAH emissions and PAH composition are also likely to be influenced by combustion temperatures as was shown in our previous analysis (Gren et al. Citation2020) for a subset of the diesel engine data that is presented here. AMS mass spectra of particle phase PAHs for high temperature (17% O2 and OP3) and low temperature (9.8% O2 and OP7), for the diesel engine and miniCAST respectively, have been included in the SI (Figure SI2). For both sources, low temperature combustion resulted in soot with a wide distribution of larger PAHs, while for high temperature combustion PAHs with a nominal mass of 202 Da (C16H10+) completely dominated the PAH distribution. In mass spectra from low temperature combustion the most intense PAH signal was instead found at m/z 226 (C18H10+).
A TD (250 °C and time scales between 5–10 s) was employed for a subset of the experiments to remove non-refractory aerosols by evaporation. In , this TD data is denoted as “heat-treated emissions” and was compared to non-treated, denoted “untreated emissions.” Heat-treating the aerosols had negligible impact on AAEs if these were already close to 1. For higher AAEs heat-treating and removal of volatile material were associated with slightly reduced AAEs (). and show that the majority of the non-refractory PAHs were removed after heat-treating the aerosols, which suggests that PAHs had limited influence on the light absorption wavelength dependence even for the soot with highest AAEs prior to heat-treating.
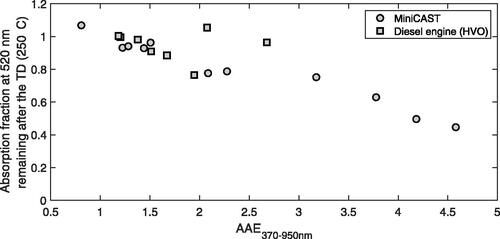
An estimate of the total light absorption fraction (at a wavelength of 520 nm) remaining after the removal of non-refractory organic components in the TD at 250 °C is shown in . Particle losses in the TD were in this analysis accounted for by normalizing the ratio of absorption coefficients (babs) at 520 nm to the ratio of babs at 950 nm according to EquationEquation (1)(1)
(1) .
(1)
(1)
shows that the contribution to light absorption at 520 nm from the components evaporated in the TD increased with increasing AAE, but was minor (<25%) for AAEs lower than 3. For an AAE above 3, light absorption by non-refractory organic components was significant, and even dominated (55%) the light absorption at 520 nm for the soot with the highest original AAE (4.6). The absorption fraction that remained after the TD represents the estimated contribution to light absorption principally by refractory aerosol components indeterminable by thermal desorption (600 °C) aerosol mass spectra.
Figure 3. The 520 nm light absorption fraction remaining after the removal of non-refractory organic particle components in a Thermodenuder (TD) at 250 °C. Particle losses in the TD (ranging from 15 to 45%) were compensated for by normalizing the absorption fraction at 520 nm to the BC light absorption fraction at 950 nm (EquationEquation (1)(1)
(1) ). Data from the miniCAST and the diesel engine fueled with HVO.
The elevated AAEs (≫1) after heat-treating also after removal of non-refractory aerosol components indicate that non-refractory organic aerosols, including PAH components, could only account for a minor fraction of the BrC characteristics of these soot emissions. Observations of low volatility organic components persistent after heat-treating (300–600 °C) and with BrC absorption characteristics have previously been reported for laboratory flame soot by e.g., Maricq (Citation2014) and Saleh et al. (Citation2014, Citation2018). We here demonstrate a similar feature in a real-world heavy-duty diesel engine operated with different fuels. It thus appears to exist an important and strong connection between elevated AAEs, reduced combustion temperatures, and soot components which are significantly less volatile than the non-refractory PAHs observed in thermal desorption (600 °C) aerosol mass spectra.
3.3. AAE in different wavelength intervals
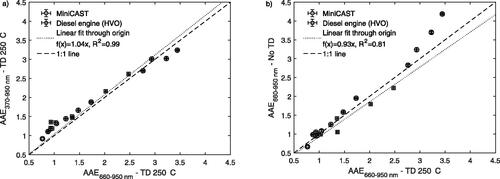
The absorption measurements at seven wavelengths allowed us to evaluate AAEs in different wavelength intervals. The high optical band gap energies (Menon et al. Citation2019) and absorption spectra (Huisken et al. Citation2013) associated with non-refractory PAHs observed in the AMS (mainly PAHs with molecular masses of 202–300 Da) suggested that the non-refractory components that were removed in the TD would have only a minor contribution to absorption at wavelengths longer than 660 nm. Therefore, AAEs were evaluated in two wavelength intervals: the full 370–950 nm wavelength interval (AAE370–950 nm) and for the 660–950 nm wavelength interval (AAE660–950 nm). A comparison between AAE370–950 nm and AAE660–950 nm is shown in . For the denuded soot, estimates of the AAEs were similar (r = 0.99) independent on which wavelength interval was used (). In other words, it does not seem to matter if short wavelengths are included in the AAE calculation of the denuded (at 250 °C) soot. This suggests that the components that had important contribution to light absorption at short wavelengths were removed by the TD (250 °C), and that the remaining components had light absorption that extends well beyond 660 nm. It should be noted that for AAEs lower than 2, the AAE660–950 nm were consistently lower than the AAE370–950 nm. To illustrate how the AAE660–950 nm was affected by the removal of non-refractory components, the AAE660–950 nm derived prior to and after the TD are compared in . shows that heating the aerosol in the TD (250 °C) had an effect on AAE660–950 nm for the high values (>2.5 before the TD). For these highest AAEs, the AAE660–950 nm before the TD was significantly higher than the AAE660–950 nm after the TD. The purpose of defining AAEs for two different wavelength intervals was to isolate the effects on light absorption by refractory soot components from the effects that originated from non-refractory organic components with negligible light absorption at longer wavelengths, such as non-refractory PAHs. The analysis shown in suggests that this procedure was associated with an increasing error for AAE660–950 nm above 2.5.
Figure 4. (a) AAE370–950 nm vs. AAE660–950 nm for denuded (250 °C) soot (Pearson correlation, r = 0.99). (b) AAE660–950 nm for the diluted raw exhaust soot vs. AAE660–950 nm for the denuded (250 °C) soot (r = 0.90).
3.4. AAE vs. soot nanostructure and refractory organic soot components
Geometric mean fringe lengths were derived from the distribution of fringes obtained from HRTEM images of soot collected with an electrostatic precipitator and subsequent image analysis of the soot nanostructure. The data from the miniCAST have been reported previously (Malmborg et al. Citation2019) and shows that fringe lengths were shorter for immature soot and reduced combustion temperatures. Slightly longer fringe lengths were observed for the diesel engine emissions compared to the miniCAST emissions. AAE660–950 nm is plotted against fringe lengths derived from the HRTEM analysis in .
The power law fit to data shows that AAE660–950 nm was closely related to the fringe length (R2 = 0.89). This correlation strongly supports our notion that the BrC absorption characteristics were related to refractory soot components, specifically to the size of refractory aromatic units as discussed below. An analysis of the relationship between AAE (defined in the 660–950 nm interval) and measured fringe tortuosity (a measure of the curvature of aromatic layers) showed that this measure also correlates with AAE (r = 0.73) and can be estimated with a power law dependence (R2 = 0.79) shown in Figure SI3a (SI). A strong correlation (r = 0.69) was found between tortuosity and fringe length for the investigated samples. Because the two parameters were correlated, their independent effect on AAE cannot be fully determined. However, calculations of optical bandgaps for differently sized PAHs have shown a relatively small dependence on curvature (Menon et al. Citation2019). It is therefore more likely that the measured change in fringe length is the causal parameter describing the changes in AAE.
Figure 5. (a) Absorption Ångström exponents assessed in the wavelength interval 660–950 nm (AAE660–950 nm) vs. geometric mean fringe lengths from TEM analysis for miniCAST and diesel engine soot. (b) AAE660–950 nm vs. EC/(OC4 + PC + EC) from the thermal-optical carbon analysis. Refractory OC was defined as OC4 + PC. Diesel engine data is shown for petroleum MK1 diesel at 17%, 13% 10.6% and 9.8% O2, and renewable HVO and RME at 13% O2.
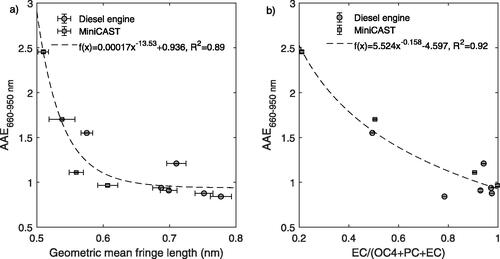
We additionally employed thermal-optical carbon analysis for the subset of miniCAST and diesel engine (HVO) samples for which the HRTEM analysis was conducted. shows AAE660–950 nm plotted against the elemental carbon (EC) fraction of refractory components ()). We define refractory OC as the sum of OC4 and PC. OC4 represents material evaporated at temperatures above 450 °C in inert He gas, and PC represents species that increased their absorption upon heating to 650 °C in inert gas but required O2 to finally be vaporized/oxidized. AAE660–950 nm versus EC/OC (where all OC classes were included) showed a weaker relationship, see SI (Figure SI3b). shows that AAEs decreased with increasing EC fraction (R2 = 0.92).
The data presented in suggest that refractory OC components were responsible for the BrC absorption characteristics. However, refractory OC components can have a wide spread in both absorption wavelength dependence and absorption efficiency (or mass specific absorption cross section), and these are inversely related to each other (Saleh, Cheng, and Atwi Citation2018; Cheng et al. Citation2019). Bescond et al. (Citation2016), while using different operating settings, showed that light absorption of miniCAST soot increased at short wavelengths, and decreased at longer wavelengths with increasing OC fraction. The underlying cause of the relationship between AAEs and the OC fraction of refractory carbon is therefore determined by both the mass fraction of absorbing OC and the absorption properties of this material. It appears likely that for these samples the increased fraction of refractory OC was directly related to an increasing amount of small aromatic soot units and the decreasing average fringe length determined by the HRTEM analysis, which was also identified by Bescond et al. (Citation2016). It should be noted that other physical factors that may influence absorption properties, such as the particle morphology, have not been considered. Based on our previous results (Török et al. Citation2018) we do not, however, expect the AAE to be contingent on or significantly biased by mobility diameter, lensing or scattering by non-refractory organic coatings, nor changes in soot fractal morphology.
The HRTEM analysis of fringe length was only conducted for a limited number of soot aerosols and combustion conditions. TEM images can be found in Malmborg et al. (Citation2019) and Gren et al. (Citation2020). We recently reported that the ratio of refractory large carbons () to the total refractory carbon cluster signal intensity (
) in the analysis of SP-AMS (IR laser heating/vaporization) data is closely related to both the fringe length and the refractory OC content (Malmborg et al. Citation2019). We here choose to present the effect on refractory aerosol components by introducing the parameter
the ratio of refractory
clusters (proxy for graphitic-like, mature carbonaceous soot components (Onasch et al. Citation2015)) to the sum of all other detected refractory carbon clusters between
(EquationEquation (2)
(2)
(2) ).
(2)
(2)
The
ratio presented here showed a nearly linear dependence to the geometric mean fringe lengths (Figure SI4, SI).
(and the focus on the C3+ ion) was chosen after consideration of the contribution to
from fragmentation of especially midcarbons (
) (Malmborg et al. Citation2019), and the previously reported positive correlation between the
ratio and less mature soot (Corbin et al. Citation2014). A lower
thus corresponds to an increased signal from refractory large carbon clusters and low carbon clusters related to immature soot. A visualization of refractory
mass spectra and different
values can be found in Figure SI5 (SI).
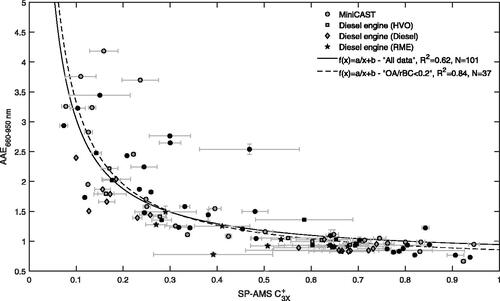
The SP-AMS parameter displayed a clear and decreasing trend with increasing AAE660–950 nm (). The relation was most pronounced at AAEs in the range of 1–2, and the
changed little with AAEs above ∼2. This may indicate the presence of additional particle components at AAE > 2 which the
parameter does not represent well. It may also suggest that AAE660–950 nm is not always a valid model for determining the AAE of refractory soot components, and can have a contribution from components that evaporate at 250 °C as was indicated in (for AAE > 3). A graph displaying refractory
with respect to combustion conditions is available in the SI (Figure SI6).
Figure 6. Refractory (EquationEquation (2)
(2)
(2) ) vs. AAE660–950 nm. The
parameter was determined using laser heating/vaporization aerosol mass spectrometry from analysis of the refractory carbon cluster distribution in SP-AMS aerosol mass spectra. Gray markers show data sampled for fresh emissions, and data retrieved after heat-treating (∼250 °C) are shown as black markers. Fits of the form
were evaluated for all data points (R2 = 0.62) and for data with an OA to rBC ratio lower than 0.2 (R2 = 0.84). Errorbars denote standard errors of the mean.
3.5. Optical band gap and refractory SP-AMS analysis
Optical band gap theory suggests that we may consider absorption of the refractory particle components to be determined by the size of polycyclic aromatic units (Menon et al. Citation2019). The relationships found between AAE and fringe length (), and AAE and () support that the light absorption wavelength dependence of soot depends on the size of refractory aromatic units in the soot particle. The upper limit for the AAE of refractory soot components will thus be determined by the smallest stable clusters present in the incipient soot particles.
Optical band gaps were here derived using Tauc/Davis-Mott analysis (Tauc, Grigorovici, and Vancu Citation1966; Davis and Mott Citation1970). Tauc-plots were generated by plotting photon energies (hv) against where α is the absorption coefficient obtained from interpolating between the absorption coefficients derived from the 7 aethalometer LEDs. In the derivation of optical band gaps we have, similar to Botero et al. (Citation2016), assumed a direct transition and an r value of 0.5. To derive optical band gaps (
) for our data, normalized absorption spectra in the 440–880 nm interval were generated from the AAE660–950 nm. Linear least-square fittings were evaluated at energies corresponding to wavelengths between 440 to 540 nm, and the optical band gap was determined from extrapolating the linear fit to
(Figure SI7, SI).
The optical band gaps were evaluated for the same data as shown in , and ranged from 1.77–2.28 eV (). This range is similar to optical band gap energies reported for immature to mature soot as a function of height above the burner in other studies on the optical properties of soot in flames (Miller et al. Citation2013; Adkins and Miller Citation2015; Botero et al. Citation2016).
Figure 7. (a) Absorption Ångström exponents AAE660–950 nm vs. the derived optical band gap energies (). (b) Refractory
vs. the estimated conjugation length of aromatic clusters (La) in refractory soot components obtained using the optical band gaps and EquationEquation (2)
(2)
(2) . Gray markers denote “untreated” samples and black markers denote “heat-treated” (∼ 250 °C) samples. Errorbars denote standard errors of the mean.
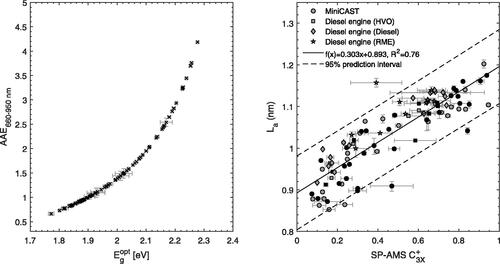
On a theoretical basis, Robertson and O'Reilly (Citation1987) established that the optical band gap of amorphous carbon materials is inversely related to the square root of the number of aromatic rings in graphitic clusters (i.e., refractory aromatic units). Because the number of aromatic rings in a PAH scales to the square root of its diameter, the band gap is closely related to the conjugation length of aromatic clusters (La) and the fringe length (Ferrari and Robertson Citation2000). Derived optical band gap energies versus fringe length and tortuosity are illustrated in Figure S8 (SI). As an independent test of the connection between SP-AMS and the size of refractory aromatic units, La was calculated from the derived optical band gaps and the relationship obtained by Miller et al. (Citation2013) and Botero et al. (Citation2016) (EquationEquation (3)
(3)
(3) ).
(3)
(3)
The relationship between and the qualitative estimate of La is presented in . The data illustrates an approximately linear relationship between
and La (R2 = 0.76). The linearity of the relationship was weaker for small
(<0.2). The cause for this discrepancy may originate from an increasing contribution to light absorption by non-refractory organics. Because
only accounts for refractory constituents, a change in the optical band gap that results from non-refractory organic compounds is not related to a change in
For reference, an AAE of 2.1 (Schnaiter et al. Citation2003) was found for spark discharge soot with highly amorphous carbon nanostructure characterized by short fringe lengths (Wentzel et al. Citation2003). Because the spark discharge soot did not contain traditional “organic” carbon that forms in combustion, their study shows that high AAEs can result from disordered soot nanostructures. shows that
was approximately 0.15–0.2 for AAE = 2.1. This supports that a further decrease in La (or increase in the optical band gap) below
was driven mainly by an increasing OC content of non-refractory PAHs, which were primarily found in the 202–300 Da range and thus containing 4–7 aromatic rings.
The similarities of immature soot properties across combustion sources and fuels may also have implications for health impacts of BrC emissions. For example for the same engine, our group recently showed that the efficiency per mass unit of particle emissions to form reactive oxygen species (ROS) decreased strongly with decreasing combustion temperatures (Gren et al. Citation2020). Stoeger et al. (Citation2009) found a similar tendency by showing that the oxidative potential (closely related to ROS) was significantly lower for high OC “brown” soot from the miniCAST compared to mature “black” soot from the miniCAST.
4. Conclusions
We investigated effects on the BC or BrC characteristics of soot when altering combustion parameters that control combustion temperatures in two different systems: a miniCAST soot generator and a modern heavy-duty diesel engine that was fueled with petroleum diesel, renewable HVO and RME. We show that for the tested conditions, BrC absorption at AAEs below 2.5 was dominated by refractory components that did not evaporate in the thermodenuder (250 °C). Modifying combustion parameters to reduce combustion temperatures was qualitatively associated with:
an increasing AAE and a regression from BC dominated to BrC dominated light absorption
an increase in the fraction of non-refractory polycyclic aromatic hydrocarbons (PAHs)
an increase in the refractory OC mass fraction (thermal-optical OC/EC analysis)
an increasing signal from large carbon clusters (lower
) and altered carbon cluster distributions in refractory aerosol mass spectra
an altered soot nanostructure with reduced fringe lengths and increased tortuosity (HRTEM).
The refractory analysis from laser heating/vaporization aerosol mass spectrometry enables highly time-resolved studies of key parameters linked to the evolution of refractory soot components in combustion processes. Due to the difficulty of identifying refractory organic components, such techniques are of paramount importance for separating health- and climate-related effects relating to non-refractory and refractory soot components.
For soot exposed to higher temperatures the carbon nanostructure evolves by growth of aromatic clusters, which can be monitored on-line using the refractory analysis. Our data, in line with the literature (Minutolo, Gambi, and D’Alessio Citation1996; Bond Citation2001; Cheng et al. Citation2019), shows that this growth of aromatic clusters results in a lower optical band gap and consequently a lower AAE. Our results therefore give strong support for the hypothesis of a brown-black absorption continuum posited by Saleh, Cheng, and Atwi (Citation2018), in which BrC characteristics in combustion emissions can be attributed to refractory and non-refractory carbonaceous material that formed in the flame environment but did not fully mature to BC. In fact, our analysis suggests that the majority of light absorption variability in the produced soot was due to such “continuum” absorption, and caused by differences in the size distribution of refractory aromatic units present in the carbon nanostructure.
This study highlights the importance of refractory BrC components in combustion emissions with AAE < 2.5. Contrary to BrC chromophores in organic aerosol emissions (e.g., PAHs), the refractory BrC from combustion processes is, in a similar way to the refractory BC, likely persistent to changes due to atmospheric processing. Therefore, understanding the relative role of carbon nanostructure and its dependence on combustion temperature and residence times could result in a more informed use of BrC for PM source attribution and health-risk assessments of combustion emissions.
Supplemental Material
Download MS Word (1.7 MB)Acknowledgements
Pravesh Shukla is acknowledged for contributing to running the engine during one of the campaigns. Karin Loven is acknowledged for the OC/EC analysis of the engine exhaust particles
Additional information
Funding
References
- Adkins, E. M., and J. H. Miller. 2015. Extinction measurements for optical band gap determination of soot in a series of nitrogen-diluted ethylene/air non-premixed flames. Physical Chemistry Chemical Physics 17 (4):2686–95. doi:https://doi.org/10.1039/C4CP04452E.
- Andreae, M. O., and A. Gelencsér. 2006. Black carbon or brown carbon? The nature of light-absorbing carbonaceous aerosols. Atmospheric Chemistry and Physics 6 (10):3131–48. doi:https://doi.org/10.5194/acp-6-3131-2006.
- Apicella, B., M. Alfè, R. Barbella, A. Tregrossi, and A. Ciajolo. 2004. Aromatic structures of carbonaceous materials and soot inferred by spectroscopic analysis. Carbon 42 (8–9):1583–9. doi:https://doi.org/10.1016/j.carbon.2004.02.010.
- Bescond, A., J. Yon, F. X. Ouf, C. Rozé, A. Coppalle, P. Parent, D. Ferry, and C. Laffon. 2016. Soot optical properties determined by analyzing extinction spectra in the visible near-UV: Toward an optical speciation according to constituents and structure. Journal of Aerosol Science 101:118–32. doi:https://doi.org/10.1016/j.jaerosci.2016.08.001.
- Bond, T. C. 2001. Spectral dependence of visible light absorption by carbonaceous particles emitted from coal combustion. Geophysical Research Letters 28 (21):4075–8. doi:https://doi.org/10.1029/2001GL013652.
- Bond, T. C., and R. W. Bergstrom. 2006. Light absorption by carbonaceous particles: An investigative review. Aerosol Science and Technology 40 (1):27–67. doi:https://doi.org/10.1080/02786820500421521.
- Bond, T. C., S. J. Doherty, D. W. Fahey, P. M. Forster, T. Berntsen, B. J. DeAngelo, M. G. Flanner, S. Ghan, B. Kärcher, D. Koch, et al. 2013. Bounding the role of black carbon in the climate system: A scientific assessment. Journal of Geophysical Research: Atmospheres 118 (11):5380–552. doi:https://doi.org/10.1002/jgrd.50171.
- Botero, M. L., E. M. Adkins, S. González-Calera, H. Miller, and M. Kraft. 2016. PAH structure analysis of soot in a non-premixed flame using high-resolution transmission electron microscopy and optical band gap analysis. Combustion and Flame 164:250–8. doi:https://doi.org/10.1016/j.combustflame.2015.11.022.
- Cavalli, F., M. Viana, K. E. Yttri, J. Genberg, and J. P. Putaud. 2010. Toward a standardised thermal-optical protocol for measuring atmospheric organic and elemental carbon: the EUSAAR protocol. Atmospheric Measurement Techniques 3 (1):79–89. doi:https://doi.org/10.5194/amt-3-79-2010.
- Chakrabarty, R. K., H. Moosmüller, L. W. A. Chen, K. Lewis, W. P. Arnott, C. Mazzoleni, M. K. Dubey, C. E. Wold, W. M. Hao, and S. M. Kreidenweis. 2010. Brown carbon in tar balls from smoldering biomass combustion. Atmospheric Chemistry and Physics 10 (13):6363–70. doi:https://doi.org/10.5194/acp-10-6363-2010.
- Cheng, Z., K. Atwi, T. Onyima, and R. Saleh. 2019. Investigating the dependence of light-absorption properties of combustion carbonaceous aerosols on combustion conditions. Aerosol Science and Technology 53 (4):419–34. doi:https://doi.org/10.1080/02786826.2019.1566593.
- Chung, C. E., V. Ramanathan, and D. Decremer. 2012. Observationally constrained estimates of carbonaceous aerosol radiative forcing. Proceedings of the National Academy of Sciences of the United States of America 109 (29):11624–9. doi:https://doi.org/10.1073/pnas.1203707109.
- Corbin, J. C., B. Sierau, M. Gysel, M. Laborde, A. Keller, J. Kim, A. Petzold, T. B. Onasch, U. Lohmann, and A. A. Mensah. 2014. Mass spectrometry of refractory black carbon particles from six sources: carbon-cluster and oxygenated ions. Atmospheric Chemistry and Physics 14 (5):2591–603. doi:https://doi.org/10.5194/acp-14-2591-2014.
- Davis, E. A., and N. F. Mott. 1970. Conduction in non-crystalline systems V. conductivity, optical absorption and photoconductivity in amorphous semiconductors. The Philosophical Magazine: A Journal of Theoretical Experimental and Applied Physics 22 (179):0903–22. doi:https://doi.org/10.1080/14786437008221061.
- DeCarlo, P. F., J. R. Kimmel, A. Trimborn, M. J. Northway, J. T. Jayne, A. C. Aiken, M. Gonin, K. Fuhrer, T. Horvath, K. S. Docherty, et al. 2006. Field-deployable, high-resolution, time-of-flight aerosol mass spectrometer. Analytical Chemistry 78 (24):8281–9. doi:https://doi.org/10.1021/ac061249n.
- Drewnick, F., S. S. Hings, P. DeCarlo, J. T. Jayne, M. Gonin, K. Fuhrer, S. Weimer, J. L. Jimenez, K. L. Demerjian, S. Borrmann, et al. 2005. A new time-of-flight aerosol mass spectrometer (TOF-AMS)—Instrument description and first field deployment. Aerosol Science and Technology 39 (7):637–58. doi:https://doi.org/10.1080/02786820500182040.
- Drinovec, L., G. Močnik, P. Zotter, A. S. H. Prévôt, C. Ruckstuhl, E. Coz, M. Rupakheti, J. Sciare, T. Müller, A. Wiedensohler, et al. 2015. The "dual-spot" Aethalometer: an improved measurement of aerosol black carbon with real-time loading compensation. Atmospheric Measurement Techniques 8 (5):1965–79. doi:https://doi.org/10.5194/amt-8-1965-2015.
- Ferrari, A. C., and J. Robertson. 2000. Interpretation of Raman spectra of disordered and amorphous carbon. Physical Review B 61 (20):14095–107. doi:https://doi.org/10.1103/PhysRevB.61.14095.
- Gren, L., V. B. Malmborg, N. R. Jacobsen, P. C. Shukla, K. M. Bendtsen, A. C. Eriksson, Y. J. Essig, A. M. Krais, K. Loeschner, S. Shamun, et al. 2020. Effect of renewable fuels and intake O2 concentration on diesel engine emission characteristics and reactive oxygen species (ROS) formation. Atmosphere 11 (6):641. doi:https://doi.org/10.3390/atmos11060641.
- Gustafsson, Ö., and V. Ramanathan. 2016. Convergence on climate warming by black carbon aerosols. Proceedings of the National Academy of Sciences of the United States of America 113 (16):4243–5. doi:https://doi.org/10.1073/pnas.1603570113.
- Huang, C.-H., and R. L. Vander Wal. 2016. Partial premixing effects upon soot nanostructure. Combustion and Flame 168:403–8. doi:https://doi.org/10.1016/j.combustflame.2016.01.006.
- Huisken, F., G. Rouillé, M. Steglich, Y. Carpentier, C. Jäger, and T. Henning. 2013. Laboratory studies on the role of PAHs as DIB carriers. Proceedings of the International Astronomical Union 9 (S297):265–75. doi:https://doi.org/10.1017/S1743921313015974.
- Johansson, K. O., M. P. Head-Gordon, P. E. Schrader, K. R. Wilson, and H. A. Michelsen. 2018. Resonance-stabilized hydrocarbon-radical chain reactions may explain soot inception and growth. Science 361 (6406):997–1000. doi:https://doi.org/10.1126/science.aat3417.
- Kholghy, M. R., A. Veshkini, and M. J. Thomson. 2016. The core–shell internal nanostructure of soot – A criterion to model soot maturity. Carbon 100:508–36. doi:https://doi.org/10.1016/j.carbon.2016.01.022.
- Laskin, A., J. Laskin, and S. A. Nizkorodov. 2015. Chemistry of atmospheric brown carbon. Chemical Reviews 115 (10):4335–82. doi:https://doi.org/10.1021/cr5006167.
- Lewtas, J. 2007. Air pollution combustion emissions: Characterization of causative agents and mechanisms associated with cancer, reproductive, and cardiovascular effects. Mutation Research 636 (1–3):95–133. doi:https://doi.org/10.1016/j.mrrev.2007.08.003.
- López-Yglesias, X., P. E. Schrader, and H. A. Michelsen. 2014. Soot maturity and absorption cross sections. Journal of Aerosol Science 75:43–64. doi:https://doi.org/10.1016/j.jaerosci.2014.04.011.
- Malmborg, V. 2020. Characteristics of particulate emissions from low temperature combustion and renewable fuels: Aerosol mass spectrometry of refractory carbonaceous particles. Doctoral Thesis, Lund University, 96.
- Malmborg, V. B., A. C. Eriksson, M. Shen, P. Nilsson, Y. Gallo, B. Waldheim, J. Martinsson, O. Andersson, and J. Pagels. 2017. Evolution of in-cylinder diesel engine soot and emission characteristics investigated with online aerosol mass spectrometry. Environmental Science & Technology 51 (3):1876–85. doi:https://doi.org/10.1021/acs.est.6b03391.
- Malmborg, V. B., A. C. Eriksson, S. Török, Y. Zhang, K. Kling, J. Martinsson, E. C. Fortner, L. Gren, S. Kook, T. B. Onasch, et al. 2019. Relating aerosol mass spectra to composition and nanostructure of soot particles. Carbon 142:535–46. doi:https://doi.org/10.1016/j.carbon.2018.10.072.
- Maricq, M. M. 2014. Examining the relationship between black carbon and soot in flames and engine exhaust. Aerosol Science and Technology 48 (6):620–9. doi:https://doi.org/10.1080/02786826.2014.904961.
- Menon, A., J. A. H. Dreyer, J. W. Martin, J. Akroyd, J. Robertson, and M. Kraft. 2019. Optical band gap of cross-linked, curved, and radical polyaromatic hydrocarbons. Physical Chemistry Chemical Physics 21 (29):16240–51. doi:https://doi.org/10.1039/C9CP02363A.
- Miller, J. H., J. D. Herdman, C. D. O. Green, and E. M. Webster. 2013. Experimental and computational determinations of optical band gaps for PAH and soot in a N2-diluted, ethylene/air non-premixed flame. Proceedings of the Combustion Institute 34 (2):3669–75. doi:https://doi.org/10.1016/j.proci.2012.05.054.
- Minutolo, P., G. Gambi, and A. D’Alessio. 1996. The optical band gap model in the interpretation of the UV-visible absorption spectra of rich premixed flames. Symposium (International) on Combustion 26 (1):951–7. doi:https://doi.org/10.1016/S0082-0784(96)80307-9.
- Onasch, T. B., E. C. Fortner, A. M. Trimborn, A. T. Lambe, A. J. Tiwari, L. C. Marr, J. C. Corbin, A. A. Mensah, L. R. Williams, P. Davidovits, et al. 2015. Investigations of SP-AMS carbon ion distributions as a function of refractory black carbon particle type. Aerosol Science and Technology 49 (6):409–22. doi:https://doi.org/10.1080/02786826.2015.1039959.
- Onasch, T. B., A. Trimborn, E. C. Fortner, J. T. Jayne, G. L. Kok, L. R. Williams, P. Davidovits, and D. R. Worsnop. 2012. Soot Particle Aerosol Mass Spectrometer: Development, Validation, and Initial Application. Aerosol Science and Technology 46 (7):804–17. doi:https://doi.org/10.1080/02786826.2012.663948.
- Peng, J., M. Hu, S. Guo, Z. Du, J. Zheng, D. Shang, M. Levy Zamora, L. Zeng, M. Shao, Y.-S. Wu, J. Zheng, et al. 2016. Markedly enhanced absorption and direct radiative forcing of black carbon under polluted urban environments. Proceedings of the National Academy of Sciences of the United States of America 113 (16):4266–71. doi:https://doi.org/10.1073/pnas.1602310113.
- Petzold, A., J. A. Ogren, M. Fiebig, P. Laj, S. M. Li, U. Baltensperger, T. Holzer-Popp, S. Kinne, G. Pappalardo, N. Sugimoto, et al. 2013. Recommendations for reporting "black carbon" measurements. Atmospheric Chemistry and Physics 13 (16):8365–79. doi:https://doi.org/10.5194/acp-13-8365-2013.
- Robertson, J., and E. P. O’Reilly. 1987. Electronic and atomic structure of amorphous carbon. Physical Review B 35 (6):2946–57. doi:https://doi.org/10.1103/PhysRevB.35.2946.
- Roden, C. A., T. C. Bond, S. Conway, and A. B. O. Pinel. 2006. Emission factors and real-time optical properties of particles emitted from traditional wood burning cookstoves. Environmental Science & Technology 40 (21):6750–7. doi:https://doi.org/10.1021/es052080i.
- Sakai, M., I. Hiroki, K. Katsufumi, and A. Tetsuya. 2012. Nanostructure analysis of primary soot particles directly sampled in diesel spray flame via HRTEM. SAE Technical Paper 2012-01-1722. doi:https://doi.org/10.4271/2012-01-1722.
- Saleh, R., Z. Cheng, and K. Atwi. 2018. The Brown–Black continuum of light-absorbing combustion aerosols. Environmental Science & Technology Letters 5 (8):508–13. doi:https://doi.org/10.1021/acs.estlett.8b00305.
- Saleh, R., E. S. Robinson, D. S. Tkacik, A. T. Ahern, S. Liu, A. C. Aiken, R. C. Sullivan, A. A. Presto, M. K. Dubey, R. J. Yokelson, et al. 2014. Brownness of organics in aerosols from biomass burning linked to their black carbon content. Nature Geoscience 7 (9):647–50. doi:https://doi.org/10.1038/ngeo2220.
- Satoh, K., Z. Long, H. Hirokazu, T. Toshiaki, and Y. Katsuhiko. 1997. Relationship between NOx and SM emissions from DI diesel engine with EGR. JSAE Review 18 (4):369–75. doi:https://doi.org/10.1016/S0389-4304(97)00037-4.
- Schnaiter, M., H. Horvath, O. Möhler, K. H. Naumann, H. Saathoff, and O. W. Schöck. 2003. UV-VIS-NIR spectral optical properties of soot and soot-containing aerosols. Journal of Aerosol Science 34 (10):1421–44. doi:https://doi.org/10.1016/S0021-8502(03)00361-6.
- Schnaiter, M., C. Linke, O. Möhler, K.-H. Naumann, H. Saathoff, R. Wagner, U. Schurath, and B. Wehner. 2005. Absorption amplification of black carbon internally mixed with secondary organic aerosol. Journal of Geophysical Research 110 (D19204). doi:https://doi.org/10.1029/2005JD006046.
- Schnaiter, M., M. Gimmler, I. Llamas, C. Linke, C. Jäger, and H. Mutschke. 2006. Strong spectral dependence of light absorption by organic carbon particles formed by propane combustion. Atmospheric Chemistry and Physics 6 (10):2981–90. doi:https://doi.org/10.5194/acp-6-2981-2006.
- Shukla, P. C., S. Shamun, L. Gren, V. Malmborg, J. Pagels, and M. Tuner. 2018. Investigation of particle number emission characteristics in a heavy-duty compression ignition engine fueled with hydrotreated vegetable oil (HVO). SAE International Journal of Fuels and Lubricants 11 (4):495–505. doi:https://doi.org/10.4271/2018-01-0909.
- Sigsgaard, T., B. Forsberg, I. Annesi-Maesano, A. Blomberg, A. Bølling, C. Boman, J. Bønløkke, M. Brauer, N. Bruce, M.-E. Héroux, et al. 2015. Health impacts of anthropogenic biomass burning in the developed world. European Respiratory Journal 46 (6):1577–88. doi:https://doi.org/10.1183/13993003.01865-2014.
- Simonsson, J., N.-E. Olofsson, S. Török, P.-E. Bengtsson, and H. Bladh. 2015. Wavelength dependence of extinction in sooting flat premixed flames in the visible and near-infrared regimes. Applied Physics B 119 (4):657–67. doi:https://doi.org/10.1007/s00340-015-6079-z.
- Stoeger, T., S. Takenaka, B. Frankenberger, B. Ritter, E. Karg, K. Maier, H. Schulz, and O. Schmid. 2009. Deducing in vivo toxicity of combustion-derived nanoparticles from a cell-free oxidative potency assay and metabolic activation of organic compounds. Environmental Health Perspectives 117 (1):54–60. doi:https://doi.org/10.1289/ehp.11370.
- Tauc, J., R. Grigorovici, and A. Vancu. 1966. Optical properties and electronic structure of amorphous germanium. Physica Status Solidi (B) 15 (2):627–37. doi:https://doi.org/10.1002/pssb.19660150224.
- The Intergovernmental Panel on Climate Change (IPCC). 2013. Climate change 2013: The physical science basis. Contribution of Working Group I to the Fifth Assessment Report of the Intergovernmental Panel on Climate Change. Cambridge, UK; New York, NY: Cambridge University Press.
- Török, S., V. B. Malmborg, J. Simonsson, A. Eriksson, J. Martinsson, M. Mannazhi, J. Pagels, and P.-E. Bengtsson. 2018. Investigation of the absorption Ångström exponent and its relation to physicochemical properties for mini-CAST soot. Aerosol Science and Technology 52 (7):757–67. doi:https://doi.org/10.1080/02786826.2018.1457767.
- Wang, H. 2011. Formation of nascent soot and other condensed-phase materials in flames. Proceedings of the Combustion Institute 33 (1):41–67. doi:https://doi.org/10.1016/j.proci.2010.09.009.
- Wang, X., C. L. Heald, A. J. Sedlacek, S. S. de Sá, S. T. Martin, M. L. Alexander, T. B. Watson, A. C. Aiken, S. R. Springston, and P. Artaxo. 2016. Deriving brown carbon from multiwavelength absorption measurements: method and application to AERONET and Aethalometer observations. Atmospheric Chemistry and Physics 16 (19):12733–52. doi:https://doi.org/10.5194/acp-16-12733-2016.
- Wentzel, M., H. Gorzawski, K. H. Naumann, H. Saathoff, and S. Weinbruch. 2003. Transmission electron microscopical and aerosol dynamical characterization of soot aerosols. Journal of Aerosol Science 34 (10):1347–70. doi:https://doi.org/10.1016/S0021-8502(03)00360-4.
- Zhang, Y., R. Zhang, and S. Kook. 2015. Nanostructure analysis of in-flame soot particles under the influence of jetjet interactions in a light-duty diesel engine. SAE International Journal of Engines 8 (5):2213–26. doi:https://doi.org/10.4271/2015-24-2444.
- Zhang, Y., D. Kim, L. Rao, R. Zhang, S. Kook, K. S. Kim, and C.-B. Kweon. 2017a. The soot particle formation process inside the piston bowl of a small-bore diesel engine. Combustion and Flame 185:278–91. doi:https://doi.org/10.1016/j.combustflame.2017.07.028.
- Zhang, Y., Renlin Zhang, Lingzhe, R. Sanghoon. and K. 2017b. A comparison between in-flame and exhaust soot nanostructures in a light-duty diesel engine. SAE Technical Paper 2017-01-0710. doi:https://doi.org/10.4271/2017-01-0710.
- Zhang, Y., R. Zhang, L. Rao, D. Kim, and S. Kook. 2017c. The influence of a large methyl ester on in-flame soot particle structures in a small-bore diesel engine. Fuel 194:423–35. doi:https://doi.org/10.1016/j.fuel.2017.01.044.