
 ?Mathematical formulae have been encoded as MathML and are displayed in this HTML version using MathJax in order to improve their display. Uncheck the box to turn MathJax off. This feature requires Javascript. Click on a formula to zoom.
Abstract
The measurement of aerosol acidity is important to have a comprehensive understanding of aerosol chemistry, the adverse health effects of particulate matter, and climate. The Colorimetry Integrated with CAMera (CICAM) method is demonstrated to detect the color change of a filter (impregnated with an acid indicator), after the application of an acidic aerosol, using digital images. The CICAM images were analyzed by a computer program that employs the Matplotlib Library in python to decouple the camera image to the Red-Green-Blue (RGB) scale. The calibration of the CICAM method for the detection of proton concentration ([H+], mol L−1) in aerosol was performed with regard to the change of the G color component. The Colorimetry integrated with Reflective UV spectrometry (C-RUV) method that has recently been developed to detect [H+] in aerosol collected on a dyed filter using a micro-UV spectrometer can provide a lower uncertainty and a limit of detection that is an order of magnitude lower than the CICAM method, but is significantly more expensive. The CICAM method allows for the online detection of aerosol acidity utilizing a commercialized camera and LED light. The relationship between CICAM and C-RUV was also demonstrated by translating C-RUV spectral data into RGB values. Remarkably, the Green values measured by CICAM were statistically similar to the Green values obtained from C-RUV data. Therefore, we conclude that the CICAM and C-RUV method are comparable in their use for the prediction of proton concentration.
Copyright © 2021 American Association for Aerosol Research
EDITOR:
1. Introduction
Aerosol acidity has a wide-reaching set of impacts on aerosol chemistry, human health, and climate (Hallquist et al. Citation2009; Pye et al. Citation2020). The ability of increasing aerosol acidity to catalyze the formation of nonvolatile oligomeric products which increase secondary organic aerosols (SOA) has been well studied both in laboratory settings (Gao et al. Citation2004; Iinuma et al. Citation2009; Jang et al. Citation2002; Offenberg et al. Citation2009; Surratt et al. Citation2010; Surratt et al. Citation2007) and in the field (Rengarajan, Sudheer, and Sarin Citation2011). Aerosol acidity also has a significant impact on the physical state and phase in which aerosols exist in the atmosphere. When trace nutrients such as phosphorous, and trace metals such as iron and copper encounter acidic aerosols, their solubility has been shown to increase, which, in turn, increases the bioavailability of these materials (Meskhidze et al. Citation2003; Nenes et al. Citation2011). The increase in the bioavailability of these nutrients can have significant impacts on areas that would otherwise be nutrient poor, such as certain regions of the ocean (Ito and Shi Citation2016). The increased solubilization by acid aerosol also extends to some trace metals that are associated with negative impacts on human health (Chen and Lippmann Citation2009; Rohr and Wyzga Citation2012). Fang et al. (Citation2017) notes the specific connection that sulfate may have to adverse health effects, demonstrating “sulfate-driven metals dissolution” as a key factor for aerosol oxidative potential. In addition, the concentration of sulfuric acid is correlated to the formation of new particles (Weber et al. Citation1997; Weber et al. Citation1998) and influences climate by controlling cloud condensation nuclei activities of particulate matter. New particle formation by sulfuric acid is estimated to account for half of the cloud-forming particles present in the atmosphere (Gordon et al. Citation2017). Further understanding of atmospheric acidity is an important step that would inform strategies addressing the environmental and health effects of air pollution.
Traditionally, aerosol acidity has been measured using a pH meter (USEPA 1999) or ion chromatography (IC) coupled with an inorganic thermodynamic model. In these methods, aqueous extraction of an aerosol sample is required. For aerosol acidity measurements using a pH meter, inorganic species are dissolved in water and approaches an ideal solution. The acidity measured by the pH meter detects the total amount of H + associated with inorganic acids in the dilute solution. However, the actual bulk aerosol is a nonideal system because of a limited amount of water within the aerosol. In this highly concentrated aerosol system, not all the acid in the aerosol phase is dissociated, and thus the acidity of an aerosol is lower than that of an ideal solution (Li and Jang Citation2012). The impact of neutralization of acidic aerosol by ammonia during transportation can be mitigated by an online, in-situ method of aerosol acidity measurement. When acidic aerosol is titrated during the workup procedure and transportation, the inorganic aerosol mass (Minorg) can be slightly overestimated and slightly decrease the measured [H+] value; this reduction is trivial compared to the reduction of the measured [H+] value by using Ion Chromatography. Thus, the ability for the online detection of bulk aerosol acidity in the field is paramount in the continued expansion of current knowledge.
Though some methods for the online data collection of aerosol acidity are currently available, each have their own flaws. For example, a recent study implemented a method for in situ aerosol acidity measurements using “Colorimetry Integrated with a Reflectance UV-Visible spectrometer (C-RUV)” (Jang, Cao, and Paul Citation2008; Jang et al. Citation2020; Li and Jang Citation2012). The C-RUV method can deliver accurate results in a wide range of relative humidity (RH) values with high sensitivity. However, the use of an expensive Reflectance UV-Visible spectrometer can limit access to this technology which may hamper the expansion of knowledge. Cohen, Quant, and Donaldson (Citation2020) demonstrate a method in which they calculate the pH of a levitated droplet by injecting a pH indicator. This method also faces the same problem as the C-RUV method as it takes advantage of spectroscopy. The article by Craig et al. (Citation2018) implemented the use of a cellular phone camera, instead of a spectrometer, to take photos of pH indicator article on which acidic aerosol has been collected. Their method took advantage of a MATLAB script to interpret the red and green components of the photo to relay an associated acidity. They achieved promising results but were limited as laboratory testing was only performed at RH values of 90%. The article also includes ambient data at varying pH and RH values but their method was relatively insensitive compared to the C-RUV method, which meant that relatively large amounts aerosol (65 µg to 2.5 mg) had to be collected onto pH indicator article before meaningful data could be obtained. Li et al. (Citation2020) examined several pH-indicator papers for their effectiveness in a similar method using RGB values. The “Type V” article was found to accurately predict pH with an uncertainty of 0.5 units. However, this method also had the shortcomings of the previous one as 180 µg of ambient aerosol are required (estimated to take 1 to 4 h to collect).
This study addresses the problems present in current methods by integrating a commercialized camera into the C-RUV method while maintaining sensitivity and allowing for application in a wide RH range. The Colorimetry Integrated with CAMera (CICAM) method demonstrated in this study uses a python-based code to produce Red-Green-Blue (RGB) values of images of a filter impregnated with an acid indicator (metanil yellow) to calculate the acidity of the aerosols that were passed through the filter. To take advantage of the previously developed C-RUV methodology and calibration, a correlation is demonstrated between C-RUV data and the data collected with the CICAM method. This relation allows the equations used for the C-RUV method to be applied to the CICAM method with newly derived coefficients linked to the estimation of the concentration of proton ([H+], mol L−1 of inorganic aerosol).
2. Materials and method
2.1. CICAM Method
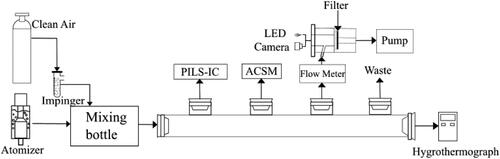
The CICAM method allows for the in-situ measurement of aerosol acidity using a camera with a given LED. A 7.0 mm diameter filter (Gelman Science Palflex, TX40H120-WW), impregnated with an aqueous solution of 0.02% metanil yellow (70% dye content, Sigma Aldrich) is used to collect acidic aerosol on the colorimetric filter. The details of the preparation of the filter impregnated with metanil yellow can be found in previous studies (Jang Citation2013; Jang, Cao, and Paul Citation2008; Li and Jang Citation2012). The CICAM device, as seen in , is located upstream of a sampling pump to collect acidic aerosol on the dyed filter. A camera (SEP32-S chip integrated with OV2640 camera) was used to take digital images of the filter to monitor the color change under a commercialized LED light (Jang and Yu Citation2019). These images are then analyzed by a computer program that employs the Matplotlib Library in python to determine differences in the RGB values of the images of the filter before and after the application of acidic aerosols (Hunter Citation2007).
Figure 1. Experimental setup for the flow tube used for the generation of acidic aerosols for the calibration of the CICAM method. Note that both the LED light and camera are found internally within CICAM device.
2.2. Calibration of CICAM method
Methodology used in this study for sample preparation for CICAM data closely resembles methodology detailed previously to produce the C-RUV method (Jang et al. Citation2020). C-RUV data that was previously reported by Jang et al. (Citation2020) were employed in this study to demonstrate the compatibility of C-RUV measurements with CICAM.
The accurate offline measurement of aerosol acidity can be hindered by the presence of gaseous chemicals when sampling and transferring aerosols (Jang et al. Citation2020). For example, acidic gas (i.e., nitric acid) and base gas (i.e., ammonia) can modulate aerosol acidity via neutralization. Some organic gases such as formaldehyde and acetaldehyde can react with sulfuric acid to reduce aerosol acidity. To maintain the integrity of results and prevent contamination, a flow tube under the clean air was used for the experiments using aerosols comprised of ammonium (NH4+) and sulfate (SO42-). The flow tube wall and sampling holder were cleaned with the deionized water (ASTM Type II, LapChem) and ethanol (spectral grade) before each experiment.
An atomizer (TSI 3076, MN, USA) was used to generate the aerosols and constantly release them into a 3 L mixing chamber. The clean air was passed through an impinger, containing deionized water, to produce humidified air. The humidified air was mixed with the aerosols inside the mixing chamber until desired RH values were reached. The air from the mixing chamber, containing the aerosols, was then released into the flow tube. A Particle-Into-Liquid Sampler (Applikon, ADI 2081), alongside ion chromatography (Metrohm, 761Compact IC) (PILS-IC), was used to determine aerosol inorganic compositions. An electronic hygrometer (Hanna Instruments, Italy) was used to measure the RH and Temperature of the flow tube. Non-refractory species (sulfate, nitrate, ammonium, chloride and organics) in submicron aerosol were measured in situ by using an Aerosol Chemical Speciation Monitor (ACSM, Aerodyne, MA, USA). ACSM spectra analysis was performed by using the standard ACSM analysis software (version: ACSM_local_1.6.0.0) provided by Aerodyne which was written within Wavemetrics Igor Pro. ACSM was utilized to estimate dry inorganic aerosol mass concentration (sulfate + ammonium ions, µg/m3) for CICAM. Aerosol density at specific RH values, and compositions, along with the water mass fraction of the total aerosol was predicted by the E-AIM inorganic thermodynamic model (Clegg, Brimblecombe, and Wexler Citation1998; Wexler and Clegg Citation2002). The aerosol was collected on the indicator-dyed filter using the pump downstream from the sampling holder. A sampling flow rate between 1-2 L min−1 was maintained to collect 0.5-5µg of particles. The flow rate, aerosol density, ACSM aerosol mass concentration, sampling time, and the predicted water mass fraction were used to calculate the particle dry mass on the filter.
3. Result and discussion
3.1. RGB scale from CICAM image
The RGB color model is one of the most well-known and widely used color systems. The RGB scale allows the color of the CICAM image to be mathematically quantified as three values representing red (R), green (G), and blue (B) colors. The intensity of the decoupled colors is related to [H+] in aerosol. The CICAM images of the dyed filters were converted to the RGB scale by using a computer program that employs features from the Matplotlib library in python to digitalize the filter color change (Hunter Citation2007). A certain number of pixels, which are homogeneous in color and has a certain level of brightness (not at edge of filter), were selected from the CICAM images prior to applying the python program (Figures S1A and S1B in the online supplemtnary information [SI]). In the RGB components, the green color showed the most drastic change as acidity increased because the color pink, associated with the chromophore color of the protonated indicator, on the filter is relayed in the RGB components primarily by a decrease in the G component. Therefore, the G component of the RGB scale was chosen to calibrate the CICAM method.
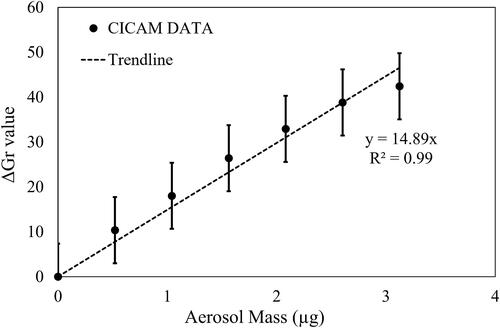
The difference in G values between the dyed filter before and after sampling acidic aerosol was taken to measure the quantity of protonated indicator (represented as ΔGr). These ΔGr values were plotted against the total aerosol mass of each set of aerosols at a given aerosol composition to test linearity of the CICAM method to the acidic aerosol mass. The composition of acidic inorganic aerosol was defined by the sulfate fraction (FS), the molar fraction of sulfate in the total concentration of water-soluble ions (i.e., sulfate, ammonium, and sodium). shows a strong linearity (R2 = 0.99) between ΔGr values and total aerosol mass ranging from 0 to 3.12 µg at FS = 0.84 and RH = 26%. The collection of a high aerosol mass of highly acidic aerosol is not recommended because it will cause the saturation of the dye impregnated in the filter.
Figure 2. CICAM generated ΔGr value versus total aerosol mass collected on the filter. The errors associated with ΔGr using CICAM was estimated by standard deviation and the T distribution value (90% confidence).
3.2. Calculation of proton concentration using RGB values
The equilibrium reaction between an indicator (In), in this case metanil yellow, and H+ can be expressed as follows (Jang, Cao, and Paul Citation2008):
(1)
(1)
where
is the indicator in protonated form. In the C-RUV technique that employed a micro-UV spectrometer, the concentration of unprotonated indicator (
) was detected at 420 nm for metanil yellow and that of protonated metanil yellow
) was at 545 nm. As discussed in the C-RUV method, the light absorption of
is different from that of
Thus, the relationship between
and
is written as:
(2)
(2)
where A545* is the absorbance at a given wavelength (545 nm) for the dyed filter affected by the acidic aerosol and k is the ratio of molar absorptivity of [In] at 420 nm to [
]at 545 nm. In this method, the aerosol only partially covers the dyed filter. The sum of
and
which is affected by the quantity of acidic aerosol, is proportional to the aerosol mass on the filter, and its relation is expressed as:
(3)
(3)
where
is the inorganic aerosol mass and
is a proportionality constant.
(µg) can be calculated using measured experimental values:
(4)
(4)
where
(m3/s) is the flow rate, ts is the sampling time,
(nL/m3) is the aerosol volume concentration, and
(µg/nL) is the inorganic aerosol density (predicted using E-AIM II (Clegg, Brimblecombe, and Wexler Citation1998)).
The equilibrium constant of a weak base, such as metanil yellow, is expressed as (Bunnett and Olsen Citation1966; Hammett and Deyrup Citation1932):
(5)
(5)
where
and
are the activity and the molarity activity coefficient, respectively. For the estimation of [H+], EquationEquation (5)
(5)
(5) is rewritten as (Jang, Cao, and Paul Citation2008; Jang et al. Citation2020):
(6)
(6)
is a basicity of indicator as a form of –log (
). Excess acidity (X) can be used to define the non-ideality term in a media (Bunnett and Olsen Citation1966; Perrin Citation1964):
(7)
(7)
X is proportional to when applying the excess acidity of sulfuric acid (
) to other systems in a strong acidic media. EquationEquation (6)
(6)
(6) can be expressed as (Cox and Yates Citation1978):
(8)
(8)
where
is a proportionality constant. Applying EquationEquations (2)
(2)
(2) and Equation(3)
(3)
(3) to EquationEquation (8)
(8)
(8) , retrieves the equation used in the C-RUV method (Jang et al. Citation2020):
(9)
(9)
The calibration equation in the C-RUV method was previously obtained by correlating the predicted proton concentration from the inorganic thermodynamic model (E-AIM II) to the experimentally measured C-RUV data at a variety of RH values and aerosol compositions. The of Metanil Yellow is 2.1, and m is −0.0329. X* is described as a function of RH. The resulting C-RUV equation was as follows (Jang et al. Citation2020):
(10)
(10)
The inorganic composition and humidity are commonly measured in laboratory and fields. For convenience, a polynomial regression equation was derived using C-RUV data to predict [H+] as discussed in the previous study (Jang et al. Citation2020):
(11)
(11)
where RH ranges from 0.1 to 0.8.
In order to determine the proton concentration ([H+]CICAM) using CICAM, the RGB scale is integrated into EquationEquation (10)(10)
(10) as follows:
(12)
(12)
where k’ is the ratio of light absorptivity between [In] and [
] in RGB scale, and α’ is a linear coefficient for the aerosol mass. ΔGrInH+,CICAM is the difference between the G value of the [In] and that of [InH+], in a similar manner to the change of A*545 in the C-RUV method. Terms, pKInH+ and mX*, are associated with properties of the specific indicator used and they do not change at a given indicator system. The coefficient associated with aerosol sample mass (Minorg) and the response (A*545 in C-RUV or ΔGr in CICAM) can be changed with the detection method (C-RUV or CICAM) and light source (UV or LED). In this study, k’ was calculated to be 0.0191 and α’ was calculated to be 3.199.
3.3. Correlation between CICAM and C-RUV
In order to discover a relationship between the C-RUV data, collected as absorbance values at specific wavelengths, and CICAM data, the C-RUV data was converted into RGB values. illustrates the procedure to convert the C-RUV data to the RGB Scale. The conversion was performed through the use of CIE color spaces, which serves as a quantitative link between “spectrophotometric measurements” and a standard trichromatic system (the XYZ color space) (Smith and Guild Citation1931). The XYZ color values are derived from the summation of illuminant, reflectance estimated from each wavelength, and observer data (Harris and Weatherall Citation1990). The observer data, representative of human color vision, was produced through a combination of Gaussian functions that represent a reference standard spectrum of three color components that encompass all colors visible to the typical human eye (Wyman, Sloan, and Shirley Citation2013) (Section S2A in the SI and Figure S2). Absorbance data were then converted to reflectance (Equation (S5) in the SI) for use in the CIE standard color function to convert a reflectance spectrum to the XYZ scale (Equations (S6)–(S9) in the SI).
Figure 3. Schematic for the comparison of the ΔGr from C-RUV method (a) to the ΔGr from CICAM method (b).
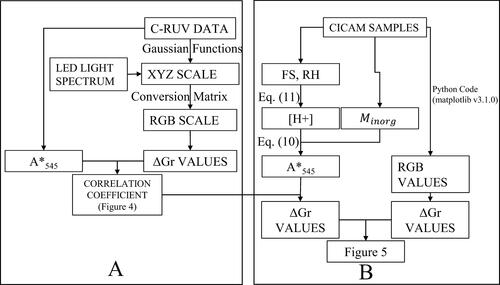
In this study, CICAM images were taken under LED light with the color temperature about 6000 K (Day white). RGB data, collected from the CICAM images of the filter, is also affected by the light source used to take the images. The C-RUV data was collected under UV light associated with the UV spectrometer, while the CICAM data from this study was collected under an LED light. Therefore, the LED light spectrum was applied to the conversion of C-RUV absorbance values to XYZ values, which were then converted to RGB values. Thus, LED light was used as the reference illuminant in the CIE standard color function. The conversion from XYZ values to RGB values was accomplished through the use of a conversion matrix (Section S3 in the SI).
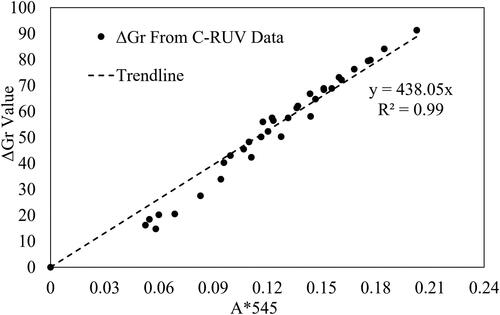
The procedure illustrated in was applied to convert UV spectral data (ranging from 190 nm−1 to 895 nm−1), of dyed filters both with and without acidic aerosol applied under different RH values, to RGB values. ΔGr values were calculated as the difference of G values of each filter with acidic aerosol applied and that without acidic aerosol applied under the same specific RH. Whereas each ΔGr value here is sourced from the entirety of a set of UV spectral data, EquationEquation (10)(10)
(10) , used for the C-RUV method, uses only the spectral data absorbance values at 545 nm(A*545) to predict [H+]. To establish a relationship between ΔGr and A*545, the resulting ΔGr values were graphed against A*545 values for the given data set. shows a strong linear relationship between the measured absorbance values and converted ΔGr values (R2 = 0.98).
Figure 4. Relationship between the measured absorbance at 545 nm using C-RUV method and the calculated ΔGr values converted from the XYZ scale of C-RUV spectral data.
To access the validity of the CICAM method to detect aerosol acidity, the ΔGr values (), processed from CICAM data images (Nos. 1–10 in ) using the python code, were compared to ΔG values derived from C-RUV data by the conversion to the XYZ scale and then the RGB scale. During the measurement of CICAM data (Nos. 1–10 in ), C-RUV data was not measured. However, the RH, FS, and Minorg of aerosol samples were available. At the given RH and FS value, the proton concentration [H+]C-RUV,reg can be predicted using EquationEquation (11)(11)
(11) . This [H+]C-RUV, reg can then be used, alongside the FS, and Minorg to predict A*545 using EquationEquation (10)
(10)
(10) . The correlation coefficient established in was applied to convert the predicted A*545 values to predicted ΔGr values as shown in . The predicted ΔG values were then plotted alongside the ΔGr values taken using the CICAM method ().
Figure 5. Comparison of the ΔGr values predicted from C-RUV data and the ΔGr values from CICAM measurements. The errors associated with ΔGr using CICAM method was estimated by standard deviation and the T distribution value (90% confidence). The errors associated with ΔGr using C-RUV data was calculated using error associated with A*545 values and the correlation coefficient between ΔGr and A*545 ().
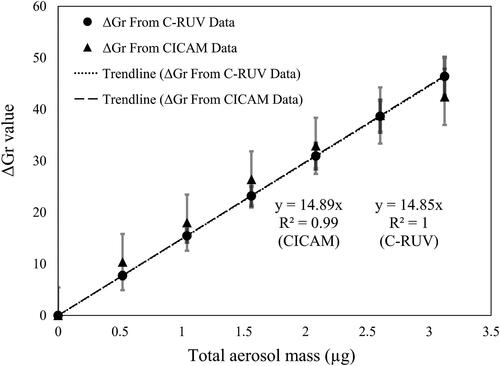
Table 1. Aerosols generated using tube flow reactor to develop CICAM method.
Notably, ΔGr values measured by the CICAM method were not statistically different from ΔG that calculated from C-RUV data. Therefore, we conclude that the CICAM and C-RUV method are interchangeable in their use for the prediction of proton concentration. As shown in the calculated error associated with CICAM in , the uncertainty in the measured [H+] for the CICAM method will be relatively high compared to that of C-RUV.
illustrates the values of Log[H+] that were measured by both the C-RUV and CICAM methods at two given FS values (FS = 0.7, 0.59) as a function of humidity. Values of Log[H+] predicted by the polynomial equation (EquationEquation (11)(11)
(11) ) using FS and RH values are also included in . All three methods reasonably accord with each other.
Figure 6. Log[H+] readings from the C-RUV and CICAM methods for two different aerosol compositions (FS = 0.7, 0.59) as a function of RH. The values for Log[H+] predicted using EquationEquation (11)(11)
(11) are also included. The error for the C-RUV data was calculated using error associated with A*545 values and the correlation coefficient between ΔGr and A*545 (8%). The error for the CICAM method was estimated standard deviation and the T distribution (90% confidence) value for 4 different data sets.
![Figure 6. Log[H+] readings from the C-RUV and CICAM methods for two different aerosol compositions (FS = 0.7, 0.59) as a function of RH. The values for Log[H+] predicted using EquationEquation (11)(11) log[H+] C−RUV, reg = −0.015RH+0.798FS+0.010FS × RH+0.373(11) are also included. The error for the C-RUV data was calculated using error associated with A*545 values and the correlation coefficient between ΔGr and A*545 (8%). The error for the CICAM method was estimated standard deviation and the T distribution (90% confidence) value for 4 different data sets.](/cms/asset/bfa84b02-2d21-4ccf-8453-4eeb826a3884/uast_a_1898536_f0006_b.jpg)
4. Atmospheric implication and uncertainty
This study demonstrates the efficacy of the CICAM method to measure [H+] in aerosol. The CICAM method allows for the in-situ measurement of aerosol acidity using a camera instead of a spectrometer found in the C-RUV method. The application of the CICAM method is currently limited to laboratory settings and further development will be required before the CICAM method could possibly be deployed in the field. The field deployment of the CICAM method would require the CICAM device, a small sampling pump (<5 L/min depending on the aerosol concentration), 3 denuders to remove acidic, basic, and organic gases, and measurements of particulate matter concentration, and RH.
For field application, the CICAM method, based on colorimetry, can be affected by black carbon as previously discussed in the C-RUV method (Jang et al. Citation2020). CICAM data need to be corrected by decoupling the RGB values into the one for the acidity measurement of the aerosol and another for black carbon found in ambient air. Collecting aerosol on a filter that is not dyed with a colorimetric chromophore (a white filter) allows for the measurement of the impact of black carbon on the RGB values. Then, these RGB values for the black carbon can be subtracted from those measured for the acidic aerosol on the dyed filter. Additionally, ambient aerosols can contrain organosulfates which can reduce the amount of acidic sulfate and aerosol hygroscopicity. The measurement of dialkyl organosulfate has been discussed by Li and Jang (Citation2012). Compared to the preexisting C-RUV method, the CICAM method demonstrated in this study has larger uncertainty in the measured [H+] as seen in and Figure S3 in the SI. The uncertainty associated with the measured [H+] using the CICAM method decreases as the total sampled aerosol mass increases. Thus, a certain amount of aerosol mass is needed to get reliable proton concentration using the CICAM method. The sampling area of this study was about 2 times smaller than the sampling area used in the previous C-RUV method, which increase the mass concentration per filter area. Under our calibration range and CICAM method, the detection limit of H+ is about 2.5 ng per filter sample which is significantly higher than that of the C-RUV method (0.2 ng per filter sample). Additionally, the indicator has the limitation for the measurement of aerosol acidity. As shown in Figure S3 in the SI, a large amount of highly acidic aerosol can lead to the saturation of indicator, leading to even the upper bound of the [H+] measurements to be lower than the actual value. However, the aerosol acidity of ambient aerosol is generally weaker than the aerosol acidity used for calibration curve. Thus, our calibration for CICAM can be suitable for most strongly acidic aerosol in ambient air.
The data obtained using CICAM is impacted by the light source. The CICAM method of this study employs a commercialized LED light (color temperature = 6000 K). This light from the LED bulb is somewhat inhomogeneous; it was brighter in the center than that at the edges. If the homogeneity of the light from the LED bulb is improved in the future, the uncertainty associated with the CICAM method will be decreased. The stability of the LED and the operation lifetime need to be estimated when applied to ambient measurements. Since the CICAM method utilizes a camera to obtain the data, the color of the images may vary slightly with different cameras and the setup of shutter to control exposure. The CICAM method should be calibrated for each individual model of camera used at the fixed control of exposure. However, as seen in , the ΔGr values obtained using the CICAM images well accord with the ΔGr values from C-RUV data. In the future, the CICAM method should be tested with different cameras to ensure the feasibility of CICAM. The indicator used, metanil yellow, is appropriate for the detection of [H+] of strongly acidic aerosols. For the proton concentration of more moderate or weakly acidic aerosols, a different indicator can be considered for use in the CICAM method.
Supplemental Material
Download MS Word (94.1 KB)Additional information
Funding
References
- Bunnett, J. F., and F. P. Olsen. 1966. Linear free energy relationships concerning equilibria in moderately concentrated mineral acids: A simple method for estimating pK's of weak bases. Can. J. Chem. 44 (16):1899–916. doi: https://doi.org/10.1139/v66-286.
- Chen, L. C., and M. Lippmann. 2009. Effects of metals within ambient air particulate matter (PM) on human health. Inhal. Toxicol. 21 (1):1–31. doi: https://doi.org/10.1080/08958370802105405.
- Clegg, S. L., P. Brimblecombe, and A. S. Wexler. 1998. Thermodynamic model of the system H+−NH4+−SO42-−NO3-−H2O at tropospheric temperatures. J. Phys. Chem. A. 102 (12):2137–54. doi: https://doi.org/10.1021/jp973042r.
- Cohen, L., M. I. Quant, and D. J. Donaldson. 2020. Real-time measurements of pH changes in single, acoustically levitated droplets due to atmospheric multiphase chemistry. ACS Earth Space Chem. 4 (6):854–61. doi: https://doi.org/10.1021/acsearthspacechem.0c00041.
- Colberg, C. A., B. P. Luo, H. Wernli, T. Koop, and T. Peter. 2003. A novel model to predict the physical state of atmospheric aerosol particles. Atmos. Chem. Phys. 3 (4):909–24. doi: https://doi.org/10.5194/acp-3-909-2003.
- Cox, R. A., and K. Yates. 1978. Excess acidities. A generalized method for the determination of basicities in aqueous acid mixtures. J. Am. Chem. Soc. 100 (12):3861–7. doi: https://doi.org/10.1021/ja00480a033.
- Craig, R. L., P. K. Peterson, L. Nandy, Z. Lei, M. A. Hossain, S. Camarena, R. A. Dodson, R. D. Cook, C. S. Dutcher, and A. P. Ault. 2018. Direct determination of aerosol pH: Size-resolved measurements of submicrometer and supermicrometer aqueous particles. Anal. Chem. 90 (19):11232–9. doi: https://doi.org/10.1021/acs.analchem.8b00586.
- Fang, T., H. Guo, L. Zeng, V. Verma, A. Nenes, and R. J. Weber. 2017. Highly acidic ambient particles, soluble metals, and oxidative potential: A link between sulfate and aerosol toxicity. Environ. Sci. Technol. 51 (5):2611–20. doi: https://doi.org/10.1021/acs.est.6b06151.
- Gao, S., N. L. Ng, M. Keywood, V. Varutbangkul, R. Bahreini, A. Nenes, J. He, K. Y. Yoo, J. L. Beauchamp, R. P. Hodyss, et al. 2004. Particle phase acidity and oligomer formation in secondary organic aerosol. Environ. Sci. Technol. 38 (24):6582–9. doi: https://doi.org/10.1021/es049125k.
- Gordon, H., J. Kirkby, U. Baltensperger, F. Bianchi, M. Breitenlechner, J. Curtius, A. Dias, J. Dommen, N. M. Donahue, E. M. Dunne, et al. 2017. Causes and importance of new particle formation in the present-day and preindustrial atmospheres. J. Geophys. Res. Atmos. 122 (16):8739–60. doi: https://doi.org/10.1002/2017JD026844.
- Hallquist, M., J. C. Wenger, U. Baltensperger, Y. Rudich, D. Simpson, M. Claeys, J. Dommen, N. M. Donahue, C. George, A. H. Goldstein, et al. 2009. The formation, properties and impact of secondary organic aerosol: Current and emerging issues. Atmos. Chem. Phys. 9 (14):5155–236. doi: https://doi.org/10.5194/acp-9-5155-2009.
- Hammett, L. P., and A. J. Deyrup. 1932. A series of simple basic indicators. I. The acidity functions of mixtures of sulfuric and perchloric acids with water1. J. Am. Chem. Soc. 54 (7):2721–39. doi: https://doi.org/10.1021/ja01346a015.
- Harris, A. C., and I. L. Weatherall. 1990. Objective evaluation of colour variation in the sand-burrowing beetle Chaerodes trachyscelides white (Coleoptera: Tenebrionidae) by instrumental determination of CIELAB values. J. R. Soc. New Zealand 20 (3):253–9. doi: https://doi.org/10.1080/03036758.1990.10416819.
- Hunter, J. D. 2007. Matplotlib: A 2D graphics environment. Comput. Sci. Eng. 9 (3):90–5. doi: https://doi.org/10.1109/MCSE.2007.55.
- Iinuma, Y., O. Böge, A. Kahnt, and H. Herrmann. 2009. Laboratory chamber studies on the formation of organosulfates from reactive uptake of monoterpene oxides. Phys. Chem. Chem. Phys. 11 (36):7985–97. doi: https://doi.org/10.1039/B904025K.
- Ito, A., and Z. Shi. 2016. Delivery of anthropogenic bioavailable iron from mineral dust and combustion aerosols to the ocean. Atmos. Chem. Phys. 16 (1):85–99. doi: https://doi.org/10.5194/acp-16-85-2016.
- Jang, M. 2013. Devices and methods for measuring the acidity of airborne matter using UV-visible spectrometry. Gainesville, FL: University of Florida Research Foundation.
- Jang, M., G. Cao, and J. Paul. 2008. Colorimetric particle acidity analysis of secondary organic aerosol coating on submicron acidic aerosols. Aerosol Sci. Technol. 42 (6):409–20. doi: https://doi.org/10.1080/02786820802154861.
- Jang, M., N. M. Czoschke, S. Lee, and R. M. Kamens. 2002. Heterogeneous atmospheric aerosol production by acid-catalyzed particle-phase reactions. Science 298 (5594):814–7. doi: https://doi.org/10.1126/science.1075798.
- Jang, M., S. Sun, R. Winslow, S. Han, and Z. Yu. 2020. In situ aerosol acidity measurements using a UV–visible micro-spectrometer and its application to the ambient air. Aerosol Sci. Technol. 54 (4):446–61. doi: https://doi.org/10.1080/02786826.2020.1711510.
- Jang, M., and Z. Yu. 2019. Method and appratus for detecting composition of airborne particles. Gainesville, FL: University of Florida Research Foundation.
- Li, J., and M. Jang. 2012. Aerosol acidity measurement using colorimetry coupled with a reflectance UV-visible spectrometer. Aerosol Sci. Technol. 46 (8):833–42. doi: https://doi.org/10.1080/02786826.2012.669873.
- Li, G., H. Su, N. Ma, G. Zheng, U. Kuhn, M. Li, T. Klimach, U. Pöschl, and Y. Cheng. 2020. Multifactor colorimetric analysis on ph-indicator papers: An optimized approach for direct determination of ambient aerosol ph Atmos. Meas. Tech. 13:6053–65. doi: https://doi.org/10.5194/amt-13-6053-2020.
- Meskhidze, N., W. L. Chameides, A. Nenes, and G. Chen. 2003. Iron mobilization in mineral dust: Can anthropogenic SO2 emissions affect ocean productivity? Geophys. Res. Lett. 30 (21):2085. doi: https://doi.org/10.1029/2003GL018035.
- Nenes, A., M. D. Krom, N. Mihalopoulos, P. Van Cappellen, Z. Shi, A. Bougiatioti, P. Zarmpas, and B. Herut. 2011. Atmospheric acidification of mineral aerosols: A source of bioavailable phosphorus for the oceans. Atmos. Chem. Phys. 11:6265–72. doi: https://doi.org/10.5194/acp-11-6265-2011.
- Offenberg, J. H., M. Lewandowski, E. O. Edney, T. E. Kleindienst, and M. Jaoui. 2009. Influence of aerosol acidity on the formation of secondary organic aerosol from biogenic precursor hydrocarbons. Environ. Sci. Technol. 43 (20):7742–7. doi: https://doi.org/10.1021/es901538e.
- Perrin, C. 1964. On the relation between ho and water activity. J. Am. Chem. Soc. 86 (2):256–8. doi: https://doi.org/10.1021/ja01056a032.
- Pye, H. O. T., A. Nenes, B. Alexander, A. P. Ault, M. C. Barth, S. L. Clegg, J. L. Collett, Jr., K. M. Fahey, C. J. Hennigan, H. Herrmann, et al. 2020. The acidity of atmospheric particles and clouds. Atmos. Chem. Phys. 20 (8):4809–88. doi: https://doi.org/10.5194/acp-20-4809-2020.
- Rengarajan, R., A. K. Sudheer, and M. M. Sarin. 2011. Aerosol acidity and secondary organic aerosol formation during wintertime over urban environment in Western India. Atmos. Environ. 45 (11):1940–5. doi: https://doi.org/10.1016/j.atmosenv.2011.01.026.
- Rohr, A. C., and R. E. Wyzga. 2012. Attributing health effects to individual particulate matter constituents. Atmos. Environ. 62:130–52. doi: https://doi.org/10.1016/j.atmosenv.2012.07.036.
- Smith, T., and J. Guild. 1931. The C.I.E. colorimetric standards and their use. Trans. Opt. Soc. 33 (3):73–134. doi: https://doi.org/10.1088/1475-4878/33/3/301.
- Surratt, J. D., A. W. H. Chan, N. C. Eddingsaas, M. Chan, C. L. Loza, A. J. Kwan, S. P. Hersey, R. C. Flagan, P. O. Wennberg, and J. H. Seinfeld. 2010. Reactive intermediates revealed in secondary organic aerosol formation from isoprene. Proc. Natl. Acad. Sci. U. S. A. 107 (15):6640–5. doi: https://doi.org/10.1073/pnas.0911114107.
- Surratt, J. D., M. Lewandowski, J. H. Offenberg, M. Jaoui, T. E. Kleindienst, E. O. Edney, and J. H. Seinfeld. 2007. Effect of acidity on secondary organic aerosol formation from isoprene. Environ. Sci. Technol. 41 (15):5363–9. doi: https://doi.org/10.1021/es0704176.
- Weber, R. J., J. J. Marti, P. H. McMurry, F. L. Eisele, D. J. Tanner, and A. Jefferson. 1997. Measurements of new particle formation and ultrafine particle growth rates at a clean continental site. J. Geophys. Res. 102 (D4):4375–85. doi: https://doi.org/10.1029/96JD03656.
- Weber, R. J., P. H. McMurry, L. Mauldin, D. J. Tanner, F. L. Eisele, F. J. Brechtel, S. M. Kreidenweis, G. L. Kok, R. D. Schillawski, and D. Baumgardner. 1998. A study of new particle formation and growth involving biogenic and trace gas species measured during ACE 1. J. Geophys. Res. 103 (D13):16385–96. doi: https://doi.org/10.1029/97JD02465.
- Wexler, A. S., and S. L. Clegg. 2002. Atmospheric aerosol models for systems including the ions H+, NH4+, Na+, SO42−, NO3−, Cl−, Br−, and H2O. J. Geophys. Res. 107 (D14):ACH 14-11–14-14. doi: https://doi.org/10.1029/2001JD000451.
- Wyman, C., P.-P. Sloan, and P. Shirley. 2013. Simple analytic approximations to the CIE XYZ color matching functions. J. Comput. Graphics Tech. 2 (2):1–11.