
 ?Mathematical formulae have been encoded as MathML and are displayed in this HTML version using MathJax in order to improve their display. Uncheck the box to turn MathJax off. This feature requires Javascript. Click on a formula to zoom.
Abstract
The miniCAST 5201 black carbon (BC) generator is a novel soot generator able to produce soot particles with a wide range of properties in a stable and reproducible manner. In this study, particles generated with diffusion and premixed flames were comprehensively analyzed, with a special focus on particle morphology, nanostructure, and optical properties. It was found that aggregate BC particles with a mean electrical mobility diameter of about 160 nm generated with an overall near-stoichiometric diffusion flame consist of primary particles with turbostratic layers and onion-like structures. Moreover, they possessed an absorption Ångström exponent (AAE) close to 1, low single scattering albedo (SSA), and a mass absorption cross-section MAC870nm,total (calculated from photoacoustic absorption coefficient and total particle mass) of 4.3 m2/g. With premixed flames under fuel-lean conditions, particles with mean mobility diameters of 50 nm, 75 nm, and 100 nm could be generated with high elemental carbon to total carbon mass fractions (>85%). These particles had a high structural order, exhibited an AAE of 1.1–1.2, low SSA and MAC870nm,total of 3.0–3.3 m2/g. The similarities of the properties of the miniCAST generated soot particles to real-world engine-emitted soot particles indicate that the miniCAST 5201 BC generator is a very promising source of reference aerosols for the calibration of BC diagnostic instruments and engine-exhaust particle counters.
EDITOR:
1. Introduction
Soot particles are formed as byproducts of incomplete combustion of carbon-containing fuels or biomass, along with other combustion products (Kagawa Citation2002; Niessner Citation2014). They have recently received increased attention from the scientific community, society, and policy makers due to their role in global climate change, in compromising air quality, and in threatening public health (Cassee et al. Citation2013). Soot particles have the ability to perturb the Earth’s energy balance directly by absorbing the incoming solar radiation (Ramanathan and Carmichael Citation2008; Bond et al. Citation2013), as well as semi-directly affecting cloud properties and atmospheric circulations (Koch and Del Genio Citation2010).
The term “soot” is often ambiguously defined in the literature. In this article, the term will be used in the source-mechanistic sense following Baumgardner et al. (Citation2012): carbonaceous material produced by combustion. This carbonaceous material is often classified into a light-absorbing fraction referred to as black carbon (BC), and/or a thermally refractory fraction called elemental carbon (EC), as well as a second fraction with a wide range of thermal and light-absorbing properties summarized as organic carbon (OC). The sum of EC and OC make up the total carbon (TC). Moreover, the specific nomenclature based on the applied measuring technique as proposed by Petzold et al. (Citation2013) will be followed, specifically, BC measured with the laser-induced incandescence (LII) technique will be referred to as refractory BC (rBC). Depending on the generation conditions, soot particles can differ remarkably in composition, morphology, size, and optical properties. Fresh soot particles emitted by diesel engines with geometric mean diameter (GMD) between 30 and 150 nm (Caroca et al. Citation2011; Ess, Bladt, et al. Citation2016) consist of fractal-like agglomerated carbonaceous primary particles (15–30 nm) with a highly ordered nanostructure (with traces of ash) and organic compounds condensed on their surface (Maricq Citation2007) depending on the combustion conditions. Instead, fresh soot particles (with GMD between 70 and 160 nm; Chen et al. Citation2019; Reid et al. Citation2004) formed during biomass burning show a much broader range of properties as the combustion conditions and fuel can be quite different: they are often brownish because they consist of a lower BC mass fraction (5–9%) and higher mass fractions of organic (80%) and inorganic matter (12–15% by mass; Reid et al. Citation2004). On one hand, the aforementioned differences are useful while investigating the sources of the particles via source apportionment (Hays and Vander Wal Citation2007; Zotter et al. Citation2017; Braun et al. Citation2008), but on the other hand, they pose a great challenge for measurement instruments in dealing with such a variety of physicochemical properties.
In most parts of Europe and North America, the dominant sources of soot particles have shifted over the years from domestic and industrial coal burning to emissions from transportation sources (Bond et al. Citation2013; Klimont et al. Citation2017). A number of instruments based on different measurement principles, such as absorption photometers, condensation particle counters (CPC), and diffusion chargers (DC) have been developed for emission control and air quality monitoring. Even though most of these instruments are portable and quite robust, the lack of soot reference materials prevents reliable instrument calibration and inter-comparison (Baumgardner et al. Citation2012).
To reduce real-world particulate emissions from engine exhaust, legislation was recently introduced in the EU for on-road type approval (TA) real driving emission (RDE) tests using portable emissions measurement systems (PEMS; European Commission Citation2017; Giechaskiel Citation2018). Moreover, a new scheme for the periodic technical inspection (PTI) of vehicles based on particle number (PN) concentration has been introduced in Switzerland (Eidgenössisches Justiz- und Polizeidepartement EJPD Citation2018), Belgium, and the Netherlands (Burtscher, Lutz, and Mayer Citation2019), while other countries, such as Germany, are expected to follow in due course. However, most PN-PEMS and PN-PTI instruments are CPC or DC-based instruments designed to measure PN concentration directly at the exhaust or tailpipe (Bischof Citation2015). The TA and verification procedures for these devices require laboratory-generated soot particles with realistic properties, i.e., small particle sizes (<100 nm) with high BC content (>80%, Maricq Citation2014) or EC to TC mass fraction (EC/TC > 80% for aircraft emission measurements; Durdina et al. Citation2016) in order to mimic the properties of soot generated by motor vehicles (Maricq Citation2014; Mamakos et al. Citation2013).
For air quality monitoring as well as fundamental studies on the microphysical properties of soot particles, the use of filter-based absorption photometers and aethalometers for the measurement of absorption coefficients (babs) and equivalent black carbon (eBC) mass concentrations is widespread (note that in this context eBC concentrations are obtained from babs by dividing by an assumed BC mass absorption coefficient or MACBC). These instruments are compact and suitable for unattended operation in the field; however, traceability is hampered by the fact that particulate matter is collected on a filter for measurement (McMurry Citation2000). Even though a range of correction algorithms have been proposed for minimizing measurement biases, deriving accurate eBC mass concentrations is still challenging (Collaud Coen et al. Citation2010; Weingartner et al. Citation2003; Virkkula Citation2010; Drinovec et al. Citation2015). Alternatively, filter-based thermal-optical instruments quantitatively retrieve the aerosol EC and OC fraction by heating the filter with specific temperature ramps in controlled atmospheres, following established protocols (Cavalli et al. Citation2010; Birch and Cary Citation1996). The filter collection-related challenges and artifacts are overcome by online instruments, such as photoacoustic or LII instruments, measuring bulk or single-particle soot properties. A common source of uncertainty in all of these different approaches for measuring BC mass concentrations is the lack of reference soot aerosols with well-known and stable properties that are similar to those of atmospheric soot aerosols.
Several methods have been proposed for the generation of carbonaceous aerosols in the laboratory. These can be roughly categorized into two groups: (i) methods relying on a burner, e.g., a miniCAST (Moore et al. Citation2014; Mamakos et al. Citation2013; Ess and Vasilatou Citation2019; Maricq Citation2014), a McKenna burner (Kastelis and Zervas Citation2008; Ghazi et al. Citation2013) or an inverted burner (Moallemi et al. Citation2019; Kazemimanesh et al. Citation2019; Stipe et al. Citation2005), for the generation of combustion-based soot and (ii) methods for generating non-combustion-based soot surrogate particles, such as colloidal graphite (AquaDAG) or fullerene soot (FS; Aiken et al. Citation2016; Gysel et al. Citation2011; Moteki and Kondo Citation2010), or fractal-like carbonaceous aerosols generated by spark-discharge (Bescond et al. Citation2016; Helsper et al. Citation1993). For a more detailed discussion on these methods, the readers are referred to Moallemi et al. (Citation2019) and references therein.
Combustion-based carbonaceous aerosols generated under fuel-lean conditions mimic the morphology and nanostructure of atmospheric soot better than soot surrogate aerosols (Saffaripour et al. Citation2017; Moallemi et al. Citation2019). Yet, it has proven challenging to generate combustion-based soot particles with mobility diameters below 60 nm that exhibit high EC/TC mass fraction and atmospherically relevant MAC values in the laboratory (Maricq Citation2014). The mini-inverted burner enables the generation of soot with EC/TC mass fractions greater than 90% and MAC values ranging from 3 to 5 m2/g at a wavelength of 870 nm; however, it is not capable of repeatedly producing soot with mobility diameters below 140 nm (Moallemi et al. Citation2019). Recently, the performance of a prototype miniCAST generator (miniCAST 5201 Type BC, Jing AG, Switzerland) with a partially premixed flame operation mode was characterized and the generation of soot particles with a mobility diameter of ≥30 nm and EC/TC mass fraction of at least 65% without any conditioning/treatment of the soot was demonstrated (Ess and Vasilatou Citation2019). This prototype generator, which forms the basis of the new miniCAST 5301 commercial series, could be a promising soot source for the calibration of engine-exhaust CPCs, PN-PEMS, PN-PTI devices, and filter-based absorption photometers.
However, hardly any information is currently available on the optical properties and morphology of the soot produced with the novel partially premixed flame (Ess and Vasilatou Citation2019). Former studies have only examined CAST/miniCAST particles produced by diffusion flames (Schnaiter et al. Citation2006; Török et al. Citation2018; Linke et al. Citation2016; Kim et al. Citation2015). To our knowledge, the only comprehensive study reporting MAC values of soot at various operation points is a 15-year-old study by Schnaiter et al. (Citation2006) based on a CAST generator (undefined model). However, the burner of the new generation of miniCAST models working with premixed flames (miniCAST prototype 5201 Type BC and its commercial follow-up model 5301) has been carefully redesigned, and both the dimensions and overall construction of the burner have been considerably improved (Dr. Lianpeng Jing, manufacturer, conversation, February 22, 2021).Footnote1 Similarly, previous studies performing transmission electron microscopy (TEM) have only examined soot particles produced by miniCAST diffusion flames (Ess, Ferry, et al. Citation2016; Mamakos et al. Citation2013; Saffaripour et al. Citation2017). Since the temperature reached in the novel partially premixed flames is much higher than that in diffusion flames, the combustion/carbonization processes are enhanced and therefore the nanostructure and optical properties of the generated soot might differ.
To address this gap in knowledge, this investigation builds upon the Ess et al.’s study (Ess and Vasilatou Citation2019) by providing a more comprehensive characterization of the optical properties, morphology, and nanostructure of soot produced with the miniCAST 5201 BC generator. Polydisperse soot particles with GMDs of 50 nm, 75 nm, and 100 nm (160 nm) were successfully generated with the miniCAST with the novel partially premixed flame (the conventional diffusion flame). Special focus was placed on the size distribution, morphology and nanostructure (TEM and Raman microspectroscopy), effective density (mass-mobility measurements), composition (i.e. EC/TC mass fractions), and optical properties (absorption Ångström exponent [AAE], single scattering albedo [SSA], MAC). In particular, the determination of the MAC values, primary particle size, and nanostructure of soot particles ≤100 nm generated with the novel premixed flame mode provides new insight into the properties of the soot particles and their potential as surrogate for diesel engine particulate emissions. Comparison with the properties of real-world engine-emitted soot particles provides strong evidence that the generated soot has realistic properties and can thus serve as aerosol source for the calibration of soot measuring instruments as well as for basic aerosol research.
2. Experimental methods
2.1. Aerosol generation
In this study, the miniCAST 5201 Type BC (Jing Ltd., Zollikofen, Switzerland), hereafter referred to as miniCAST BC, was used as aerosol generator. The generator was operated in both possible burning regimes, i.e., with a diffusion and partially premixed flame (Ess and Vasilatou Citation2019). When operated with a diffusion flame, the fuel (propane, >99.95%, Carbagas, Rümlang, Switzerland) is mixed with the surrounding oxidation air (dried pressurized air, <400 ppm water) by diffusion. Nitrogen (pure from liquid N2 tank) is used to quench the flame and sweep the soot particles out of the burner. Dilution air (dried pressurized air, <400 ppm water) is added to stabilize the aerosol by reducing the particle concentration, thereby limiting agglomeration. In the premixed flame mode, air (“premixed air”, dried pressurized air, <400 ppm water) is directly added to the propane flow to achieve premixed flame conditions. Since the flame is still surrounded by oxidation air, which is needed for stabilizing the flame, the latter is not a purely premixed but rather a combination of a premixed and a diffusion flame. For simplicity, however, this operation mode of the miniCAST BC will be termed here as “premixed flame”.
Different “standard” operation points (otherwise known as set points) were selected based on the previous study by Ess and Vasilatou (Citation2019) in order to generate aerosol particles with markedly different physicochemical properties, spanning a wide range of particle sizes and EC to TC mass fractions. The largest particles were generated with the diffusion flame under overall near-stoichiometric conditions, whereas smaller particles were generated either with the premixed flame at fuel-lean-near-stoichiometric conditions or with fuel-rich diffusion flames. The gas flows of the investigated operation points as well as the overall molar carbon to oxygen ratio (C/O ratio; Schnaiter et al. Citation2006) are summarized in .
Table 1. Operation points of the miniCAST BC used in this study.
Additionally, several monodisperse particle distributions were selected with an aerodynamic aerosol classifier (AAC) from four miniCAST premixed set points (with EC/TC mass fractions higher than 90% and GMDmob from 112 nm to 160 nm) as discussed briefly in Subsection 3.4 and described in more detail in Section S8 in the Supporting information.
2.2. Instrumentation
The PN size distribution was determined with a scanning mobility particle sizer (SMPS+C with L-DMA (Am-241 neutralizer) and CPC model 5403, Grimm Aerosol Technik GmbH & Co. KG, Ainring, Germany) in stepping mode. The DMA column was suitable for particles with mobility-equivalent diameters between 11 nm and 1050 nm. The ratio of the DMA sheath air to the aerosol flow was 10:1, with aerosol and sheath air flow set to 0.3 L/min and 3 L/min, respectively. The resolution was set to 45 channels. Every measurement was repeated at least three times. The measurements were averaged (the standard error of the mean was calculated for every size bin), and the sizes were corrected according to the current calibration function of the SMPS. Finally, the number-weighted average geometric mean mobility diameter GMDmob, geometric standard deviation GSDmob and total PN concentration and their uncertainties (through linear uncertainty propagation) were determined.
The total aerosol mass concentration was measured with a Tapered Element Oscillating Microbalance (Patashnick and Rupprecht Citation1991; Gilliam and Hall Citation2016; TEOM 1405, Ambient Particulate Monitor, Thermo Fisher Scientific Inc., Franklin, MA, USA), which was operated with a main flow rate of 1 L/min at 30 °C. The frequency of the tapered element was recorded every 6 s and used to calculate the total mass on the filter. Based on this and the known aerosol flow rate, the mass concentration was determined as an average from the last 30 min of measurements.
Aerosol absorption coefficient measurements were performed with an aethalometer, a photoacoustic extinctiometer (PAX), and a multi-angle absorption photometer (MAAP). The aethalometer (Aethalometer AE33, Magee Scientific, Berkeley, CA, USA) was used to determine the AAE as a measure for the wavelength dependence of the absorption. The AE33 measures the change of light attenuation through a filter at seven wavelengths (370, 470, 520, 590, 660, 880, and 950 nm) and corrects for filter loading effects by two spot sampling (Drinovec et al. Citation2015). The scattering correction factor () determined by the manufacturer for the build-in filter tape was used to derive the absorption coefficient,
Here, the true value of the C-factor is not relevant; if the C-factor exhibits only weak wavelength dependence or is sufficiently small, it cancels out when calculating the AAE. No other scattering corrections were applied. The AAE was calculated using the
at all wavelengths. Since sufficiently small BC particles absorb strongly over the entire visible wavelength range and exhibit only a weak spectral dependence, the AAE is close to 1 (Bond et al. Citation2013; Schnaiter et al. Citation2003; Corbin et al. Citation2019; Liu et al. Citation2018). If the soot particles do not only contain BC, but also a substantial fraction of light-absorbing organic substances which enhance the light absorption at lower wavelengths (near UV and blue), the AAE is significantly higher than 1 (Corbin et al. Citation2019; Kirchstetter, Novakov, and Hobbs Citation2004). The AE33 was operated with a total aerosol flow of 2 L/min and an integration time of 60 s for several minutes. The arithmetic mean value for the parameter of interest (e.g. AAE or
) and the resulting standard deviation was then calculated. The PAX (PAX 870 nm, Droplet Measurement Technologies Inc., Boulder, CO, USA) combines a wide-angle integrating reciprocal nephelometer to measure scattering and a photoacoustic cell to measure absorption in parallel. In these experiments, a PAX with a wavelength of 870 nm was used to determine the absorption coefficient
and the SSA (SSA870 nm) of the generated soot particles. The scattering channel (reciprocal nephelometer) of the instrument was calibrated against extinction measurements based on Lambert-Beer’s law using high concentrations of polydisperse ammonium sulfate aerosol. The photoacoustic channel (absorption cell) was cross calibrated with EC-rich soot particles from the miniCAST BC (Nakayama et al. Citation2015). The sample flow was 1 L/min and the data averaging time was chosen to be 60 s, with background (zero) measurements being performed every 5 min. Mean values and standard deviations were calculated from at least 10 min of measurement. The MAAP (Model 5012, Thermo Fisher Scientific Inc., Franklin, MA, USA) was used to determine the absorption coefficient
of the generated aerosol at the wavelength of 637 nm using a correction of 5% to account for the fact that the true wavelength is 637, not 670 nm (Zanatta et al. Citation2016; Müller et al. Citation2011). Here, the radiative transfer and the diffuse backscattering of the aerosol deposited on the filter tape are used to correct for scattering artifacts. The sample flow was set to 16 L/min and one data point was recorded every minute. Arithmetic mean values and standard deviations of the data were calculated from several minutes of measurement.
An aerosol particle mass analyzer (APM-II, Model 3601, Kanomax USA, Inc., Andover, NJ, USA) was used to select particles by their mass-to-charge ratio. Combined with an SMPS (Electrostatic Classifier Series 3080, 3 L/min sheath air and CPC 3776 low flow, TSI Inc., Shoreview, MN, USA), the effective density of the particles could be determined. Briefly, a particle mass was selected with the APM and the resulting particles were scanned with an SMPS in order to determine the mobility diameter corresponding to the selected mass. At least three SMPS measurements were averaged (the standard error of the mean was calculated for every size bin), then the size bin limits were corrected according to the most recent calibration function of the SMPS. Finally, the average geometric mean diameter GMDmob and its uncertainty were determined via a linear uncertainty propagation. The effective density, ρeff, was calculated from particle mass and geometric mean mobility diameter according to EquationEquation (1) (Kulkarni et al. Citation2011; Gysel et al. Citation2011):
(1)
An AAC (Cambustion Ltd., Cambridge, UK; Tavakoli and Olfert Citation2014; Johnson et al. Citation2018) was used to size select particles according to their aerodynamic diameter. The AAC was operated at a maximum sample flow rate of 1 L/min and the sheath air flow was kept as close as possible to 10 L/min. Particle sizing was achieved by letting the software adjust the rotational speed of the classifier.
The single-particle soot photometer (SP2, Droplet Measurement Technologies, Longmont, CO, USA) is an online single-particle instrument able to quantitatively retrieve the mass of the refractory black carbon particles (rBC; following the nomenclature suggested by Petzold et al. (Citation2013). The SP2 is a well-characterized instrument relying on the LII technique. A complete description of the working principles and measuring performances of the SP2 can be found in (Moteki and Kondo Citation2007; Stephens, Turner, and Sandberg Citation2003; Schwarz et al. Citation2006; Laborde, Mertes, et al. Citation2012). Briefly, the instrument functions by drawing particles into the center of a Gaussian-profiled, continuous-wave Nd:YAG laser operating at a wavelength of 1064 nm. The rBC particles efficiently absorb the radiation at this wavelength and, as a consequence, are heated up to their sublimation temperature (approximately 4000 K), where they emit an incandescence signal before vaporizing. The incandescence signals from each particle are recorded by two detectors (photomultiplier tubes) equipped with band pass filters in the ranges 350–800 nm and 630–800 nm. The peak height intensity of an incandescence signal is proportional to the volume (and therefore the mass) of the incandescing rBC particle. In order to retrieve the particle mass from the incandescence signal intensity, the detectors have to be empirically calibrated using mass-selected particles. However, the SP2 incandescence signal to particle mass calibration relationship depends on the BC type. Generally, the most common calibration materials for atmospheric measurements are FS and AquaDAG (Aqueous Deflocculated Acheson Graphite from Acheson Inc., USA) particles: the former is specifically recommended since the SP2 showed a similar sensitivity between FS and diesel soot emissions (Baumgardner et al. Citation2012). Since miniCAST generated BC particles with different physical properties were measured in this study, the SP2 was calibrated via APM mass-selected particles of the specific miniCAST set point under investigation. The reproducibility of the SP2 was tested during an intense chamber inter-comparison for 6 SP2 units, resulting to be of 10% for the retrieval of BC mass size distributions (Laborde, Schnaiter, et al. Citation2012).
The SP2 detection efficiency abruptly decreases for particles smaller than approximately 80–100 nm of BC mass equivalent diameter (between 0.2 and 0.5 fg; Laborde, Schnaiter, et al. Citation2012). Therefore, accurate BC mass concentration retrievals are only possible for particle size distributions where the peak in mass is well reconstructed, i.e., for particles above the detection limit cutoff. Under this circumstance, it is suggested to correct the missing mass simply by calculating it using the fitting the mass size distribution (Pileci et al. Citation2021). A complete description of the applied correction to the BC mass is reported in Supplementary Figure S9.
Filter samples were collected for EC/OC analysis, Raman microspectroscopy, and high-resolution transmission electron microscopy (HRTEM). For the EC/OC analysis and the Raman measurements, the aerosol was sampled on quartz fiber filters (Advantec, Tokyo, Japan, QR-100, 47 mm, prebaked at 500 °C for 1.5 h) at a flow rate of 1.2 L/min. To collect the particles on TEM grids (S147-4, Holey Carbon Film, 400 Mesh Cu, Agar Scientific Ltd, Stansted Essex, UK), a tandem DMA setup (2x Electrostatic Classifier Series 3080, both DMAs equipped with bipolar chargers for reduction of multiple charges, 3 L/min sheath air, TSI Inc., Shoreview, MN, USA) was used to produce truly monodisperse size distributions (i.e. without multiply charged particles). The TEM grids were placed in a mini particle sampler (MPS, Ecomeasure, Saclay, France; R’mili et al. Citation2013) attached to a pump and the sampling flow rate was set to 0.3 L/min.
Thermal-optical analysis was performed with an OC/EC-Analyzer (Lab OC-EC Aerosol Analyzer, Sunset Laboratory Inc., Hillsborough, NC, USA). The EUSAAR2-protocol (Cavalli et al. Citation2010) was modified by extending the last temperature step (850 °C) from 80 s in the original protocol to 120 s in order to ensure complete evolution of carbon. OC, EC, and TC masses were calculated based on instrument calibration with sucrose solutions. The OC and TC masses were then corrected by subtracting the OC mass from the gas-phase adsorbed on the backup filter (Moallemi et al. Citation2019; Mader et al. Citation2003). The uncertainty of the corrected OC and EC masses is calculated by propagating uncertainties given by the instrument’s software, calculated as the detection limit of 0.2 µgC/cm2 plus 5% of the carbon mass determined in the analysis for each carbon fraction. Uncertainties related to the determination of the split point could not be quantified and were therefore not taken into account.
Raman microspectroscopy was performed with an upright Raman microscope (ND-MDT NTEGRA Raman microscope, NT-MDT Spectrum Instruments, Moscow, Russia) equipped with a laser of 532 nm wavelength and a 50× objective lens with a numerical aperture of 0.75. The acquisition time was 30 s and the laser power was reduced to prevent sample degradation. Spectra were recorded at three random positions on the soot-loaded quartz fiber filters. After background correction of the spectra (linear between ∼800 cm−1 to ∼1875 cm−1) with the Peak Analyzer Tool of OriginPro 2019 (Version 9.6.0, OriginLab Corporation, Northampton, MA, USA), the spectra were normalized to the graphitic G-Peak at about 1600 cm−1 and averaged to yield one mean spectrum for every operation condition. The peak ratio of the two Raman soot peaks I(D)/I(G) was determined from the spectra. Additionally, a five-band fit was performed according to Sadezky et al. (Citation2005).
The TEM/HRTEM images were recorded with a Tecnai F20 transmission electron microscope (Tecnai F20 Twin, 200 kV field emission electron gun FEG, FEI, subsidiary of Thermo Fisher Scientific, Hillsboro, OR, USA). The Camera FEI Ceta 16 M (CCD, 4096 × 4096 pixels), FEI subsidiary of Thermo Fisher Scientific, Hillsboro, OR, USA) was used.
2.3. Experimental setup
The aerosol sampled at the outlet of the miniCAST’s exhaust pipe was guided through a diffusion dryer filled with silica gel (Silica gel orange, Carl Roth AG, Arlesheim, Switzerland) and diluted by a rotation disk diluter (MD19, Matter Engineering AG, Wohlen, Switzerland). The particles were subsequently analyzed with four different setups (a–d) depending on the aim of each experiment as shown in . Additionally, measurements of size-selected particles within certain size distributions were performed as reported in Section S8 in the Supporting information.
Figure 1. Schematic illustration of the setups for the characterization of the selected operation points. The setup using path (a) was used to determine particle size distributions, mass concentrations, and optical properties. Path (b) was used to sample soot on filters for subsequent offline analysis with TEM, Raman microspectroscopy, or EC/OC analysis. Path (c) was used to determine the effective density of the particles and path (d) with an additional dilution unit was used for measurements involving MAAP and SP2.
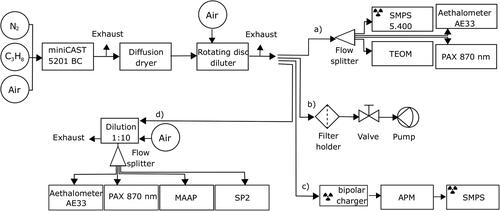
To determine optical properties (SSA, AAE, and MAC), and the particle mass concentration and size distribution of polydisperse soot aerosols the aerosol was split by a flow splitter and delivered to the SMPS (Grimm GmbH, Germany), TEOM, PAX, and Aethalometer (path a in ). Soot particles were sampled on quartz fiber filters to later perform filter-based EC/OC analyses and Raman microspectroscopy (path b in ). For the sampling on TEM grids, two DMAs (DMA 3081, TSI Inc., Shoreview, MN, USA) were placed in front of the MPS. For the determination of the effective density, the APM was directly coupled to an SMPS (TSI; path c in ). Alternatively, the aerosol was diluted further by a 1:10 dilution unit (VKL 10 dilution unit, 1.5 bar, Palas GmbH, Karlsruhe, Germany) and subsequently split with a flow splitter and distributed to the aethalometer (same instrument as in former path a), the PAX (same instrument as in former path a) the MAAP and SP2 for comparison of the instruments and determination of the MAC (path d in ).
3. Results and discussion
3.1. Size distributions and composition
The seven “standard” operation points were selected to cover the broad range of particle sizes and properties attainable with the miniCAST BC while, at the same time, maintaining high stability and day-to-day reproducibility (Ess and Vasilatou Citation2019). The relative deviation in PN concentration was <8% for different days while the relative deviation in GMDmob was even smaller (<2%, see Supporting information Section S1). Thus, for the defined operation points, the miniCAST BC appeared to perform better than former models, such as model 4202 used by Moore et al., which showed fluctuations within <10% for mode diameter and a factor of two in concentration for different days (Moore et al. Citation2014).
The largest particle size that can be generated with the miniCAST BC (without using any additional agglomeration volume) is achieved with a diffusion flame under near-stoichiometric but slightly fuel-lean conditions (Ess and Vasilatou Citation2019). The GMDmob of these particles is near 160 nm and the mass concentration of the undiluted soot amounts to approximately 190 mg/m3. As shown in , these particles exhibit a high EC/TC content in agreement with observations made with other miniCAST soot generators (Moore et al. Citation2014; Schnaiter et al. Citation2006; Ess and Vasilatou Citation2019; Maricq Citation2014). On the other hand, smaller particles were generated by premixing air with the propane fuel prior to entering the flame. In former studies with other burners, the particle size has often been tuned by mixing nitrogen into propane; however, this resulted in particles with lower EC mass fraction (Moore et al. Citation2014; Maricq Citation2014). With the miniCAST BC, on the contrary, mixing air into propane effectively decouples the particle composition from the size, and the particle size can be tuned down with only a slight decrease in the EC/TC mass fraction. Thus, without any thermal treatment, the operation points “100 nm premixed”, “75 nm premixed” and “50 nm premixed” generated particles with 100 ± 11%, 91 ± 8%, and 85 ± 10% EC/TC mass fraction, respectively, simulating well the properties of soot particles from diesel vehicle exhaust which possess a GMDmob in the range of 30–150 nm (Puzun et al. Citation2011; Caroca et al. Citation2011; Ess, Bladt, et al. Citation2016) and EC/TC mass fractions of ≥60% (Lu et al. Citation2012; Hebisch et al. Citation2003; Cauda et al. Citation2012; Wierzbicka et al. Citation2014). In contrast, soot generated with the fuel-rich diffusion flame possesses EC/TC mass fractions which decrease strongly with decreasing particle size because of the more fuel-rich combustion (Schnaiter et al. Citation2006; Moore et al. Citation2014). Therefore, the selected operation points listed in cover a wide range of particle sizes and compositions.
Table 2. Characteristics of the number size distribution, mass concentration, and composition of the aerosol generated using the miniCAST 5201 BC generator. The size distributions can be found in the Supporting information Section S3.
3.2. Morphology
A commonly used tool to determine the structural order of carbonaceous particles is Raman spectroscopy. The spectrum of soot consists of two overlapping peaks with a Raman shift of about 1350 cm−1 and 1600 cm−1. The peak assignment can be derived from the spectra of true graphitic materials even though the soot nanostructure is more disordered and additional features occur in the spectra of soot compared to those of graphite. For graphite, the peak at 1600 cm−1 is commonly called the G-peak from “graphite”, as this is the only peak appearing in a single graphite crystal and is assigned to the vibrational mode of E2g symmetry of the ideal sp2-hybridized structure (Tuinstra and Koenig Citation1970; Saito et al. Citation2011). The other peak at 1350 cm−1, called the D-peak from “disordered” graphitic lattice, is attributed to the totally symmetric vibrational mode (A1g symmetry) and is associated with the presence of graphene layer edges in graphite materials which do not consist of only a single crystal (Wang, Alsmeyer, and McCreery Citation1990; Tuinstra and Koenig Citation1970). Going to more disordered structures like soot, however, additional spectral features originating from other structural defects (Jawhari, Roid, and Casado Citation1995; Liu et al. Citation2010; Parent et al. Citation2016; Sadezky et al. Citation2005; Wang, Alsmeyer, and McCreery Citation1990) appear in the Raman spectra, which cannot be spectroscopically resolved. As a result, a typical Raman spectrum of disordered graphitic material, as the one displayed in , is a convolution of several overlapping vibrational bands (with the two main peaks still called D-peak and G-peak as in graphitic materials).
Figure 2. Raman spectra of the generated soot recorded with 532 nm laser and normalized to the graphitic G-peak at ∼1600 cm−1.
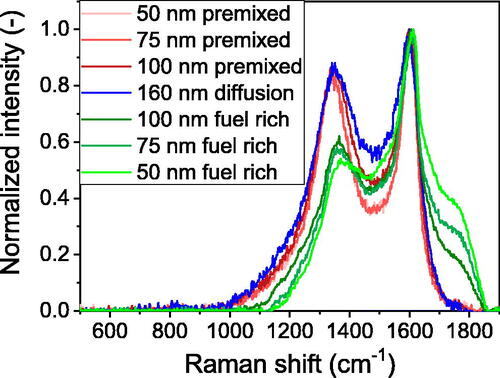
In this study, a semi-qualitative analysis/comparison of the Raman spectra of the soot generated with the various operation points is given based on Ferrari and Robertson as well as Zickler et al. (Commodo et al. Citation2015; Ferrari and Robertson Citation2000; Zickler et al. Citation2006). These authors suggested that below a crystallite length of 2 nm a higher I(D)/I(G) ratio indicates a larger crystallite size, in contrast to graphitic materials where the I(D)/I(G) ratio is inversely proportional to the structural order. shows the mean Raman spectra of the various soot samples generated by the miniCAST BC. To facilitate comparison of the spectra, these have been normalized to the graphitic G-peak located at about 1600 cm−1. The Raman spectra of soot generated at slightly fuel-lean conditions (premixed and diffusion flame) show similar intensities of about 0.86–0.88 for the D-peak while the spectra of soot generated under fuel-rich conditions reveal a lower D-peak intensity of 0.54–0.62 (see ). Assuming an overall mean crystallite size smaller than 2 nm, in accordance with previous findings for miniCAST, aircraft, and truck soot (Malmborg et al. Citation2019; Vander Wal, Bryg, and Hays Citation2010; Hays and Vander Wal Citation2007), the spectra indicate a higher structural order (larger crystallites and higher D-peak intensity) for the soot generated under fuel-lean conditions due to the more complete combustion and higher flame temperature reached closer to stoichiometric conditions (Moore et al. Citation2014). A similar behavior has been observed in previous studies with different soot generators, where fuel-lean and fuel-rich conditions were compared. For instance, soot generated with a miniCAST 5201 under fuel-rich conditions showed low I(D)/I(G) ratios, indicating a smaller crystallite size (Ess, Ferry, et al. Citation2016). On the contrary, soot generated with a miniCAST under fuel-lean conditions revealed higher I(D)/I(G) ratios, similar to those of aircraft engine soot (Saffaripour et al. Citation2017) or diesel soot (Patel et al. Citation2012; Schmid et al. Citation2011).
Table 3. Morphology of the soot particles including parameters extracted from TEM and HRTEM images as well as from the Raman spectra.
Another difference in the Raman spectra is visible in the region between the two peaks at about 1500 cm−1. Vibrations in this spectral region are normally associated with amorphous carbon compounds consisting of mixtures of sp2- and sp3-hybridized carbon (Jawhari, Roid, and Casado Citation1995). Strong intensities indicate higher disorder of the nanostructure and curvature of the crystallites. Quantifying the contribution of the vibrational band at about 1500 cm−1 to the total area of the spectrum (by using the 5-band-fitting method by Sadezky et al. Citation2005), the lowest relative contribution (i.e. higher structural order) was found in the spectra of the soot “50 nm premixed” and “75 nm premixed” followed by the soot “100 nm premixed”. The fraction was remarkably higher in the “160 nm diffusion” soot, and it increased even further for the soot generated at fuel-rich conditions (see Supporting information Section S4). This implies that the soot generated with the premixed flame not only has a higher structural order (indicated by the high I(D)/I(G) ratio) but also a lower content of amorphous structures compared to the soot generated at fuel-rich conditions and with the diffusion flame.
A third feature in the Raman spectra worth attention is the contribution of organic compounds. It has been found before that organic compounds with sp3 hybridization, intermediate sp2–sp3 hybridization, and/or polyene-like structures give rise to a shoulder on the soot Raman spectrum at about 1200 cm−1 (Dippel, Jander, and Heintzenberg Citation1999). In the Raman spectra of the examined soot samples, only a short tail but no shoulder is visible. In contrast, a shoulder is clearly discernible in the Raman spectra of the fuel-rich soot samples at higher wavenumbers around 1750 cm−1. This band has been reported for soot aged with ozone and assigned to the stretch vibration of the carbonyl group in ketones, lactones, and anhydrides (Liu et al. Citation2010). This implies that, in the case of the soot produced in this study, the higher deviation from stoichiometric conditions toward fuel-rich conditions increases the content of functional groups and compounds on the soot surface. In , the intensity of the shoulder increases with decreasing particle size and thus with increasing OC/TC mass fraction, a piece of evidence that further corroborates the assignment of this spectral feature to organic compounds and indicates that the soot generated at fuel-rich conditions may contain a considerable amount of carbonyl groups.
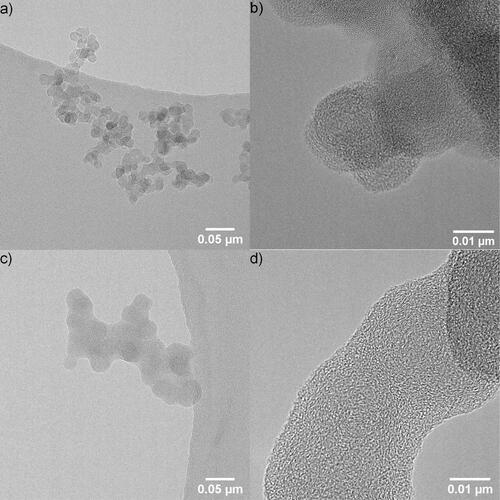
A more straightforward method than Raman spectroscopy to obtain information on the soot morphology is TEM. TEM analyses were performed on mobility size-selected particles generated at different operation points to extract information on the primary particle size. Furthermore, HRTEM images provide insight into the nanostructure of the particles. As an example, TEM images of the soot “100 nm premixed” and “100 nm fuel-rich” are shown in while images of soot from other operation points can be found in the Supporting information (Supplementary Figure S5). Comparing the images of “100 nm premixed” and “100 nm fuel-rich” soot of the same mobility diameter, it can be seen that the particles formed in the premixed flame consist of a loose agglomerate structure where the primary particles are clearly distinguishable, while for the soot generated in the fuel-rich flame the primary particles are overlapping and merged. In this case, there is no “neck” between the particles and the primary particles are hardly distinguishable. The “160 nm diffusion” and “75 nm premixed” soot aggregates appear to be quite similar to the “100 nm premixed” aggregates. On the contrary, the particles of 50 nm mobility diameter, whether produced in a diffusion or a premixed flame, are no longer aggregate structures but single spheres.
Figure 3. (a) TEM and (b) HRTEM images of soot particles generated with the set point “100 nm premixed”. (c) TEM and (d) HRTEM of soot particles generated with the set point “100 nm fuel-rich”. The TEM images were recorded with 100,000× magnification (left panels) and the HRTEM images with 700,000× magnification (right panels).
Moreover, soot particles generated at fuel-lean, near-stoichiometric conditions consist of smaller primary particles than their mobility size equivalents generated at fuel-rich conditions. This observation is consistent with previous literature findings. Saffaripour et al. (Citation2017) found the primary particle size to be 70% larger for miniCAST soot particles generated at fuel-rich conditions compared to miniCAST soot generated at fuel-lean conditions. In our study, the primary particle sizes of (12.3 ± 3.7) nm and (15.8 ± 3.5) nm observed for soot particles from the premixed flame and the primary particle size of (26.1 ± 6.3) nm from the near-stoichiometric diffusion flame (see ) are in the same range as particles found in engine exhaust, e.g., 17.2–21.5 nm diameter for aircraft soot (Saffaripour et al. Citation2017), 17–28 nm for diesel engines depending on fuel-to-air ratio and engine speed (Lapuerta, Martos, and Herreros Citation2007) and the mean primary particle size of 13 nm for a EURO IV engine (Su et al. Citation2004).
Lapuerta, Martos, and Herreros (Citation2007) divide the nanostructure of primary particles in four categories: (i) onion-like structures, (ii) turbostratic graphite stacks of undefined orientation, (iii) purely turbostratic layers, and (iv) structures formed by multiple spherical nuclei surrounded by several graphene layers. Thereby the first category is encountered more frequently in diesel emissions. The nanostructure of the generated soot in the present study cannot be easily assigned to one of these categories but seems to be a mixture of these structures. Starting with the “75 nm premixed” and “100 nm premixed” particles, regions with onion-like structures are clearly discernible, but there are also regions in the particles where the graphene layers are rather turbostratic and not concentric. The “100 nm fuel-rich” particles consist mainly of turbostratic structures but extended amorphous structures without identifiable graphene layers are also present. The “160 nm diffusion” soot clearly consists of an onion-like structure. The “50 nm premixed” soot, in contrast, consists mainly of turbostratic structures.
Comparing the results obtained by Raman spectroscopy and HRTEM, it can be concluded that the results are consistent with each other. Both methods reveal higher structural order for the particles generated at near-stoichiometric fuel-lean conditions than for the particles generated at fuel-rich conditions.
3.3. Effective density
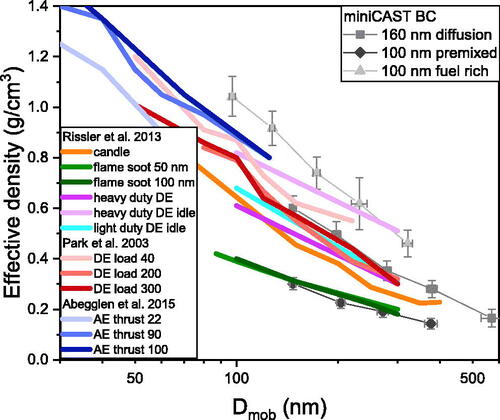
The soot effective density of three of the polydisperse miniCAST operational set points was determined by mass selecting the particles with an APM and then measuring the mobility diameter with an SMPS. displays the calculated effective densities (Equation (1)) as a function of the mobility diameter of the operation points “160 nm diffusion”, “100 nm premixed” and “100 nm fuel-rich” (gray squares, triangles, and rhomboids, respectively). The effective density decreases with particle size from roughly 1.0 g/cm3 for “100 nm fuel-rich” particles to 0.15 g/cm3 for 370 nm premixed or 570 nm diffusion flame particles. This decrease reflects the fact that all of the particle types possess agglomerate structures, and is in agreement with the behavior of diesel soot in the size range 50 to 300 nm (Park et al. Citation2003; Rissler et al. Citation2013). Due to the more compact structure of the smaller particles, their effective density is higher (Park et al. Citation2003). The absolute values of the effective density at a similar mobility diameter are highest for the fuel-rich soot with lower EC/TC mass fraction, and lowest for the premixed soot. This is attributed to the organic material in the fuel-rich soot that fills the agglomerate voids (thus increasing the particle density), and to the larger primary particle size (Mamakos et al. Citation2013; Rissler et al. Citation2013) of the fuel-rich diffusion flame soot compared to the premixed soot as determined by TEM analysis and summarized in . The absolute values of the effective density displayed in are in good agreement with the values reported by Mamakos et al. (Citation2013) for propane soot from miniCAST model 5200 in combination with a catalytic stripper (0.8–0.3 g/cm3 for 100 nm particles to 0.3–0.1 g/cm3 for 300 nm particles depending on the operation point). The results in this study for soot with high EC/TC mass fraction (see ) are in a good agreement with those reported by Rissler et al. (Citation2013) who used a candle and a custom-made propane diffusion flame generator to generate particle distributions centered at 50 and 100 nm (green lines). Rissler et al. studied the flame generator soot in the mobility size range 100 nm to 300 nm, where the particles exhibited low fraction of volatile organics and effective densities of 0.2 g/cm3 for 300 nm particles to 0.4 g/cm3 for the 100 nm particles. For diesel engines (John Deere engine) operated at different loads (red lines in ), Park et al. (Citation2003) determined effective densities of 1–1.2 g/cm3 for 50 nm particles, 0.64–0.73 g/cm3 for 120 nm particles and 0.39–0.55 g/cm3 for 220 nm particles. Particles emitted by a high-duty diesel engine possessed similar effective densities ranging from 0.61 to 0.81 g/cm3 for 100 nm particles and 0.30 to 0.51 g/cm3 for 300 nm particles (Rissler et al. Citation2013). Aircraft exhaust particles under high thrust engine conditions (Abegglen et al. Citation2015) exhibited effective densities of ∼1.35 g/cm3 for ∼40 nm particles down to ∼0.8 g/cm3 for ∼125 nm particles. For lower engine thrust, values of ∼1.15 g/cm3 for ∼40 nm particles to ∼0.7 g/cm3 for ∼75 nm particles were reported. As can be seen from , the soot produced at the set points “160 nm diffusion” and “100 nm fuel-rich” of the miniCAST BC generator simulates well the properties of soot particles emitted by diesel and aircraft engines in terms of effective density and mobility diameter.
Figure 4. Effective density data as a function of the electric mobility diameter Dmob of miniCAST BC polydisperse soot particles generated at the operation points “160 nm diffusion”, “100 nm premixed” and “100 nm fuel-rich”. For comparison, literature data from Rissler et al. (Citation2013), Park et al. (Citation2003), and Abegglen et al. (Citation2015) are also provided. DE and AE stand for diesel and aircraft engine, respectively.
The mass-mobility exponent was determined as the slope from the log-log relationship of the particle mass and the mobility diameter (Park et al. Citation2003; see Supplementary Figure S9 in Section S6 of the Supporting information). The absolute values for the three samples increase from 1.97 ± 0.08 for the operation point “160 nm diffusion” to 2.22 ± 0.05 for the operation point “100 nm premixed” to 2.26 ± 0.05 for the fuel-rich operation point. These values agree well with those reported in the literature for diesel exhaust particles (2.33–2.41; Park et al. Citation2003 and 2.37–2.56; Rissler et al. Citation2013), aircraft exhaust particles at low and high thrust (1.85–2.32 and 2.57–2.79, respectively (Abegglen et al. Citation2015) and propane soot (average value of 2.3; Rissler et al. Citation2013) and indicate diffusion-limited cluster aggregates (Mamakos et al. Citation2013; Park et al. Citation2003; Rissler et al. Citation2013). Considering that lower mass-mobility exponents indicate that the particles are less compact (Park et al. Citation2003), the results agree well with the TEM results which also reveal that the 160 nm particles possess the most fractal structure.
3.4. Optical properties
The optical properties of the soot particles are reported in , and the corresponding values in Supplementary Table S4. The SSA (at 870 nm) was inferred for the polydisperse soot aerosols generated at fuel-rich (“100 nm-”, “75 nm-” and “50 nm fuel-rich”) and near-stoichiometric fuel-lean (“160 nm diffusion”, “100 nm-”, “75 nm-” and “50 nm premixed”) conditions (). The SSA is the ratio of scattering coefficient to extinction coefficient, where the extinction coefficient is the sum of scattering and absorption coefficients. The SSA was inferred from the scattering and extinction coefficients determined with a PAX (wavelength 870 nm). Light scattering and absorption depend on particle size, morphology, composition (i.e. refractive index), and wavelength of the light source (Schnaiter et al. Citation2003). As long as the BC particles are small enough, then absorption and scattering can be explained within the Rayleigh regime. By assuming a spherical geometry, the scattering coefficient is proportional to the squared particle volume and thus to the particle radius to the sixth, while the absorption coefficient is proportional to the particle volume and thus to the particle radius to the third (Moosmüller and Arnott Citation2009). Therefore, the scattering coefficient increases faster with increasing particle size than the absorption coefficient, resulting in a consequent size dependence of the SSA at a fixed refractive index (Moosmüller and Sorensen Citation2018). A more accurate description of scattering and absorption from soot fractal aggregates requires the Rayleigh-Gans-Debye approximation since the coherence assumption of the Rayleigh regime is not valid anymore. In fact, the scattering from a primary particle influences the scattering from the other particles forming the soot aggregate. For a detailed literature review on the involved physical processes and on the available optical descriptions, the reader is referred to Sorensen et al. (Sorensen Citation2001; Sorensen et al. Citation2018). The results herein show that small particles with high EC/TC mass fraction generated at premixed conditions possess an SSA close to zero and that the SSA increases with particle size (see and Supplementary Table S5 in the Supporting information). The particles with GMD of 160 nm, for instance, have a higher SSA of 0.11, despite the high EC/TC mass fraction, because of the larger size and thus larger scattering coefficient (the effect of the primary particle size could not be evaluated). While the SSA remains generally low for particles with high BC content, it increases fast with increasing OC content (Schnaiter et al. Citation2006). With increased OC/TC mass fraction, the particles generated at fuel-rich conditions possess an SSA 6 to 18 times higher than the particles with similar sizes but generated at premixed fuel-lean conditions. The SSA of the soot particles generated at premixed conditions (SSA ≤ 0.03) agrees quite well with the SSA values of about 0.05 (at 630 nm) commonly reported for aircraft emitted soot (Yu et al. Citation2011), while soot particles generated with diffusion flames possess SSA values closer to what has been observed for diesel soot (SSA = 0.17 at 700 nm; Schnaiter et al. Citation2003).
Figure 5. Optical properties (a) SSA870 nm, (b) AAE, and (c) MAC of polydisperse soot particles generated with the miniCAST. In c) the MAC points were evaluated either using the total mass determined by the TEOM (MACtot,870nm) or the rBC mass from the SP2 (MACrBC,870nm, determined only for set point “160 nm diffusion”, empty red square).

The 160 nm particles possess the lowest AAE (1.05 ± 0.02), very close to 1 (). For the three premixed operation points, the AAE is 1.15–1.2 with a slightly higher value for the smallest particles. The absorption manifests a low wavelength dependence, indicating a BC-like composition of soot. In contrast, the AAE of the soot generated at fuel-rich conditions increases with decreasing particle size from 1.73 ± 0.02 (for the “100 nm fuel-rich” particles) to 3.44 ± 0.20 (for the “50 nm fuel-rich” particles) due to the higher fraction of organic material. Since the different particle sizes are generated by increasing the fuel-to-air ratio in the flame, the content of unburned fuel and incompletely carbonized polyaromatic hydrocarbons (PAHs) increases. The higher AAE is thus directly linked to the higher OC/TC mass fraction increasing from 53.3% (for the “100 nm fuel-rich” particles) to 93% (for the “50 nm fuel-rich” particles). This is also visible to the eye as the color of the soot deposited on the filter changes from black to yellow-brownish (the images of the loaded filters are reported as shown in the Supporting information). These results agree well with previous literature findings, where e.g., Schnaiter et al. (Citation2006) found that the AAE of larger soot particles than those investigated here increased from 1 at a C/O ratio of 0.29 in the flame (similar condition as the “160 nm diffusion” operation point of the current study) to 3.5 for a C/O ratio of 0.50 in the flame (close to the “50 nm fuel-rich” operation point). Moreover, the AAE values of the 160 nm particles and the three premixed operation points are in agreement with those reported for diesel engine soot (AAE = 1.1; Schnaiter et al. Citation2003) and soot emitted by aircraft engines (AAE = 0.95–1.13; Yu et al. Citation2011).
The total mass concentration of soot was measured with the TEOM and the EC fraction of the total mass was determined with EC/OC analysis. When using the total aerosol mass determined by TEOM, the MAC870nm, total is highest for the “160 nm near-stoichiometric diffusion flame” particles with a value of 4.3 ± 0.1 m2/g (Supplementary Table S5 and ). The MAC870nm, total for the particles generated at premixed conditions decreases slightly with particle size from 3.3 ± 0.1 m2/g for the “100 nm premixed” particles to 3.0 ± 0.2 m2/g for the “50 nm premixed” particles. For the particles generated at fuel-rich conditions, the MAC870nm, total is lower overall and, again, decreases with decreasing particle size from 2.0 ± 0.1 m2/g (“100 nm fuel-rich”) to 0.3 ± 0.2 m2/g (“50 nm fuel-rich”). This can be attributed to the increasing OC/TC mass fraction and thus the smaller portion of absorbing material in the total particle mass concentration. This trend is in agreement with the findings of Schnaiter et al. (Citation2006) who observed decreasing MAC550nm values from 5.5 to 1.4 m2/g at 550 nm with increasing C/O ratios in the flame (from near-stoichiometric toward fuel-rich conditions; Schnaiter et al. Citation2006). The commonly accepted MAC value for BC suggested by Bond and Bergstrom is 7.5 ± 1.2 m2/g at 550 nm (Bond and Bergstrom Citation2006). The value converted to 870 nm, assuming an AAE equal to 1, is 4.74 ± 0.75 m2/g, in a good agreement with the MAC870nm, total of the “160 nm diffusion” particles.
In a second step, the results from the EC/OC analysis were used to calculate the EC mass concentration from the total TEOM mass concentration and, hence, a MAC870nm, EC based on the EC mass. Since thermal-optical analysis provides only OC mass, this must first be converted to the total mass of organic material. A multiplication factor of 1.6 was assumed in this study as suggested by Aggarwal and Kawamura (Citation2009), since an experimental determination of the OC to OM conversion factor was not possible. Thus, the following relationship was used to obtain EC concentrations from total TEOM concentrations: Total mass (TEOM) = 1.6·OC + EC. The MAC870nm, EC based on the EC fraction of the particles (Supplementary Table S5) is slightly higher than the MAC870nm, total based on the total (TEOM) mass for the particles generated at fuel-lean near-stoichiometric conditions (i.e. “160 nm diffusion” and “100 nm-”, “75 nm-” and “50 nm premixed”) and thus closer to the value suggested by Bond and Bergstrom (Citation2006). The MAC870nm, EC seems to decrease with decreasing particle size but the trend is obscured by the relatively high measurement uncertainties arising from the EC/OC analysis.
Due to detection efficiency limitations, only the rBC mass concentration of the polydisperse soot particles generated with the 160 nm diffusion MiniCAST set point was evaluated with the SP2 ( and Supplementary Table S5). The MACrBC,870nm value is approximately 20% higher than the corresponding value calculated using the total mass from the TEOM, MACTEOM,870nm. As reported in , approximately 10% of the mass of the particles at this set point is OC which is measured by the TEOM but not from the SP2. Considering the EC/TC mass fraction, the TEOM and the SP2 derived MAC870nm agree within the experimental uncertainties.
In order to test the homogeneity of the soot particles in a given polydisperse distribution generated with the miniCAST, several monodisperse particle distributions were selected with an AAC from four miniCAST premixed set points (with EC/TC mass fractions higher than 90% and GMDmob from 112 nm to 160 nm) as shown in Section S8 in the Supporting information. These set points were selected to provide particles with sufficiently large size/mass to be detected with LII method. In order to cope with the SP2 detection range, also most of the monodisperse particle distributions were selected in such a way that the mode was larger than in the original polydisperse distribution. For each of these set points, the effective density showed a decreasing trend with increasing mode of the monodisperse distribution; moreover, for a given mobility diameter we found that the smaller the mode of the polydisperse miniCAST source distribution the lower the absolute effective density, due to a more fractal structure. The AAE of the size-selected particles shows a minor size dependence, characterized by a decreasing trend from 1.2 to 1 with increasing mobility diameter. The AAC size-selected particles possess low SSA values, never exceeding 0.16, and show an increasing trend with increasing mobility diameter. Our results reveal that, for a given mobility diameter, the SSA is inversely proportional to the degree of fractalness, consistent with theoretical expectations. The MACrBC,870nm was evaluated using results from an SP2 and a PAX, showing a virtually constant value of approximately 5.5 m2/g in the size range between 150 and 350 nm of Dmob.
4. Summary and conclusions
The goal of this study was to characterize for the first time the optical properties and morphology of soot particles generated by a prototype miniCAST 5201 BC burner which can be operated both with partially premixed and diffusion flames. This prototype generator forms the basis of the new miniCAST series 5301 which was recently commercialized by Jing Ltd (Dr. Lianpeng Jing, manufacturer, conversation, February 22, 2021). Since the dimensions and overall design of the burner have considerably changed compared to older models, the soot properties had to be determined and mapped against the new operation points. Polydisperse particles with geometric mean mobility diameters of 50 nm, 75 nm, and 100 nm (with a geometric standard deviation between 1.5 and 1.76) were produced with both fuel-rich diffusion flames and fuel-lean near-stoichiometric partially premixed flames. Particles generated with the near-stoichiometric diffusion flame and premixed flame possessed high EC/TC mass fractions of 85–100%, while their size equivalents generated in fuel-rich flames had lower EC/TC mass fractions of 6–50%. The EC/TC mass fraction increased in both cases with increasing particle size. Thanks to the novel premixed flame mode, a high EC/TC mass fraction of 85% at a mobility diameter of 50 nm could be achieved even without thermal treatment, which would not be possible with conventional miniCAST models based on diffusion flames and dilution of propane with nitrogen. High EC/TC (or similarly BC) mass fractions are essential for calibration of engine-exhaust measuring instruments (Durdina et al. Citation2016; Maricq Citation2014; Mamakos et al. Citation2013).
In agreement with current literature, Raman spectroscopy indicated a higher structural order for particles produced at fuel-lean near-stoichiometric conditions than for particles with low EC/TC mass fractions. This finding was confirmed by HRTEM images, which revealed an onion-like or turbostratic layer nanostructure for the particles generated at fuel-lean near-stoichiometric conditions, while the particles with low EC/TC mass fractions possessed a rather amorphous structure. Furthermore, with TEM the primary particle size of the soot aggregates was determined to be 13–20 nm for the particles with high EC/TC mass fractions generated with (fuel-lean) premixed flames. The primary particle size is thus similar to that generated by overall fuel-lean diffusion flames (9–34 nm; Mamakos et al. Citation2013; Saffaripour et al. Citation2017; Ess, Ferry, et al. Citation2016) and within the range observed for soot emitted by real-world engines (Park et al. Citation2003; Su et al. Citation2004; Saffaripour et al. Citation2017). On the contrary, the primary particles of the aggregates with low EC/TC mass fraction were merged, with diameters ranging from 30 nm to 70 nm as expected for soot generated by fuel-rich diffusion (typically >30 nm; Mamakos et al. Citation2013; Saffaripour et al. Citation2017; Ess, Ferry, et al. Citation2016).
The effective density of the soot generated by the miniCAST BC is highest for the particles generated with the fuel-rich diffusion flame and lowest for the particles generated with the premixed flame, if the same particle size is compared. In general, the effective density decreases with particle size within one size distribution from roughly 1.0 g/cm3 (100 nm) to 0.45 g/cm3 (320 nm) for “100 nm fuel-rich” particles and from 0.6 g/cm3 (0.3 g/cm3) at 150 nm to 0.15 g/cm3 at 570 nm (0.15 g/cm3 at 370 nm) for diffusion (premixed) flame particles. This decrease reflects the fact that all of the particles possess agglomerate structures, and is in agreement with the behavior of diesel soot in the size range 50 to 300 nm (Park et al. Citation2003; Rissler et al. Citation2013). Our study shows that the soot produced at the set points “160 nm diffusion” and “100 nm fuel-rich” of the miniCAST BC generator simulates well the effective density of soot particles emitted by heavy/light-duty diesel and aircraft engines, respectively (Rissler et al. Citation2013; Park et al. Citation2003; Abegglen et al. Citation2015). Optical properties were characterized in terms of the AAE, SSA, and MAC. The particles generated in the near-stoichiometric diffusion flame had low AAE (1.05) and SSA (0.1) and exhibited the highest MAC870, total of 4.3 m2/g at a wavelength of 870 nm (calculated from photoacoustic absorption coefficient and total particle mass). The particles formed in the fuel-lean premixed flames had slightly higher AAE (0.15–0.2), much lower SSA (0.01–0.03), and MAC870, total values of 3.0–3.3 m2/g, which are within the average range of MAC(870 nm) reported in the literature for BC particles (Bond and Bergstrom Citation2006) and similar to those observed for diesel and aircraft engine soot (Schnaiter et al. Citation2003; Elser et al. Citation2019). Under fuel-lean conditions, the increased OC/TC mass fractions led to higher AAE (1.7–3.4), higher SSA (∼0.2), and lower MAC870, total values (0.3–2 m2/g; this lower MAC is related to higher relative contribution of non-graphite-like carbonaceous matter to total particle mass).
To summarize, the results obtained from this study indicate that the miniCAST BC is a versatile soot source, able to produce particles of various sizes and compositions in a stable and reproducible manner. Particles from 50 nm to 160 nm generated at fuel-lean or near-stoichiometric conditions are highly absorbing, with a high EC fraction and primary particle size close to that of diesel car exhaust particles. These operation set points are therefore well suited for the calibration of BC diagnostic instruments and engine exhaust particle counters. Particles generated at fuel-rich conditions, although not necessarily representative of atmospheric soot particles, could still be used to test instrument responses to particles of the same size but different optical properties.
Supplemental Material
Download PDF (2.6 MB)Acknowledgment
METAS would like to thank Dr. Johann Michler (Laboratory of Mechanics of Materials and Nanostructures at EMPA, Thun, Switzerland) for providing access to their Raman facility. The TEM and HRTEM images were recorded at the Microscopy Imaging Center at the University of Bern, Switzerland. We thank Marek Kaminek for performing the measurements.
Additional information
Funding
Notes
1 Due to the high temperatures reached in premixed flames, the miniCAST 5201 Type BC is equipped with a fan to cool down the housing of the burner. Operating conventional miniCAST burners in air-premix mode simply by replacing the "mixing nitrogen for propane" with "mixing air for propane" is not advisable.
References
- Abegglen, M., L. Durdina, B. T. Brem, J. Wang, T. Rindlisbacher, J. C. Corbin, U. Lohmann, and B. Sierau. 2015. Effective density and mass-mobility exponents of particulate matter in aircraft turbine exhaust: Dependence on engine thrust and particle size. J. Aerosol Sci. 88: 135–47. doi: https://doi.org/10.1016/j.jaerosci.2015.06.003.
- Aggarwal, S. G., and K. Kawamura. 2009. Carbonaceous and inorganic composition in long-range transported aerosols over northern Japan: Implication for aging of water-soluble organic fraction. Atmos. Environ. 43 (16):2532–40. doi: https://doi.org/10.1016/j.atmosenv.2009.02.032.
- Aiken, A. C., G. R. Mcmeeking, E. J. T. Levin, M. K. Dubey, P. J. Demott, and S. M. Kreidenweis. 2016. Quantification of online removal of refractory black carbon using laser-induced incandescence in the single particle soot photometer. Aerosol Sci. Technol. 50 (7):679–92. doi: https://doi.org/10.1080/02786826.2016.1173647.
- Baumgardner, D., O. Popovicheva, J. Allan, V. Bernardoni, J. Cao, F. Cavalli, J. Cozic, E. Diapouli, K. Eleftheriadis, P. J. Genberg, et al. 2012. Soot reference materials for instrument calibration and intercomparisons: A workshop summary with recommendations. Atmos. Meas. Tech. 5 (8):1869–87. doi: https://doi.org/10.5194/amt-5-1869-2012.
- Bescond, A., J. Yon, F. X. Ouf, C. Rozé, A. Coppalle, P. Parent, D. Ferry, and C. Laffon. 2016. Soot optical properties determined by analyzing extinction spectra in the visible near-UV: Toward an optical speciation according to constituents and structure. J. Aerosol Sci. 101: 118–32. doi: https://doi.org/10.1016/j.jaerosci.2016.08.001.
- Birch, M. E., and R. A. Cary. 1996. Elemental carbon-based method for monitoring occupational exposures to particulate diesel exhaust. Aerosol Sci. Technol. 25 (3):221–41. doi: https://doi.org/10.1080/02786829608965393.
- Bischof, O. F. 2015. Recent developments in the measurement of low particulate emissions from mobile sources: A review of particle number legislations. Emiss. Control Sci. Technol. 1 (2):203–12. doi: https://doi.org/10.1007/s40825-015-0016-9.
- Bond, T. C., and R. W. Bergstrom. 2006. Light absorption by carbonaceous particles: An investigative review. Aerosol Sci. Technol. 40 (1):27–67. doi: https://doi.org/10.1080/02786820500421521.
- Bond, T. C., S. J. Doherty, D. W. Fahey, P. M. Forster, T. Berntsen, B. J. Deangelo, M. G. Flanner, S. Ghan, B. Kärcher, D. Koch, et al. 2013. Bounding the role of black carbon in the climate system: A scientific assessment. J. Geophys. Res. Atmos. 118 (11):5380–552. doi: https://doi.org/10.1002/jgrd.50171.
- Braun, A., F. E. Huggins, A. Kubátová, S. Wirick, M. M. Maricq, B. S. Mun, J. D. Mcdonald, K. E. Kelly, N. Shah, and G. P. Huffman. 2008. Toward distinguishing woodsmoke and diesel exhaust in ambient particulate matter. Environ. Sci. Technol. 42 (2):374–80. doi: https://doi.org/10.1021/es071260k.
- Burtscher, H., T. Lutz, and A. Mayer. 2019. A new periodic technical inspection for particle emissions of vehicles. Emiss. Control Sci. Technol. 5 (3):279–87. doi: https://doi.org/10.1007/s40825-019-00128-z.
- Caroca, J. C., F. Millo, D. Vezza, T. Vlachos, A. De Filippo, S. Bensaid, N. Russo, and D. Fino. 2011. Detailed investigation on soot particle size distribution during DPF regeneration, using standard and bio-diesel fuels. Ind. Eng. Chem. Res. 50 (5):2650–8. doi: https://doi.org/10.1021/ie1006799.
- Cassee, F. R., M. E. Héroux, M. E. Gerlofs-Nijland, and F. J. Kelly. 2013. Particulate matter beyond mass: Recent health evidence on the role of fractions, chemical constituents and sources of emission. Inhal. Toxicol. 25 (14):802–12. doi: https://doi.org/10.3109/08958378.2013.850127.
- Cauda, E. G., B. K. Ku, A. L. Miller, and T. L. Barone. 2012. Toward developing a new occupational exposure metric approach for characterization of diesel aerosols. Aerosol Sci. Technol. 46 (12):1370–81. doi: https://doi.org/10.1080/02786826.2012.715781.
- Cavalli, F., M. Viana, K. E. Yttri, J. Genberg, and J. P. Putaud. 2010. Toward a standardised thermal-optical protocol for measuring atmospheric organic and elemental carbon: The EUSAAR protocol. Atmos. Meas. Tech. 3 (1):79–89. doi: https://doi.org/10.5194/amt-3-79-2010.
- Chen, L., Q. Li, D. Wu, H. Sun, Y. Wei, X. Ding, H. Chen, T. Cheng, and J. Chen. 2019. Size distribution and chemical composition of primary particles emitted during open biomass burning processes: Impacts on cloud condensation nuclei activation. Sci. Total Environ. 674:179–88. doi: https://doi.org/10.1016/j.scitotenv.2019.03.419.
- Collaud Coen, M., E. Weingartner, A. Apituley, D. Ceburnis, R. Fierz-Schmidhauser, H. Flentje, J. S. Henzing, S. G. Jennings, M. Moerman, A. Petzold, et al. 2010. Minimizing light absorption measurement artifacts of the Aethalometer: Evaluation of five correction algorithms. Atmos. Meas. Tech. 3 (2):457–74. doi: https://doi.org/10.5194/amt-3-457-2010.
- Commodo, M., G. De Falco, A. Bruno, C. Borriello, P. Minutolo, and A. D’Anna. 2015. Physicochemical evolution of nascent soot particles in a laminar premixed flame: From nucleation to early growth. Combust. Flame 162 (10):3854–63. doi: https://doi.org/10.1016/j.combustflame.2015.07.022.
- Corbin, J. C., H. Czech, D. Massabò, F. B. de Mongeot, G. Jakobi, F. Liu, P. Lobo, C. Mennucci, A. A. Mensah, and J. Orasche. 2019. Infrared-absorbing carbonaceous tar can dominate light absorption by marine-engine exhaust. Npj Clim. Atmos. Sci. 2 (1):1–12. doi: https://doi.org/10.1038/s41612-019-0069-5.
- Dippel, B., H. Jander, and J. Heintzenberg. 1999. NIR FT Raman spectroscopic study of flame soot. Phys. Chem. Chem. Phys. 1 (20):4707–12. doi: https://doi.org/10.1039/a904529e.
- Drinovec, L., G. Močnik, P. Zotter, A. S. H. Prévôt, C. Ruckstuhl, E. Coz, M. Rupakheti, J. Sciare, T. Müller, A. Wiedensohler, et al. 2015. The “dual-spot” aethalometer: An improved measurement of aerosol black carbon with real-time loading compensation. Atmos. Meas. Tech. 8 (5):1965–79. doi: https://doi.org/10.5194/amt-8-1965-2015.
- Durdina, L., P. Lobo, M. B. Trueblood, E. A. Black, S. Achterberg, D. E. Hagen, B. T. Brem, and J. Wang. 2016. Response of real-time black carbon mass instruments to mini-CAST soot. Aerosol Sci. Technol. 50 (9):906–18. doi: https://doi.org/10.1080/02786826.2016.1204423.
- Eidgenössisches Justiz- und Polizeidepartement EJPD. 2018. Verordnung des EJPD über Abgasmessgeräte für Verbrennungsmotoren (VAMV). Bern, Switzerland: Eidgenössisches Justiz- und Polizeidepartement EJPD.
- Elser, M., B. T. Brem, L. Durdina, D. Schönenberger, F. Siegerist, A. Fischer, and J. Wang. 2019. Chemical composition and radiative properties of nascent particulate matter emitted by an aircraft turbofan burning conventional and alternative fuels. Atmos. Chem. Phys. 19 (10):6809–20. doi: https://doi.org/10.5194/acp-19-6809-2019.
- Ess, M. N., H. Bladt, W. Mühlbauer, S. I. Seher, C. Zöllner, S. Lorenz, D. Brüggemann, U. Nieken, N. P. Ivleva, and R. Niessner. 2016. Reactivity and structure of soot generated at varying biofuel content and engine operating parameters. Combust. Flame 163:157–69. doi: https://doi.org/10.1016/j.combustflame.2015.09.016.
- Ess, M. N., D. Ferry, E. D. Kireeva, R. Niessner, F. X. Ouf, and N. P. Ivleva. 2016. In situ Raman microspectroscopic analysis of soot samples with different organic carbon content: Structural changes during heating. Carbon 105:572–85. doi: https://doi.org/10.1016/j.carbon.2016.04.056.
- Ess, M. N., and K. Vasilatou. 2019. Characterization of a new miniCAST with diffusion flame and premixed flame options: Generation of particles with high EC content in the size range 30 nm to 200 nm. Aerosol Sci. Technol. 53 (1):29–44. doi: https://doi.org/10.1080/02786826.2018.1536818.
- European Commission. 2017. Commission Regulation (EU) 2017/1151 of 1 June 2017 supplementing Regulation (EC) No 715/2007 of the European Parliament and of the Council on type-approval of motor vehicles with respect to emissions from light passenger and commercial vehicles (Euro 5a). Off. J. Eur. Union L175:1–643.
- Ferrari, A. C., and J. Robertson. 2000. Interpretation of Raman spectra of disordered and amorphous carbon. Phys. Rev. B. 61 (20):14095–107.14095. doi: https://doi.org/10.1103/PhysRevB.61.
- Ghazi, R., H. Tjong, A. Soewono, S. N. Rogak, and J. S. Olfert. 2013. Mass, mobility, volatility, and morphology of soot particles generated by a McKenna and inverted burner. Aerosol Sci. Technol. 47 (4):395–405. doi: https://doi.org/10.1080/02786826.2012.755259.
- Giechaskiel, B. 2018. Real driving emissions (RDE): Particle number (PN) portable measurement systems (PEMS) calibration. EUR 29036 EN, Publications Office of the European Union, Luxembourg, 2018, ISBN 978-92-79-77482-9 (online), 978-92-79-77483-6 (print), doi: https://doi.org/10.2760/553725.(online), https://doi.org/10.2760/852733 (print), JRC110424.
- Gilliam, J. H., and E. S. Hall. 2016. Reference and equivalent methods used to measure National Ambient Air Quality Standards (NAAQS) criteria air pollutants. Vol. 1. EPA/600/R-16/139, U.S. Environmental Protection Agency, Washington, DC.
- Gysel, M., M. Laborde, J. S. Olfert, R. Subramanian, and A. J. Gröhn. 2011. Effective density of Aquadag and fullerene soot black carbon reference materials used for SP2 calibration. Atmos. Meas. Tech. 4 (12):2851–8. doi: https://doi.org/10.5194/amt-4-2851-2011.
- Hays, M. D., and R. L. Vander Wal. 2007. Heterogeneous soot nanostructure in atmospheric and combustion source aerosols. Energy Fuels 21 (2):801–11. doi: https://doi.org/10.1021/ef060442h.
- Hebisch, R., D. Dabill, D. Dahmann, F. Diebold, N. Geiregat, R. Grosjean, M. Mattenklott, V. Perret, and M. Guillemin. 2003. Sampling and analysis of carbon in diesel exhaust particulates-an international comparison. Int. Arch. Occup. Environ. Health 76 (2):137–42. doi: https://doi.org/10.1007/s00420-002-0386-5.
- Helsper, C., W. Mölter, F. Löffler, C. Wadenpohl, S. Kaufmann, and G. Wenninger. 1993. Investigations of a new aerosol qenerator for the production of carbon aggregate particles. Atmos. Environ. Part A, Gen. Top. 27 (8):1271–5. doi: https://doi.org/10.1016/0960-1686(93)90254-V.
- Jawhari, T., A. Roid, and J. Casado. 1995. Raman spectroscopic characterization of some commercially available carbon black materials. Carbon 33 (11):1561–5. doi: https://doi.org/10.1016/0008-6223(95)00117-V.
- Johnson, T. J., M. Irwin, J. P. R. Symonds, J. S. Olfert, and A. M. Boies. 2018. Measuring aerosol size distributions with the aerodynamic aerosol classifier. Aerosol Sci. Technol. 52 (6):655–65. doi: https://doi.org/10.1080/02786826.2018.1440063.
- Kagawa, J. 2002. Health effects of diesel exhaust emissions – A mixture of air pollutants of worldwide concern. Toxicology 181–182:349–53. doi: https://doi.org/10.1016/S0300-483X(02)00461-4.
- Kastelis, N., and E. Zervas. 2008. Analysis of flat burners used to study gaseous pollutants emitted from combustion of hydrocarbons. Paper presented at the 2nd International Conference on Waste Management, Water Pollution, Air Pollution, Indoor Climate (WWAI’08), Corfu, Greece, October 26–28, 251–6.
- Kazemimanesh, M., A. Moallemi, K. Thomson, G. Smallwood, P. Lobo, and J. S. Olfert. 2019. A novel miniature inverted-flame burner for the generation of soot nanoparticles. Aerosol Sci. Technol. 53 (2):184–95. doi: https://doi.org/10.1080/02786826.2018.1556774.
- Kim, J., H. Bauer, T. Dobovičnik, R. Hitzenberger, D. Lottin, D. Ferry, and A. Petzold. 2015. Assessing optical properties and refractive index of combustion aerosol particles through combined experimental and modeling studies. Aerosol Sci. Technol. 49 (5):340–50. doi: https://doi.org/10.1080/02786826.2015.1020996.
- Kirchstetter, T. W., T. Novakov, and P. V. Hobbs. 2004. Evidence that the spectral dependence of light absorption by aerosols is affected by organic carbon. J. Geophys. Res. 109 (D21):1–12. doi: https://doi.org/10.1029/2004JD004999.
- Klimont, Z., K. Kupiainen, C. Heyes, P. Purohit, J. Cofala, P. Rafaj, J. Borken-Kleefeld, and W. Schöpp. 2017. Global anthropogenic emissions of particulate matter including black carbon. Atmos. Chem. Phys. 17 (14):8681–723. doi: https://doi.org/10.5194/acp-17-8681-2017.
- Koch, D., and A. D. Del Genio. 2010. Black carbon semi-direct effects on cloud cover: Review and synthesis. Atmos. Chem. Phys. 10 (16):7685–96. doi: https://doi.org/10.5194/acp-10-7685-2010.
- Kulkarni, P., P. A. Baron, C. M. Sorensen, and M. Harper. 2011. Nonspherical particle measurement: Shape factor, fractals, and fibers. In Aerosol measurement: Principles, techniques, and applications, ed. P. Kulkarni, P. A. Baron, and K. Willeke, 509–47. Hoboken, NJ: John Wiley & Sons.
- Laborde, M., P. Mertes, P. Zieger, J. Dommen, U. Baltensperger, and M. Gysel. 2012. Sensitivity of the single particle soot photometer to different black carbon types. Atmos. Meas. Tech. 5 (5):1031–43. doi: https://doi.org/10.5194/amt-5-1031-2012.
- Laborde, M., M. Schnaiter, C. Linke, H. Saathoff, K.-H. Naumann, O. Möhler, S. Berlenz, U. Wagner, J. W. Taylor, D. Liu, et al. 2012. Single particle soot photometer intercomparison at the AIDA chamber. Atmos. Meas. Tech. 5 (12):3077–97. doi: https://doi.org/10.5194/amtd-5-3519-2012.
- Lapuerta, M., F. J. Martos, and J. M. Herreros. 2007. Effect of engine operating conditions on the size of primary particles composing diesel soot agglomerates. J. Aerosol Sci. 38 (4):455–66. doi: https://doi.org/10.1016/j.jaerosci.2007.02.001.
- Linke, C., I. Ibrahim, N. Schleicher, R. Hitzenberger, M. O. Andreae, T. Leisner, and M. Schnaiter. 2016. A novel single-cavity three-wavelength photoacoustic spectrometer for atmospheric aerosol research. Atmos. Meas. Tech. 9 (11):5331–46. doi: https://doi.org/10.5194/amt-9-5331-2016.
- Liu, C., C. E. Chung, Y. Yin, and M. Schnaiter. 2018. The absorption Ångström exponent of black carbon: From numerical aspects. Atmos. Chem. Phys. 18 (9):6259–73. doi: https://doi.org/10.5194/acp-18-6259-2018.
- Liu, Y., C. Liu, J. Ma, Q. Ma, and H. He. 2010. Structural and hygroscopic changes of soot during heterogeneous reaction with O3. Phys. Chem. Chem. Phys. 12 (36):10896–903. doi: https://doi.org/10.1039/c0cp00402b.
- Lu, T., Z. Huang, C. S. Cheung, and J. Ma. 2012. Size distribution of EC, OC and particle-phase PAHs emissions from a diesel engine fueled with three fuels. Sci Total Environ. 438:33–41. doi: https://doi.org/10.1016/j.scitotenv.2012.08.026.
- Mader, B. T., J. J. Schauer, J. H. Seinfeld, R. C. Flagan, J. Z. Yu, H. Yang, H. J. Lim, B. J. Turpin, J. T. Deminter, G. Heidemann, et al. 2003. Sampling methods used for the collection of particle-phase organic and elemental carbon during ACE-Asia. Atmos. Environ. 37 (11):1435–49. doi: https://doi.org/10.1016/S1352-2310(02)01061-0.
- Malmborg, V. B., A. C. Eriksson, S. Török, Y. Zhang, K. Kling, J. Martinsson, E. C. Fortner, L. Gren, S. Kook, T. B. Onasch, et al. 2019. Relating aerosol mass spectra to composition and nanostructure of soot particles. Carbon 142:535–46. doi: https://doi.org/10.1016/j.carbon.2018.10.072.
- Mamakos, A., I. Khalek, R. Giannelli, and M. Spears. 2013. Characterization of combustion aerosol produced by a mini-CAST and treated in a catalytic stripper. Aerosol Sci. Technol. 47 (8):927–36. doi: https://doi.org/10.1080/02786826.2013.802762.
- Maricq, M. M. 2007. Chemical characterization of particulate emissions from diesel engines: A review. J. Aerosol Sci. 38 (11):1079–118. doi: https://doi.org/10.1016/j.jaerosci.2007.08.001.
- Maricq, M. M. 2014. Examining the relationship between black carbon and soot in flames and engine exhaust. Aerosol Sci. Technol. 48 (6):620–9. doi: https://doi.org/10.1080/02786826.2014.904961.
- McMurry, P. H. 2000. A review of atmospheric aerosol measurements. Atmos. Environ. 34 (12–14):1959–99. doi: https://doi.org/10.1016/S1352-2310(99)00455-0.
- Moallemi, A., M. Kazemimanesh, J. C. Corbin, K. Thomson, G. Smallwood, J. S. Olfert, and P. Lobo. 2019. Characterization of black carbon particles generated by a propane-fueled miniature inverted soot generator. J. Aerosol Sci. 135: 46–57. doi: https://doi.org/10.1016/j.jaerosci.2019.05.004.
- Moore, R. H., L. D. Ziemba, D. Dutcher, A. J. Beyersdorf, K. Chan, S. Crumeyrolle, T. M. Raymond, K. L. Thornhill, E. L. Winstead, and B. E. Anderson. 2014. Mapping the operation of the miniature combustion aerosol standard (mini-CAST) soot generator. Aerosol Sci. Technol. 48 (5):467–79. doi: https://doi.org/10.1080/02786826.2014.890694.
- Moosmüller, H., and W. P. Arnott. 2009. Particle optics in the Rayleigh regime. J Air Waste Manag Assoc. 59 (9):1028–31. doi: https://doi.org/10.3155/1047-3289.59.9.1028.
- Moosmüller, H., and C. M. Sorensen. 2018. Small and large particle limits of single scattering albedo for homogeneous, spherical particles. J. Quant. Spectrosc. Radiat. Transfer 204:250–5. doi: https://doi.org/10.1016/j.jqsrt.2017.09.029.
- Moteki, N., and Y. Kondo. 2007. Effects of mixing state on black carbon measurements by laser-induced incandescence. Aerosol Sci. Technol. 41 (4):398–417. doi: https://doi.org/10.1080/02786820701199728.
- Moteki, N., and Y. Kondo. 2010. Dependence of laser-induced incandescence on physical properties of black carbon aerosols: Measurements and theoretical interpretation. Aerosol Sci. Technol. 44 (8):663–75. doi: https://doi.org/10.1080/02786826.2010.484450.
- Müller, T., J. S. Henzing, G. de Leeuw, A. Wiedensohler, A. Alastuey, H. Angelov, M. Bizjak, M. Collaud Coen, J. E. Engström, C. Gruening, et al. 2011. Characterization and intercomparison of aerosol absorption photometers: Result of two intercomparison workshops. Atmos. Meas. Tech. 4 (2):245–68. doi: https://doi.org/10.5194/amt-4-245-2011.
- Nakayama, T., H. Suzuki, S. Kagamitani, Y. Ikeda, A. Uchiyama, and Y. Matsumi. 2015. Characterization of a three wavelength photoacoustic soot spectrometer (PASS-3) and a photoacoustic extinctiometer (PAX). J. Meteorol. Soc. Japan 93 (2):285–308. doi: https://doi.org/10.2151/jmsj.2015-016.
- Niessner, R. 2014. The many faces of soot: Characterization of soot nanoparticles produced by engines. Angew. Chem. Int. Ed. Engl. 53 (46):12366–79. doi: https://doi.org/10.1002/anie.201402812.
- Parent, P., C. Laffon, I. Marhaba, D. Ferry, T. Z. Regier, I. K. Ortega, B. Chazallon, Y. Carpentier, and C. Focsa. 2016. Nanoscale characterization of aircraft soot: A high-resolution transmission electron microscopy, Raman spectroscopy, X-ray photoelectron and near-edge X-ray absorption spectroscopy study. Carbon 101:86–100. doi: https://doi.org/10.1016/j.carbon.2016.01.040.
- Park, K., F. Cao, D. B. Kittelson, and P. H. Mcmurry. 2003. Relationship between particle mass and mobility for diesel exhaust particles. Environ. Sci. Technol. 37 (3):577–83. doi: https://doi.org/10.1021/es025960v.
- Patashnick, H., and E. G. Rupprecht. 1991. Continuous pm-10 measurements using the tapered element oscillating microbalance. J. Air Waste Manag. Assoc. 41 (8):1079–83. doi: https://doi.org/10.1080/10473289.1991.10466903.
- Patel, M., C. L. Azanza Ricardo, P. Scardi, and P. B. Aswath. 2012. Morphology, structure and chemistry of extracted diesel soot - Part I: Transmission electron microscopy, Raman spectroscopy, X-ray photoelectron spectroscopy and synchrotron X-ray diffraction study. Tribol. Int. 52:29–39. doi: https://doi.org/10.1016/j.triboint.2012.03.004.
- Petzold, A., J. A. Ogren, M. Fiebig, P. Laj, S.-M. Li, U. Baltensperger, T. Holzer-Popp, S. Kinne, G. Pappalardo, and N. Sugimoto. 2013. Recommendations for the interpretation of “black carbon” measurements. Atmos. Chem. Phys. 13 (4):9485–517. doi: https://doi.org/10.5194/acpd-13-9485-2013.
- Pileci, R. E., R. L. Modini, M. Bertò, J.-F. Yuan, J. C. Corbin, A. Marinoni, B. Henzing, M. M. Moerman, J. P. Putaud, G. Spindler, et al. 2021. Comparison of co-located rBC and EC mass concentration measurements during field campaigns at several European sites. Atmos. Meas. Tech. 14:1379–1403. doi: https://doi.org/10.5194/amt-14-1379-2021.
- Puzun, A., S. Wanchen, L. Guoliang, T. Manzhi, L. Chunjie, and C. Shibao. 2011. Characteristics of particle size distributions about emissions in a common-rail diesel engine with biodiesel blends. Procedia Environ. Sci. 11 (C):1371–8. doi: https://doi.org/10.1016/j.proenv.2011.12.206.
- R’mili, B., O. L. C. Le Bihan, C. Dutouquet, O. Aguerre-Charriol, and E. Frejafon. 2013. Particle sampling by TEM grid filtration. Aerosol Sci. Technol. 47 (7):767–75. doi: https://doi.org/10.1080/02786826.2013.789478.
- Ramanathan, V., and G. Carmichael. 2008. Global and regional climate changes due to black carbon. Nature Geosci. 1 (4):221–7. doi: https://doi.org/10.1038/ngeo156.
- Reid, J. S., R. Koppmann, T. F. Eck, and D. P. Eleuterio. 2004. A review of biomass burning emissions, part II: Intensive physical properties of biomass burning particles. Atmos. Chem. Phys. 4 (5):5135–200. doi: https://doi.org/10.5194/acpd-4-5135-2004.
- Rissler, J., M. E. Messing, A. I. Malik, P. T. Nilsson, E. Z. Nordin, M. Bohgard, M. Sanati, and J. H. Pagels. 2013. Effective density characterization of soot agglomerates from various sources and comparison to aggregation theory. Aerosol Sci. Technol. 47 (7):792–805. doi: https://doi.org/10.1080/02786826.2013.791381.
- Sadezky, A., H. Muckenhuber, H. Grothe, R. Niessner, and U. Pöschl. 2005. Raman microspectroscopy of soot and related carbonaceous materials: Spectral analysis and structural information. Carbon 43 (8):1731–42. doi: https://doi.org/10.1016/j.carbon.2005.02.018.
- Saffaripour, M., L.-L. Tay, K. A. Thomson, G. J. Smallwood, B. T. Brem, L. Durdina, and M. Johnson. 2017. Raman spectroscopy and TEM characterization of solid particulate matter emitted from soot generators and aircraft turbine engines. Aerosol Sci. Technol. 51 (4):518–31. doi: https://doi.org/10.1080/02786826.2016.1274368.
- Saito, R., M. Hofmann, G. Dresselhaus, A. Jorio, and M. S. Dresselhaus. 2011. Raman spectroscopy of graphene and carbon nanotubes. Adv. Phys. 60 (3):413–550. doi: https://doi.org/10.1080/00018732.2011.582251.
- Schmid, J., B. Grob, R. Niessner, and N. P. Ivleva. 2011. Multiwavelength Raman microspectroscopy for rapid prediction of soot oxidation reactivity. Anal. Chem. 83 (4):1173–9. doi: https://doi.org/10.1021/ac102939w.
- Schnaiter, M., M. Gimmler, I. Llamas, C. Linke, C. Jäger, and H. Mutschke. 2006. Strong spectral dependence of light absorption by organic carbon particles formed by propane combustion. Atmos. Chem. Phys. 6 (10):2981–90. doi: https://doi.org/10.5194/acp-6-2981-2006.
- Schnaiter, M., H. Horvath, O. Möhler, K. H. Naumann, H. Saathoff, and O. W. Schöck. 2003. UV-VIS-NIR spectral optical properties of soot and soot-containing aerosols. J. Aerosol Sci. 34 (10):1421–44. doi: https://doi.org/10.1016/S0021-8502(03)00361-6.
- Schwarz, J. P., R. S. Gao, D. W. Fahey, D. S. Thomson, L. A. Watts, J. C. Wilson, J. M. Reeves, M. Darbeheshti, D. G. Baumgardner, G. L. Kok, et al. 2006. Single-particle measurements of midlatitude black carbon and light-scattering aerosols from the boundary layer to the lower stratosphere. J. Geophys. Res. 111 (D16):1–15. doi: https://doi.org/10.1029/2006JD007076.
- Sorensen, C. M. 2001. Light scattering by fractal aggregates: A review. Aerosol Sci. Technol. 35:648–687. doi: https://doi.org/10.1080/02786820117868.
- Sorensen, C. M., J. Yon, F. Liu, J. Maughan, W. R. Heinson, and M. J. Berg. 2018. Light scattering and absorption by fractal aggregates including soot. J. Quant. Spectrosc. Radiat. Transfer 217:459–73. doi: https://doi.org/10.1016/j.jqsrt.2018.05.016.
- Stephens, M., N. Turner, and J. Sandberg. 2003. Particle identification by laser-induced incandescence in a solid-state laser cavity. Appl. Opt. 42 (19):3726–36. doi: https://doi.org/10.1364/AO.42.003726.
- Stipe, C. B., B. S. Higgins, D. Lucas, C. P. Koshland, and R. F. Sawyer. 2005. Inverted co-flow diffusion flame for producing soot. Rev. Sci. Instrum. 76 (2):023908. doi: https://doi.org/10.1063/1.1851492.
- Su, D. S., J.-O. Müller, R. E. Jentoft, D. Rothe, E. Jacob, and R. Schlögl. 2004. Fullerene-like soot from EuroIV diesel engine: Consequences for catalytic automotive pollution control. Top. Catal. 30/31:241–5. doi: https://doi.org/10.1023/B:TOCA.0000029756.50941.02.
- Tavakoli, F., and J. S. Olfert. 2014. Determination of particle mass, effective density, mass-mobility exponent, and dynamic shape factor using an aerodynamic aerosol classifier and a differential mobility analyzer in tandem. J. Aerosol Sci. 75:35–42. doi: https://doi.org/10.1016/j.jaerosci.2014.04.010.
- Török, S., V. B. Malmborg, J. Simonsson, A. Eriksson, J. Martinsson, M. Mannazhi, J. Pagels, and P.-E. Bengtsson. 2018. Investigation of the absorption Ångström exponent and its relation to physicochemical properties for mini-CAST soot. Aerosol Sci. Technol. 52 (7):757–67.67. doi: https://doi.org/10.1080/02786826.2018.1457.
- Tuinstra, F., and J. L. Koenig. 1970. Raman Spectrum of Graphite. J. Chem. Phys. 53 (3):1126–30. doi: https://doi.org/10.1063/1.1674108.
- Vander Wal, R. L., V. M. Bryg, and M. D. Hays. 2010. Fingerprinting soot (towards source identification): Physical structure and chemical composition. J. Aerosol Sci. 41 (1):108–17. doi: https://doi.org/10.1016/j.jaerosci.2009.08.008.
- Virkkula, A. 2010. Correction of the calibration of the 3-wavelength particle soot absorption photometer (3λ PSAP). Aerosol Sci. Technol. 44 (8):706–12. doi: https://doi.org/10.1080/02786826.2010.482110.
- Wang, Y., D. C. Alsmeyer, and R. L. McCreery. 1990. Raman spectroscopy of carbon materials: Structural basis of observed spectra. Chem. Mater. 2 (5):557–63. doi: https://doi.org/https://doi.org/10.1021/cm00011a018.
- Weingartner, E., H. Saathoff, M. Schnaiter, N. Streit, B. Bitnar, and U. Baltensperger. 2003. Absorption of light by soot particles: Determination of the absorption coefficient by means of aethalometers. J. Aerosol Sci. 34 (10):1445–63. doi: https://doi.org/10.1016/S0021-8502(03)00359-8.
- Wierzbicka, A., P. T. Nilsson, J. Rissler, G. Sallsten, Y. Xu, J. H. Pagels, M. Albin, K. Österberg, B. Strandberg, A. Eriksson, et al. 2014. Detailed diesel exhaust characteristics including particle surface area and lung deposited dose for better understanding of health effects in human chamber exposure studies. Atmos. Environ. 86:212–9. doi: https://doi.org/10.1016/j.atmosenv.2013.11.025.
- Yu, Z., L. D. Ziemba, T. B. Onasch, S. C. Herndon, S. E. Albo, R. Miake-Lye, B. E. Anderson, P. L. Kebabian, and A. Freedman. 2011. Direct measurement of aircraft engine soot emissions using a cavity-attenuated phase shift (CAPS)-based extinction monitor. Aerosol Sci. Technol. 45 (11):1319–25. doi: https://doi.org/10.1080/02786826.2011.592873.
- Zanatta, M., M. Gysel, N. Bukowiecki, T. Müller, E. Weingartner, H. Areskoug, M. Fiebig, K. E. Yttri, N. Mihalopoulos, G. Kouvarakis, et al. 2016. A European aerosol phenomenology-5: Climatology of black carbon optical properties at 9 regional background sites across Europe. Atmos. Environ. 145:346–64. doi: https://doi.org/10.1016/j.atmosenv.2016.09.035.
- Zickler, G. A., B. Smarsly, N. Gierlinger, H. Peterlik, and O. Paris. 2006. A reconsideration of the relationship between the crystallite size La of carbons determined by X-ray diffraction and Raman spectroscopy. Carbon 44 (15):3239–46. doi: https://doi.org/10.1016/j.carbon.2006.06.029.
- Zotter, P., H. Herich, M. Gysel, I. El-Haddad, Y. Zhang, G. Mocnik, C. Hüglin, U. Baltensperger, S. Szidat, and A. S. H. Prévôt. 2017. Evaluation of the absorption Ångström exponents for traffic and wood burning in the Aethalometer-based source apportionment using radiocarbon measurements of ambient aerosol. Atmos. Chem. Phys. 17 (6):4229–49. doi: https://doi.org/10.5194/acp-17-4229-2017.