
Abstract
Particle size and particle composition are two important variables that potentially affect the performance of low-cost sensors that quantify airborne particle concentrations. In order to investigate how these sensors respond to particles of varying size and composition, we conducted controlled laboratory experiments studying the Plantower PMS5003 sensor and four integrated devices containing Plantower sensors. We challenged the sensors with five particle sources, and for a subset of these sources, we conducted experiments with monodisperse particles ranging between 100 nm and 700 nm. Our results suggest that different sources affect the sensors’ accuracy in their reported particle mass concentration, and this effect on the sensors’ performances appears to be driven by particle size more than composition. During our size-selected experiments, the sensors could detect particles as small as 100 nm, but the both the slopes and R2 values for linear regressions between the sensors and our reference instruments remained below roughly 0.5 until the particle diameter increased to 300 nm. Finally, we demonstrate the sensors cannot apportion the total particle mass concentration into different size fractions on a consistent and accurate basis, which corroborates prior work.
EDITOR:
1. Introduction
Particulate matter (PM) is well-established as an airborne pollutant of concern, causing respiratory, lung, and cardiovascular diseases (e.g., Guo et al. [Citation2018]). Numerous investigations have been conducted with the goal of quantifying and improving the measurement capabilities of various PM-measuring devices. Applications in which these devices are used range from estimation of human exposure (Chatzidiakou et al. Citation2019; Mahajan and Kumar Citation2020) to monitoring of outdoor PM (Feenstra et al. Citation2019; Holder et al. Citation2020; Malings et al. Citation2020).
Recently, low-cost particle sensors have grown in popularity for several of these applications, but their accuracy has often been called into question (Zikova, Hopke, and Ferro Citation2017; Zamora et al. Citation2019; Feenstra et al. Citation2019; Salimifard, Rim, and Freihaut Citation2020; Singer and Delp Citation2018). Many of these sensors are nephelometers, meaning they quantify light that is scattered by the particles as they pass through the sensor in proportion to the concentration of particles. The sensor then outputs an electrical signal, corresponding to the quantity of scattered light, which can then be related to a particle number or mass concentration using a calibration equation. Because the amount of light scattered by a given particle is dependent on the particle’s complex refractive index, its diameter, and the wavelength of incident light (e.g., Bohren and Huffman [Citation1983]), low-cost particle sensors may respond differently when the particle composition and/or the particle size distribution is varied. Thus, the accuracy of a given sensor is a strong function of its ability to translate the scattered light to the actual particle concentration, and this translation includes effects related to both hardware (e.g., wavelength of light) and software (e.g., the calibration equation). We provide an overview of some previous work demonstrating this phenomenon presently.
Regarding particle composition, Wang et al. (Citation2015) observed that their sensors’ (including a Shinyei PPD42NS, a Samyoung DSM501A and a Sharp GP2Y1010AU0F) output was greater for organic particles compared to inorganic salt particles, and the authors comment that these differences could be due to a greater proportion of light scattered by the organics than the inorganics. Similarly, Northcross et al. (Citation2013) reported that the response of a Dylos sensor to three different particles sources (wood smoke, polystyrene latex spheres, ammonium sulfate) differed, as they observed different slopes in the sensor’s response relative to a reference instrument. Sousan et al. (Citation2016) and Liu et al. (Citation2017) observed similarly variable responses for the Sharp GP2Y sensor using a variety of test aerosols. Liu et al. (Citation2017) commented that the variable outputs related to different particle compositions may be due to differences in the sensors’ optical chambers and calibration methods. In other words, a sensor’s response to a given particle source may be related to the specific calibration material, an idea central to Hagan and Kroll (Citation2020).
The effects of particle size on a sensors’ response has also been discussed in the literature. Both Wang et al. (Citation2015) and Han, Symanski, and Stock (Citation2017) observed an increase in the slope between their tested sensors and the reference instruments with increasing particle size; the Wang et al. (Citation2015) sensors are listed previously, and Han, Symanski, and Stock (Citation2017) tested the Dylos 1700. Moreover, Sousan et al. (Citation2016) found that the detection efficiency of the Dylos 1700 sensor was less than 5% for 0.3 µm particles, but increased to 60% for 1.3 µm and approximately 100% for particles larger than 3 µm. Conversely, Manikonda, Hopke, and Ferro (Citation2016) found that the Dylos 1100 Pro sensor overestimated PM10 (particle diameter < 10 µm) when challenged with cigarette smoke but underestimated the concentration for PM2.5 (particle diameter < 2.5 µm), while Zamora et al. (Citation2019) demonstrated that Plantower PMSA003 sensors were most accurate for PM1 (particle diameter < 1 µm) with worse performance for PM2.5 and PM10. Interestingly, He, Kuerbanjiang, and Dhaniyala (Citation2020) demonstrate that the Plantower PMS5003 sensor may be more accurate for 200 nm particles than 1 μm particles (cf., their Figure 8). Moreover, Tryner et al. (Citation2020) demonstrate that the Sensirion SPS30, the Plantower PMS5003, and the Amphenol SM-UART-04L may not correctly apportion the total reported mass concentration into PM1, PM2.5, and PM10. Results presented in both He, Kuerbanjiang, and Dhaniyala (Citation2020) and Tryner et al. (Citation2020) suggest that these nephelometer-type sensors apportion the light scattering signal into different size fractions by assuming a fixed underlying particle size distribution, which may not be representative of the actual size distribution of the sampled particles.
From previous studies, it is clear that both size and composition affect sensor performance. However, the trends are not completely consistent, which may be complicated by the difficulty in de-coupling size and composition effects for indoor sources (e.g., combustion sources may generate sub-micron particles, while dust resuspension may generate super-micron particles). To better understand size and composition effects, we conducted experiments in which we subjected five low-cost sensors, some of which have not previously been tested in such ways, to various particle sources, including both monodisperse and polydisperse aerosol populations.
The specific aims of our study were to: (1) contribute to the body of knowledge relating particle size and composition and sensor performance for a few sensors that have not been investigated in this manner previously; (2) further refine the understanding of the effects of particle size by using monodisperse test aerosols of different compositions; and (3) attempt to distinguish between size and composition effects when the sensors are subjected to different sources. In these analyses, we focus on Plantower sensors. This brand of sensor is growing in popularity within consumer devices (e.g., HabitatMap used a Shinyei PPD60PV in the original AirBeam but adopted the Plantower PMS7003 for the AirBeam2). While information regarding Plantower sensors in the literature is growing, it remains inconclusive.
2. Materials and methods
2.1. Devices tested
We tested bare Plantower PMS5003 sensors and a suite of consumer devices, all of which contain at least one Plantower sensor; details on these are provided in . Consequently, each sensor outputs a total mass concentration, as well as software-estimated values of PM1, PM2.5, and PM10. The designation “BS” refers to the bare sensor, while “ID” refers to integrated devices containing the sensor. To be consistent with our previous studies (Zou, Young, Wickey, et al. Citation2020; Zou, Young, Chen, et al. Citation2020; Zou, Clark, and May Citation2021), we use the same identification for the sensors as in those papers, and thus, ID3, BS1, and BS2 are excluded from the present work: ID3 does not contain a Plantower sensor, and BS1 and BS2 are produced by other manufacturers. As in our previous work (Zou, Young, Wickey, et al. Citation2020; Zou, Young, Chen, et al. Citation2020; Zou, Clark, and May Citation2021), we used a TSI Scanning Mobility Particle Sizer (SMPS) Model 3938, comprised of a Model 3081 long DMA and a model 3775 Condensation Particle Counter (CPC), and an TSI Aerodynamic Particle Sizer (APS) Model 3321 as reference instruments. Even though the SMPS + APS combination does not provide a direct measurement of mass concentration, it provides us with time- and size-resolved information. We discuss the required assumptions to calculate these mass concentrations in Section 2.3.
Table 1. Summary of tested sensors in this study.
2.2. Experimental methodology
We conducted three phases of experimental work to investigate how composition and size influence the sensors’ responses, in order to try to de-couple these effects. We did not control for temperature or relative humidity in these experiments; however, across all experiments, temperature was 26.0 ± 0.3 °C and relative humidity was 20.9 ± 7.5% within the chamber. Therefore, we expect that the influence of these environmental conditions on any variability in our results are minimal based on our previous work (Zou, Clark, and May Citation2021).
In the first phase, we placed all sensors into a 0.71 m × 0.48 m × 0.38 m (0.130 m3) enclosed chamber (labeled as “Sensors” in ). We generated particles by atomizing aqueous ammonium sulfate [(NH4)2SO4] solutions and operating a propane torch, modified such that it produced greater quantities of soot. We dried the particles using a diffusion drier and then introduced the dried particles into a fixed-voltage DMA to size-select monodisperse particles (100, 200, 300, 400, 500, 600, 700 nm) into the chamber containing the sensors. The CPC was used to measure particle number concentrations downstream of the chamber. Typical mass concentrations of the size-selected particles based on the CPC measurements ranged between 10 − 200 μg m−3 during these experiments (see Section 2.3 for the details on this calculation). For each particle source, the experiments were conducted in triplicate for each particle size.
Figure 1. General experimental set up for decay tests. All sensors were co-located in the same chamber, labeled as “Sensors.” For some experiments, the SMPS was split into a fixed-voltage DMA for size-selection upstream of that chamber and a CPC downstream of the chamber for particle counting.
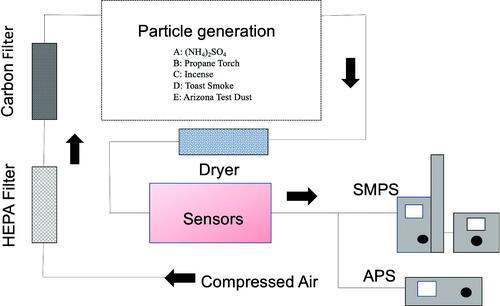
In the second phase, we conducted decay tests similar to Zou, Young, Chen, et al. (Citation2020) in a sealed Modular Blast Cabinet (Eastwood Inc.) with dimensions of 0.77 m × 0.52 m × 0.71 m (0.283 m3) and a 0.55 m × 0.25 m viewing window on the top. Coarse Arizona Test Dust (Powder Technology, Inc.) was placed in the bottom of the chamber and resuspended using the cabinet’s blast gun, which was operated using HEPA-filtered and activated-carbon-denuded compressed air. Initial concentrations within the cabinet after the resuspension process were approximately 100 − 200 µg m−3 (based on combined SMPS + APS measurements; see Section 2.3), and the concentration was allowed to naturally decay over the duration of the experiment. We repeated these decay experiments four times.
In the third phase, we reexamined earlier experiments from Zou, Young, Chen, et al. (Citation2020) in which three different particle sources were introduced into the 0.130 m3 chamber. Those experiments used incense, atomized (NH4)2SO4 solution, and burnt toast smoke as the particle sources, but we also conducted new experiments using the modified propane torch as an additional source for this work. For each source, we generated a high concentration of particles (∼100 − 1000 µg m−3 based on the SMPS + APS measurements) in a separate chamber and dried the particles using a diffusion drier prior to introducing them to the chamber containing the sensors. After removing the particle source, the concentration inside the chamber naturally decayed to near zero. We repeated these decay experiments four times for each source. For both the second and third phases, we did not include any size-separation between the sources and the sensors/reference instruments.
2.3. Data collection and pre-processing
The bare Plantower sensors were operated with an external microcontroller (i.e., Arduino) using a script written in the C programming language; this script also recorded the data in real-time into an output file. The output data from these sensors were recorded (based on the sensor capabilities) using serial communication software (Coolterm) with time logged from the computer clock. We received data from the integrated devices through cloud-based connectivity (ID1), serial communication (ID2, ID4) and SD card storage (ID5). Timestamps of data from the integrated devices vary based on the specific product and range between roughly 1 and 80 s. We then averaged or interpolated the sensor data into 1-minute time intervals to match the sampling interval of the SMPS.
Because the sensors output total mass concentration along with an estimate of PM1, PM2.5, and PM10 concentrations, we required a method to convert the number concentrations and number distributions from our reference instruments to mass concentrations. To estimate these reference mass concentrations for the size-selected particles as part of the first phase of experiments (size-selected particles), we converted CPC number concentrations to mass concentrations by assuming spherical particles and by using values of particle density from the literature (). To estimate reference mass concentrations for the second and third phases (decay tests), we merged the SMPS and APS data using the approach of Khlystov, Stanier, and Pandis (Citation2004); we refer to these combined size distributions as “SMPS + APS data.” We converted from number distributions to mass distributions by assuming a spherical shape and incorporating densities based on the literature (). We then integrated these size distributions to estimate mass concentrations from the combined SMPS + APS data. While the assumption of spherical particles may not be appropriate for all of our particle sources, much of our analysis focuses on the relative response between the sensors and the reference instruments (i.e., the slope).
Table 2. Assumed densities for the tested particle sources in this study.
To determine how well the sensors apportion their total inferred mass concentration into PM1, PM2.5, and PM10, we used these values, as reported by the sensors, to define three size fractions: PM1, PM1-2.5, and PM2.5-10. To define the sensor-derived values of PM1-2.5 (PM2.5-10), we took the difference between the mass concentrations that the sensors report as PM2.5 and PM1 (PM10 and PM2.5). We emphasize that these are using the mass concentrations output by the sensors and not the binned number concentrations. For comparison, we integrated the mass concentrations for the combined mass distribution from the SMPS + APS to define a reference value of PM1, PM1-2.5, and PM2.5-10 using ∼20 nm and 1 μm, 1 μm and 2.5 μm, and 2.5 μm and 10 μm as our limits of integration, respectively.
2.4. Data analysis
Two often-used metrics in the evaluation of low-cost sensors are the coefficient of determination (R2) of the linear regression between the low-cost PM sensor output and the reference instrument output (Karagulian et al. Citation2019; Kelly et al. Citation2017; Singer and Delp Citation2018) and the slope of this linear regression (Rai et al. Citation2017; Karagulian et al. Citation2019; Zamora et al. Citation2019; Salimifard, Rim, and Freihaut Citation2020; Wang et al. Citation2015), both of which we used in this study. R2 describes the correlation between the two outputs, and slope provides information on the relative magnitude of the outputs. Hence, a “perfect” sensor would have both slope and R2 equal to unity when compared to the reference instrument. In our data, R2 and slope were calculated from ordinary least-squares linear regression models between the sensors and the reference instruments. In our linear regressions, we always use the SMPS + APS as the “x-data,” implying that the sensor outputs are the “y-data.”
2.5. Mie theory modeling
To aid in the interpretation of our results, we conducted some Mie theory modeling using the code provided by Hagan and Kroll (Citation2020). Briefly, that code allows the user to represent a nephelometer based on its wavelength of light and its viewing angle. For more information, we refer the reader to Section S1 and Figures S1–S2 in the online supplementary information (SI) .
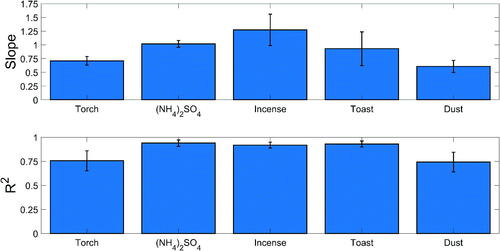
Figure 2. Mean slope and R2 for each particle source for ID5 (PurpleAir II). These data represent the total mass concentration output by the sensors and the total mass concentration inferred from the SMPS + APS (i.e., the values input into the box-and-whisker plot in Figure S3). Error bars represent one standard deviation in both panels.
3. Results and discussion
Our presentation of results first considers how the different sensors respond to different particle sources from the “decay tests,” and we subsequently discuss the results from our size-selected experiments. The final sub-section presents an assessment of the sensors’ ability to apportion the total reported mass concentration into their three reported size fractions (PM1, PM2.5, and PM10). We provide a comparison of the total reported mass concentration among the different sensors as Figures S3–S4 in the online SI.
Figure 3. Results for experiments using size-selected propane torch and (NH4)2SO4 particles for ID4 (TSI BlueSky). Bars represent the mean, and error bars represent standard deviation.
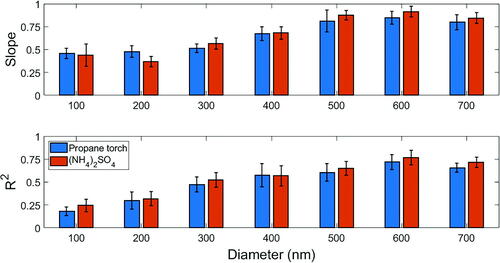
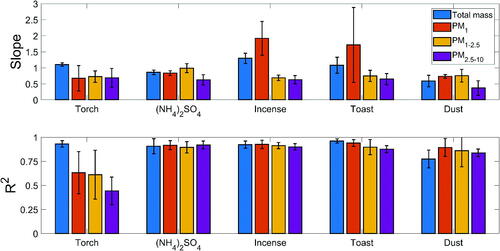
Figure 4. Slope and average R2 for each particle source for ID4 (TSI BlueSky), considering total mass concentration, PM1, PM1–2.5, and PM2.5–10. The size fraction data represent the “as-reported” values from the sensors and the integrated mass concentration within the size range from the SMPS + APS. Bars represent the mean, and error bars represent standard deviation.
3.1. Effect of particle source
We provide one example demonstrating how different particle sources can affect the sensors’ reported total mass concentration in , which includes data for ID4 (PurpleAir II). The top panel represents the mean slopes (± one standard deviation) from linear regressions between the total mass concentration output by the sensor and the total mass concentration estimated from the SMPS + APS data, and the bottom panel represents the corresponding mean R2 (± one standard deviation). Results for the other sensors can be found in and S5–S7. We opt to use bar graphs, rather than box-and-whisker plots here because these values represent the four replicate experiments for each source, combining all units of each sensor model. Therefore, for ID1, the number of slopes included in the figure is four (as we only tested one unit of this sensor type).
The most obvious observation from these figures is that the particle source does affect the sensors’ ability to represent the total mass concentration accurately. For example, the mean slope across all sensors for Arizona Test Dust (“Dust” in the figures) is always less than unity, while the mean slope for propane-torch-generated soot (“Torch” in the figures) is often less than unity. Conversely, the mean slopes for burning incense and burning toast (“Incense” and “Toast,” respectively) are often greater than unity. Moreover, the standard deviation of the mean slopes tend to be the largest for incense and toast. One potential explanation for these differences among the sensors is the composition of the particles; we did not characterize the chemical composition of the particles, but we presume that the torch-generated soot is dominated by black carbon, while the incense- and toast-derived particles are dominated by organic carbon. Differences in chemical composition imply differences in the complex refractive index of the particles, which influences light scattering by the particles, and hence, the light scattering signal within the sensors.
However, the size distribution of the particles will also affect how they scatter light, and thus, the sensors’ ability to detect the particles. In , we present the average mass median diameter and average geometric standard deviation of the particle mass distribution associated with each replicate of each particle source, as derived from the merged SMPS + APS data. The propane torch particles have a mode diameter of roughly 300 nm, which corresponds to the smallest detectable size reported in the Plantower specification sheets. Our Mie theory simulations based on Hagan and Kroll (Citation2020) demonstrate that the scattering cross-section per particle (Cscat) decreases by roughly four orders of magnitude as particle size decreases from 500 nm to 100 nm; conversely, Cscat only increases by roughly one order of magnitude as particle size increases from 500 nm to 2 μm (Figure S1). Hence, the small size of these particles may be another explanation for the slopes for the torch-generated soot being less than unity.
Table 3. Average mass median diameter and geometric standard deviation for all replicates of each particle source tested.
Conversely, the dust particles had a mode diameter of roughly 1 − 3 μm; the mean slope for this source is on the order of 0.5 across all sensors, and the R2 values also tended to be lower compared to the other sources. These results are similar to other recent work with the PMS5003. For example, Kuula et al. (Citation2020) report that the “normalized detection efficiency” for monodisperse dioctyl sebacate particles is less than roughly 30% for particles greater than 1 μm. Similarly, Tryner et al. (Citation2020) report time-averaged mass concentration ratios (sensor over reference) of roughly 0.7 for an oil mist having a mass median diameter of roughly 2.9 μm and a geometric standard deviation of roughly 4.0; while Tryner et al. (Citation2020) did include Arizona Road Dust in their experiments, their reported mass median diameter ranged between 0.45 and 0.91 μm for that source. Finally, the predictions from He, Kuerbanjiang, and Dhaniyala (Citation2020) based on their fitted transfer functions suggest that the Plantower sensor may under-represent the expected mass concentration for monodisperse 1 μm by more than 50%. We do not have a definitive mechanistic explanation as to why the sensors exhibit decreased accuracy for larger particles, but this may be related to the number of turns that these particles (with relatively large inertia) must make within the sensor itself. Regardless, there is consistent empirical evidence that particles having larger sizes (>roughly 1 μm) are not sampled accurately.
Following the logic for propane torch soot and Arizona Test Dust, we cannot, however, explain why the mean slopes were often greater than unity for incense and toast. Both of these sources had two modes; the average for one mode ranged between roughly 120 nm to 190 nm, and the other ranged between roughly 6 μm and 8 μm. We suspect that the ability of the sensors to detect the incense and toast particles is related to some complex interaction between the relatively large initial particle concentrations for these experiments (up to 1000 μg m−3), the presence of some particle mass between 300 nm and 1 μm, and the fact that these particle size distribution parameters represent the average values across each experiment. These factors likely also contribute to the relatively large variability (standard deviation) for these two sources. Given that the average R2 values for the total mass concentration of these two sources across all sensors are >0.90, it appears unlikely that this is an artifact of comparing sensor noise to SMPS + APS noise.
In aggregate, this evidence appears to suggest that particle size plays the larger role in influencing a low-cost sensor’s ability to quantify accurate particle mass concentrations. This claim is corroborated by our Mie theory simulations in Figure S2, using the real and imaginary refractive indices (which affect light scattering and light absorption, respectively) as proxies for composition. Predicted values of Cscat at a given particle diameter are practically independent of the real refractive index, while the only strong effect of the imaginary refractive index exists for large absorbing particles (diameter >1 μm; imaginary refractive index >∼0.01). Our simulations in Figure S2 does not include any losses of large particles with changing flow direction inside the sensor, but based on theory related to inertial deposition (Noll and Pilat Citation1970; Cheng and Wang Citation1975; Marple and Willeke Citation1976), these losses likely exist. Therefore, it is likely that the size of the particles emitted by a given source is more important than the composition of those particles when considering sensor performance.
3.2. Effect of particle size
Our results in Section 3.1 highlight the influence that polydisperse particle size distributions have on the performance of low-cost sensors. In this section, we extend this idea to explore how the sensors respond to size-selected particles generated from the propane torch and from the atomization of (NH4)2SO4 solution. In , we present one example using ID4 (TSI BlueSky), with figures for the other sensors provided as Figures S9–S12; slopes are presented in the top panels, and R2 are presented in the bottom panels. These figures all compare total mass concentration output by the sensor to the mass concentration estimated from the CPC number concentrations.
There are two features common to all figures. The first is that there is an increase in both the slope and R2 as particle diameter increases between 100 nm and 300 nm. Interestingly, there are no systematic patterns related to the particle source within this size range; for some sensors, the slope for the (NH4)2SO4 particles are greater than the slope for the propane torch particles, while for other sensors, the opposite is true. However, the reliability of the data for particles smaller than 300 nm may be suspect, due to the fairly low R2 values. The second feature is that for the largest sizes (500 nm−700 nm), both the slope and R2 are roughly constant. Across these particle sizes, the mean slopes for the (NH4)2SO4 particles tend to be greater than the slopes for the propane torch particles, but the majority of these differences are not statistically significant.
Our observations are roughly consistent with prior studies investigating the detection efficiency of the Plantower PMS5003. He, Kuerbanjiang, and Dhaniyala (Citation2020) demonstrated a sharp increase in the sensor’s ability to detect particles between 100 nm and 300 nm (the manufacturer-reported lower size limit). Those observations and ours are consistent with the predictions of a sharp increase in Cscat between 100 nm and 300 nm in Figure S1. Our results at the larger particle sizes are similar to the “normalized detection efficiencies” reported by Kuula et al. (Citation2020) for monodisperse dioctyl sebacate particles between 500 nm and 700 nm. This effect of particle size on sensor performance is also broadly consistent with other previous findings (Wang et al. Citation2015; Manikonda, Hopke, and Ferro Citation2016; Sousan et al. Citation2016; Han, Symanski, and Stock Citation2017; Liu et al. Citation2017; Rai et al. Citation2017; Zamora et al. Citation2019; Tryner et al. Citation2020).
The size-selected results from our study, from He, Kuerbanjiang, and Dhaniyala (Citation2020), and from Kuula et al. (Citation2020) does suggest an inconsistency that we cannot explain: if the size-resolved experiments from these combined works suggests that Plantower sensors are biased low from 100 nm to 10 μm, how can any of our observed slopes in , and S5–S8 exceed one? These observations are not, however, an anomaly, as field studies have also suggested that Plantower sensors can be biased high (Kelly et al. Citation2017; Feenstra et al. Citation2019; Sayahi, Butterfield, and Kelly Citation2019; Malings et al. Citation2020). One possible explanation is provided in the modeling study of Hagan and Kroll (Citation2020); as the aerosol properties (size distribution parameters, complex refractive index) of the sampled particles diverge from those of the calibration aerosols, the output mass concentration from low-cost (nephelometer-type) sensors may be biased high or biased low. Therefore, these inconsistencies may be related to the particle size distributions of the polydisperse aerosols and their complex refractive indices along with how similar these parameters are relative to the particles used to calibrate the sensors.
3.3. Ability to apportion mass into size fractions
We next considered how well the low-cost sensors apportion the light scattering signal (total mass concentration) into the PM1, PM1–2.5, and PM2.5–10 size fractions. An illustrative example using ID4 (TSI BlueSky) is provided as , and results for the other sensors are provided as Figures S5–S8. These results all compare the mass associated with each size fraction (calculated from the sensor-reported PM1, PM2.5, and PM10 mass concentrations) to the integral of the SMPS + APS mass size distribution between different particle sizes.
One immediate observation is that none of these linear regressions appear to be a comparison of noise; if that were the case, we would expect R2 values to be practically 0. This is surprising for the propane torch particles, which had, on average, a mass median diameter of roughly 300 nm and a geometric standard deviation of roughly 1.5. However, we did observe non-negligible mass concentrations in our SMPS + APS data (and the mean R2 for the PM2.5-10 size fraction falls between 0.4 − 0.5 for all sensors), so this does not appear to be a mis-apportionment of the sampled particles into the sensor-reported size fractions. It is not clear if these larger particles were generated by the torch itself or if they are related to particle resuspension or a leak within our experimental setup, but they do appear to be real, even if this is not captured by our average mass size distributions in .
Nevertheless, all sensors struggle to accurately capture the actual size distribution of the particles. This is not surprising, because all of these sensors are nephelometers, and thus, they cannot actually resolve the sampled particles by size. For example, all the integrated devices greatly over-estimate the mass present in the PM1 size fraction for both incense and toast (mean slopes between roughly 1.5 and 2.5) and under-estimate the mass present in the PM1-2.5 and PM2.5-10 size fractions. A mechanistic explanation for this is unclear, but it may be related to the bimodal average size distribution (), the complex refractive index of these particles, and/or some other reason. In general, the ability to correctly apportion the size distribution is the best for the (NH4)2SO4 particles, but the slope of at least one of the size fractions for these particles is significantly different than 1 (p < 0.05) for all of the sensors. The inability of low-cost sensors to properly apportion the mass into the size fractions corroborates the findings of Tryner et al. (Citation2020). The implication of these findings is that the reported values of PM2.5, which is often considered for human exposure assessment, may not be reliable for low-cost particle sensors.
There is yet another anomaly for propane torch particles in these data that we cannot fully explain. The slope for the total mass concentration is greater than each of the slopes for the PM1, PM1-2.5, and PM2.5-10 size fractions, implying that the sum of the mass concentrations for these size fractions is less than the total mass concentration. We suspect that this is an artifact of the quality of the linear regressions for propane torch particles. Specifically, the R2 values are often much lower for the three size fractions than for the total mass concentration for this source. Moreover, both the slopes and R2 are quite variable for the size fractions with this source. For example, the relative standard deviations are >50% for the slope and >30% for R2 for Plantower PMS5003 (Figure S7); the majority of the other relative standard deviations associated with the other sources for the Plantower PMS5003 are <40% for the slope and <10% for R2. These results may suggest that low-cost sensors can have difficulty in reliably detecting small, absorbing particles, like those that may be emitted by natural gas appliances within a residence.
4. Conclusions
In this study, we conducted laboratory experiments to evaluate size and composition effects on the performance of a Plantower particle sensor and four integrated devices that incorporate it. These efforts included experiments with five particle sources, and a subset of those experiments included monodisperse aerosols. Our major findings are:
There is an apparent source effect on the performance of the sensors when considering the accuracy of the total reported mass concentration, which appears to be related to particle size. For example, the performance of all sensors is generally the worst for propane torch soot (small, light-absorbing particles) and Arizona Test Dust (super-micron particles).
The sensors could generally detect size-resolved particles as small as 100 nm, but the mean slopes and mean R2 values both remained below roughly 0.5 until the size-resolved particles were 300 nm in diameter. This is likely related to the lower scattering efficiencies of particles smaller than 300 nm at the wavelength of light in the sensor. This finding is consistent with the manufacturer-reported lower size limit of 300 nm for the Plantower sensors.
Although the total sensor-reported mass concentration may be accurate (slope ∼ 1) for some sources, the sensor-reported mass concentrations for PM1, PM2.5, and PM10 appears to be unreliable, which is consistent with earlier work by Tryner et al. (Citation2020).
Accounting for particle size has the potential to improve sensor performance, and in fact, Li et al. (Citation2020) proposed the need for a size-specific calibration factor. Our work and others (He, Kuerbanjiang, and Dhaniyala Citation2020; Tryner et al. Citation2020) suggest that the Plantower sensors cannot provide reliable sizing information, so some external measurement of particle size distributions will be required in order to apply an accurate size-resolved correction equation. However, the modeling study of Hagan and Kroll (Citation2020) suggest that low-cost optical particle counters may also provide biased results, so the ability to obtain size-resolved information about the sampled particles using a separate low-cost device may be insufficient to overcome measurement biases in low-cost nephelometer-type sensors.
A more realistic approach for improved calibrations may be the development of a database of source-specific, scalar correction factors for Plantower-based sensors in order to improve exposure estimates. For example, solid fuel combustion appears to consistently result in concentrations that are biased high (e.g., ∼50% high for burning incense in Singer and Delp [Citation2018] and factor of ∼2 in our results; factor of ∼2 high for wildfire smoke in both Delp and Singer [Citation2020] and Holder et al. [Citation2020]), but for many particle sources, the discrepancies are not as extreme. While this approach is inherently limited in that it does not account for particle size distributions or the complex refractive index (both of which influence light scattering by the particles), it may be sufficient to provide reasonable estimates of total particle mass concentration by the sensors.
Supplemental Material
Download PDF (977.3 KB)Disclosure statement
The authors declare no conflicts of interest.
Additional information
Funding
References
- Bohren, C., and D. Huffman. 1983. Absorption and scattering of light by small particles. New York, NY: Wiley-Interscience.
- Chatzidiakou, L., A. Krause, O. A. M. Popoola, A. Di Antonio, M. Kellaway, Y. Han, F. A. Squires, T. Wang, H. Zhang, Q. Wang, et al. 2019. Characterising low-cost sensors in highly portable platforms to quantify personal exposure in diverse environments. Atmos. Meas. Tech. 12 (8):4643–57. doi:https://doi.org/10.5194/amt-12-4643-2019.
- Cheng, Y.-S., and C.-S. Wang. 1975. Inertial deposition of particles in a bend. J. Aerosol Sci. 6 (2):139–45. doi:https://doi.org/10.1016/0021-8502(75)90007-5.
- Cheng, Y. S., W. E. Bechtold, C. C. Yu, and I. F. Hung. 1995. Incense smoke: Characterization and dynamics in indoor environments. Aerosol Sci. Technol. 23 (3):271–81. doi:https://doi.org/10.1080/02786829508965312.
- Delp, W. W., and B. C. Singer. 2020. Wildfire smoke adjustment factors for low-cost and professional PM2.5 monitors with optical sensors. Sensors 20 (13):3683. doi:https://doi.org/10.3390/s20133683.
- Feenstra, B., V. Papapostolou, S. Hasheminassab, H. Zhang, B. Der Boghossian, D. Cocker, and A. Polidori. 2019. Performance evaluation of twelve low-cost PM2.5 sensors at an ambient air monitoring site. Atmos. Environ. 216:116946. doi:https://doi.org/10.1016/j.atmosenv.2019.116946.
- Guo, C., Z. Zhang, A. K. H. Lau, C. Q. Lin, Y. C. Chuang, J. Chan, W. K. Jiang, T. Tam, E.-K. Yeoh, T.-C. Chan, et al. 2018. Effect of long-term exposure to fine particulate matter on lung function decline and risk of chronic obstructive pulmonary disease in Taiwan: A longitudinal, cohort study. Lancet. Planet. Health. 2 (3):e114–e125. doi:https://doi.org/10.1016/S2542-5196(18)30028-7.
- Hagan, D. H., and J. H. Kroll. 2020. Assessing the accuracy of low-cost optical particle sensors using a physics-based approach. Atmos. Meas. Tech. 13 (11):6343–55. doi:https://doi.org/10.5194/amt-13-6343-2020.
- Han, I., E. Symanski, and T. H. Stock. 2017. Feasibility of using low-cost portable particle monitors for measurement of fine and coarse particulate matter in urban ambient air. J. Air Waste Manag. Assoc. 67 (3):330–40. doi:https://doi.org/10.1080/10962247.2016.1241195.
- He, M., N. Kuerbanjiang, and S. Dhaniyala. 2020. Performance characteristics of the low-cost Plantower PMS optical sensor. Aerosol Sci. Technol. 54 (2):232–41. doi:https://doi.org/10.1080/02786826.2019.1696015.
- Holder, A. L., A. K. Mebust, L. A. Maghran, M. R. McGown, K. E. Stewart, D. M. Vallano, R. A. Elleman, and K. R. Baker. 2020. Field evaluation of low-cost particulate matter sensors for measuring wildfire smoke. Sensors 20 (17):4796. doi:https://doi.org/10.3390/s20174796.
- Karagulian, F., M. Barbiere, A. Kotsev, L. Spinelle, M. Gerboles, F. Lagler, N. Redon, S. Crunaire, and A. Borowiak. 2019. Review of the performance of low-cost sensors for air quality monitoring. Atmosphere. 10 (9):506. doi:https://doi.org/10.3390/atmos10090.
- Kelly, K. E., J. Whitaker, A. Petty, C. Widmer, A. Dybwad, D. Sleeth, R. Martin, and A. Butter. 2017. Ambient and laboratory evaluation of a low-cost particulate matter sensor. Environ. Pollut. 221:491–500. doi:https://doi.org/10.1016/j.envpol.2016.12.039.
- Khalizov, A. F., H. Brian, Chong Qiu, E. L. Petersen, and R. Zhang. 2012. Characterization of soot aerosol produced from combustion of propane in a shock tube. Aerosol Sci. Technol. 46 (8):925–36. doi:https://doi.org/10.1080/02786826.2012.683839.
- Khlystov, A., C. Stanier, and S. N. Pandis. 2004. An algorithm for combining electrical mobility and aerodynamic size distributions data when measuring ambient aerosol special issue of aerosol science and technology on findings from the fine particulate matter supersites program. Aerosol Sci. Technol. 38 (sup1):229–38. doi:https://doi.org/10.1080/02786820390229543.
- Kuula, J., T. Mäkelä, M. Aurela, K. Teinilä, S. Varjonen, Ó. González, and H. Timonen. 2020. Laboratory evaluation of particle-size selectivity of optical low-cost particulate matter sensors. Atmos. Meas. Tech. 13 (5):2413–23. doi:https://doi.org/10.5194/amt-13-2413-2020.
- Li, J., S. K. Mattewal, S. Patel, and P. Biswas. 2020. Evaluation of nine low-cost-sensor-based particulate matter monitors. Aerosol Air Qual. Res. 20 (2):254–70. doi:https://doi.org/10.4209/aaqr.2018.12.0485.
- Liu, D., Q. Zhang, J. Jiang, and D. R. Chen. 2017. Performance calibration of low-cost and portable particular matter (PM) sensors. J. Aerosol Sci. 112:1–10. doi:https://doi.org/10.1016/j.jaerosci.2017.05.011.
- Mahajan, S., and P. Kumar. 2020. Evaluation of low-cost sensors for quantitative personal exposure monitoring. Sustain. Cities Soc. 57:102076. doi:https://doi.org/10.1016/j.scs.2020.102076.
- Malings, C., R. Tanzer, A. Hauryliuk, P. K. Saha, A. L. Robinson, A. A. Presto, and R. Subramanian. 2020. Fine particle mass monitoring with low-cost sensors: corrections and long-term performance evaluation. Aerosol Sci. Technol. 54 (2):160–74. doi:https://doi.org/10.1080/02786826.2019.1623863.
- Manikonda, A., P. K. Hopke, and A. R. Ferro. 2016. Laboratory assessment of low-cost PM monitors. J. Aerosol Sci. 102:29–40. doi:https://doi.org/10.1016/j.jaerosci.2016.08.010.
- Marple, V. A., and K. Willeke. 1976. Impactor design. Atmos. Environ. (1967). 10 (10):891–6. doi:https://doi.org/10.1016/0004-6981(76)90144-X.
- Noll, K. E., and M. J. Pilat. 1970. Inertial impaction of particles upon rectangular bodies. J. Colloid Interface Sci. 33 (2):197–207. doi:https://doi.org/10.1016/0021-9797(70)90022-6.
- Northcross, A. L., R. J. Edwards, M. A. Johnson, Z. M. Wang, K. Zhu, T. Allen, and K. R. Smith. 2013. A Low-cost particle counter as a realtime fine-particle mass monitor. Environ. Sci. Processes Impacts 15 (2):433–9. doi:https://doi.org/10.1055/s-0035-1545797.
- Rai, A. C., P. Kumar, F. Pilla, A. N. Skouloudis, S. D. Sabatino, C. Ratti, A. Yasar, and D. Rickerby. 2017. End-user perspective of low-cost sensors for outdoor air pollution monitoring. Sci. Total Environ. 607–608:691–705. doi:https://doi.org/10.1016/j.scitotenv.2017.06.266.
- Salimifard, P., D. Rim, and J. D. Freihaut. 2020. Evaluation of low-cost optical particle counters for monitoring individual indoor aerosol sources. Aerosol Sci. Technol. 54 (2):217–31. doi:https://doi.org/10.1080/02786826.2019.1697423.
- Sayahi, T., A. Butterfield, and K. E. Kelly. 2019. Long-term field evaluation of the Plantower PMS Low-cost particulate matter sensors. Environ. Pollut. 245:932–40. doi:https://doi.org/10.1016/j.envpol.2018.11.065.
- Singer, B. C., and W. W. Delp. 2018. Response of consumer and research grade indoor air quality monitors to residential sources of fine particles. Indoor Air. 28 (4):624–39. doi:https://doi.org/10.1111/ina.12463.
- Sousan, S.,. K. Koehler, L. Hallett, and T. M. Peters. 2016. Evaluation of the alphasense optical particle counter (OPC-N2) and the grimm portable aerosol spectrometer (PAS-1.108). Aerosol. Sci. Technol. 50 (12):1352–65. doi:https://doi.org/10.1080/02786826.2016.1232859.
- Teipel, U., H. Winter, J. Cäsar, and A. Gromov. 2008. Characterization of test dust for product qualification. Bulk Solids & Powder. Sci. & Technol. 3 (4):155–16.
- Tryner, J., C. L’Orange, J. Mehaffy, D. Miller-Lionberg, J. C. Hofstetter, A. Wilson, and J. Volckens. 2020. Laboratory evaluation of low-cost PurpleAir PM monitors and in-field correction using co-located portable filter samplers. Atmos. Environ. 220:117067. doi:https://doi.org/10.1016/j.atmosenv.2019.117067.
- Wang, Y., J. Li, H. Jing, Q. Zhang, J. Jiang, and P. Biswas. 2015. Laboratory evaluation and calibration of three low-cost particle sensors for particulate matter measurement. Aerosol Sci. Technol. 49 (11):1063–77. doi:https://doi.org/10.1080/02786826.2015.1100710.
- Zamora, M. L., F. Xiong, D. Gentner, B. Kerkez, J. Kohrman-Glaser, and K. Koehler. 2019. Field and laboratory evaluations of the low-cost Plantower particulate matter sensor. Environ. Sci. Technol. 53 (2):838–49. doi:https://doi.org/10.1021/acs.est.8b05174.
- Zelenyuk, A., C. Yong, and D. Imre. 2006. From agglomerates of spheres to irregularly shaped particles: Determination of dynamic shape factors from measurements of mobility and vacuum aerodynamic diameters. Aerosol Sci. Technol. 40 (3):197–217. doi:https://doi.org/10.1080/02786820500529406.
- Zikova, N., P. K. Hopke, and A. R. Ferro. 2017. Evaluation of new low-cost particle monitors for PM2.5 concentrations Measurements. J. Aerosol Sci. 105:24–34. doi:https://doi.org/10.1016/j.jaerosci.2016.11.010.
- Zou, Y., J. D. Clark, and A. A. May. 2021. A systematic investigation on the effects of temperature and relative humidity on the performance of eight low-cost particle sensors and devices. J. Aerosol Sci. 152:105715. doi:https://doi.org/10.1016/j.jaerosci.2020.105715.
- Zou, Y., M. Young, J. Chen, J. Liu, A. A. May, and J. D. Clark. 2020. Examining the functional range of commercially available low-cost airborne particle sensors and consequences for monitoring of indoor air quality in residences. Indoor Air. 30 (2):213–34. doi:https://doi.org/10.1111/ina.12621.
- Zou, Y., M. Young, M. Wickey, A. A. May, and J. D. Clark. 2020. Response of eight low-cost particle sensors and consumer devices to typical indoor emission events in a real home (ASHRAE 1756-RP). Sci. Technol. Built Environ. 26 (2):237–49. doi:https://doi.org/10.1080/23744731.2019.1676094.