
 ?Mathematical formulae have been encoded as MathML and are displayed in this HTML version using MathJax in order to improve their display. Uncheck the box to turn MathJax off. This feature requires Javascript. Click on a formula to zoom.
Abstract
Particulate nitrogen has far-reaching negative effects on human health and the environment, and effective strategies for reducing it require understanding its sources and formation processes. To learn about these factors, we recorded size-resolved nitrogen isotope ratios (δ15N) of total particulate N at an urban site in northwest Germany during a four-week measuring campaign. We observed a steady decrease in δ15N when going from fine to coarse particles, with values between +18 ‰ and −2 ‰. This difference based on particle size is caused by different isotope fractionation processes during particle formation: The fine particles contain ammonium nitrate, which is formed in an equilibrium process, leading to an enrichment of 15N. Moreover, fine particles are more reactive due to their larger surface areas and relatively long residence times in the atmosphere, which leads to an additional enrichment of 15N; a key step of this process likely occurs when the ammonium particles interact with ammonia from agricultural sources. In contrast to fine particles, coarse particles are formed by direct absorption of HNO3 on preexisting particles; the HNO3 stems from traffic emissions of NOx and subsequent oxidation in the atmospheric gas phase. Because only a small amount of isotope fractionation is associated with non-equilibrium processes during phase transitions, there is less 15N enrichment in the coarse particles. Overall, nitrogen isotopes clearly reflect the different formation processes of fine and coarse aerosol particles.
EDITOR:
Introduction
Climate scientists have long understood the importance of studying aerosols. Yet, the effect of aerosol particles on the radiation budget is still not fully understood, and it represents one of the biggest uncertainties in atmospheric radiation mechanisms (Pachauri and Mayer Citation2015). Furthermore, fine particles such as aerosols have negative effects on human health: For example, being exposed to polluted air with high levels of fine particles can affect cardiopulmonary health (Kawanaka et al. Citation2008).
An important gaseous precursor is ammonia, contributing to the production of fine particles and affecting air quality even in areas far from the actual sources (Koziel, Aneja, and Baek Citation2006; Spirig and Neftel Citation2006). Furthermore, ammonia is a major cause of acidification and eutrophication of ecosystems (Niederau and Jedrusiak Citation2005). Therefore, it is crucial to better understand the formation processes of nitrogenous particles, namely those containing nitrate and ammonium. Nitrate is present in both fine and coarse particles, where the nitrate in the coarse particles is mostly in the form of stable salts such as NaNO3 and Ca(NO3)2 (Lee et al. Citation2008). In the fine particles, the nitrate is primarily found as ammonium nitrate (Kundu, Kawamura, and Lee Citation2010). In contrast to the nitrate, ammonium is mainly present in the fine particles, where it is produced when atmospheric ammonia neutralizes acids (Harrison and Yin Citation2004).
In previous studies, it has been argued that δ15N of particulate material allows one to identify the sources of these particles (Beyn, Matthias, and Dähnke Citation2014; Felix and Elliott Citation2014; Heaton Citation1990). In a study in China, Pan et al. (Citation2016) were able to determine size-resolved δ15N-NH4 during several haze periods and assign fossil sources. However, to use this measurement as a proxy, one must consider the effect of isotope fractionation during nucleation processes within the atmosphere. Moore (Citation1974) showed that particulate ammonium is enriched in 15N compared to the ammonium in precipitation, and another study showed that these 15N ratios vary and depend on chemical reactions in the atmosphere (Walters and Michalski Citation2015). The isotope enrichment factors for different reactions were determined experimentally by Heaton, Spiro, and Robertson (Citation1997), who observed, on the one hand, that unidirectional reactions lead to negative enrichment factors in the particle mass; thereby, diffusion and reaction of the lighter isotope (14N) is favored, resulting in a product depleted in 15N. On the other hand, for reversible equilibrium reactions, they found that 15N is enriched in the product.
Considering the different formation processes of fine and coarse particles, differences in δ15N are expected. To understand the atmospheric processes relevant to creating δ15N differences in aerosol particles of different sizes, Yeatman et al. (Citation2001) studied size-segregated aerosol particles at coastal sites in England. They described two different size-shift mechanisms responsible for the formation of coarse-mode aerosol: They found that dissolution/coagulation processes led to negative enrichment in δ15N, whereas dissociation/gas scavenging processes yielded positive enrichment in δ15N.
Given the many uncertainties about how 15N is deposited in aerosols of different sizes and origins, this study aims to improve our understanding of the nitrogen isotope fractionation processes associated with aerosol particle formation. Therefore, in order to identify the mechanisms underlying the formation of aerosol particles in urban areas, we focused on performing δ15N measurements on particles that were well resolved in terms of size (fine versus coarse particles).
Materials and methods
Site description
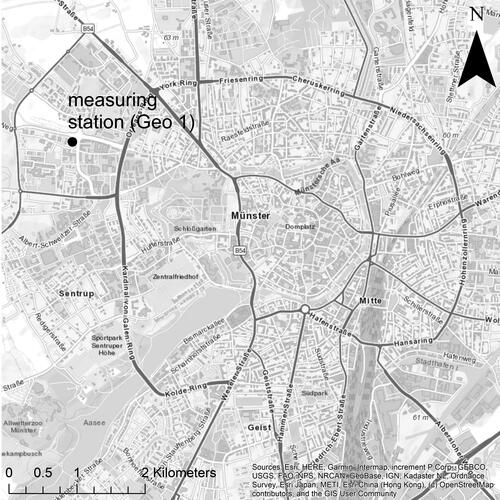
Aerosol sampling was conducted in the city of Münster, located in northwest Germany (). The city is situated in the Münsterland region, an area characterized by intensive agriculture, mainly livestock breeding. All samples and data were collected from 23 May 2019 through 18 June 2019 on the rooftop of the Geo 1 building of the University of Münster (51°58'08.3 "N 7°35'45.5 "E) at a height of 84 m above mean sea level (amsl). The building is located approximately 2.5 km northwest of the city center; a four-lane artery road runs directly along the building, and a major federal road passes by at a distance of 1 km to the northeast. In 2015, a manual traffic census counted an average of 28000 vehicles per day on the federal highway (Bundesanstalt für Straßenwesen Citation2017). The meteorological data were collected at a permanent, 15-m-high tower on the edge of the roof.
Figure 1. The location of the measurement station in Münster (OpenStreetMap contributors, and the GIS User Community).
Meteorological data
Wind speed and wind direction were measured by a Gill WindSonic ultrasonic anemometer (99 m amsl). An MPS-system TRwS204 Total Rain weighing sensor was used to determine the amount and intensity of precipitation (85.4 m amsl). Temperature and relative humidity were measured by a Young 41382VC Relative Humidity/Temperature Probe (99 m amsl), and air pressure was quantified by a Young 61302 V Barometric Pressure Sensor (85 m amsl). All meteorological data were recorded in 0.17 Hz. Following a quality check, data were merged to 10-min averages.
Aerosol sampling
Size-segregated aerosols were collected over four one-week periods, resulting in four sets of samples. To obtain two parallel samples for isotope and ion analysis, two Electrical Low Pressure Impactors (ELPI) were operated simultaneously. One device was a Dekati Outdoor air ELPI with a particle size resolution of 13 stages with 50%-cutoff-size bins ranging from 0.030 µm to 9.970 µm aerodynamic diameters. The air flow through the impactor is 30 L min−1 (Dekati Ltd. Citation2003). The suction hose had a length of 4.48 m, and the inlet was 3.27 m above the roof (87.27 m amsl). Commercially available aluminum foil was used as a collection substrate for the particles. Circles with a diameter of 25 mm were cut and rinsed with acetone before usage. After drying, they were placed on the collection plates of the ELPI. The second device was a Dekati ELPI + with a particle size resolution of 15 stages with 50%-cutoff-size bins from 0.006 µm up to 10.00 µm and an air flow of 10 L min−1 (Dekati Ltd. Citation2015). The suction hose had a length of 5.60 m, and the inlet was 3.34 m above the roof (87.34 m amsl). The filter substrate was tin foil (LabNeed, Tin Foil Disks, 30 mm diameter, 0.008 mm thickness), which was also cut into circles with a diameter of 25 mm and rinsed with acetone before usage. It was decided not to grease the filter substrates in both devices in order to prevent contamination of the samples. Field blank samples were taken before each measurement run. The blank foils were cut in the same way as the sample foils, rinsed with acetone, dried, inserted into the impactors, and removed directly. After completion of sample or blank collection, the substrates were promptly removed from the impactors, brought into the laboratory and stored dry in a Teflon vial at −20 °C until analysis.
Inorganic ion and isotopic analysis
Chemical analysis was conducted at the laboratory of the Institute of Landscape Ecology. Water-soluble ions were extracted from the aluminum foil pieces of the Outdoor air ELPI in 10 mL of deionized water and shaken horizontally for 2 hrs with 200 motions per minute. Each sample was then passed through a 0.22 µm pore size filter (Simplepure, NY + GF, 0.22 µm). For the concentrations of chloride (Cl-), nitrate (NO3-) and sulfate (SO42-) the solutes were analyzed using an ion chromatograph (Metrohm, 883 Basic IC plus) with a detection limit 0.5 mg L−1 for all ions. The concentration of ammonium (NH4+) was quantified by a continuous flow analyzer (Skalar, San++ Automated Wet Chemistry Analyzer) with a detection limit of 0.2 mg L−1. Due to the different stage resolution of the two impactors, the ion data had to be converted. The data generated with the Outdoor air ELPI were therefore normalized by the stage width and linearly interpolated to fit the ELPI + stage distribution. After interpolation, the values were projected to the stage width of the ELPI+. From the values determined, the concentration was calculated in relation to the respective weekly air flow of the impactor. All data work was carried out with the open-source R (R Core Team Citation2020) using the R packages “openair” (Carslaw and Ropkins Citation2012), “zoo” (Zeileis and Grothendieck Citation2005), “ggpubr” (Kassambara Citation2020), “ggplot2” (Wickham Citation2016) and "reshape2" (Wickham Citation2007).
Total nitrogen isotope analyses (δ15N-TN) were carried out in the Stable Isotope Laboratory at the Institute of Geology and Paleontology using a Flash EA IsoLink interfaced to a ThermoScientific Delta V Advantage mass spectrometer (EA-IRMS). The samples from the ELPI + collected on tin foil were used for these analyses. From each set, samples of ten stages and one blank were selected, considering sufficient particle mass concentration and ion concentration on the respective stage. The clean edge of each tin foil piece was first cut off with precision scissors, then the remaining foil containing the sample was folded and subjected to direct combustion in a single reactor packed with tungsten oxide and copper wire. Combustion temperature was set at 1020 °C. The blank samples were treated in the same way. Evolved gases were separated chromatographically in the order nitrogen (N2), then carbon dioxide (CO2) and finally sulfur dioxide (SO2) and measured without further dilution. Results are reported in the standard delta notation as per mil difference from the international reference standard AIR for nitrogen isotopes:
(1)
(1)
Analytical performance was monitored with international reference materials IAEA N1, IAEA N2, and USGS 40. Reproducibility as determined by replicate measurements of reference materials was better than ± 0.15 ‰. All samples were corrected for blanks.
Results and discussion
Influence of meteorological conditions on particle mass concentration
We determined the particle mass concentrations to study the influence of each size class on air quality. Reliable results could not be obtained for all samples due to insufficient particle masses, especially for small diameters. Consequently, only the data of the stages 6 to 13 () were considered. Within the respective size spectrum, we found two maxima of the aerosol mass concentrations, one at an accumulation range size range below 1 µm diameter (median of 4.21 µg m−3 in stage 8), which is typical for regional and long-range transport patterns (Deventer, Griessbaum, and Klemm Citation2013), and the other at a size just below 10 µm in diameter, representing coarse particles (median of 6.26 µg m−3 in stage 13), which are more typical for proximal sources () like road dust and soil (Minguillón et al. Citation2012).
Table 2. ELPI + stages, their 50% lower cutoff size bins and dlogDp multiplier vectors (Dekati Ltd. Citation2015). Median of the particle mass concentration and median of the total ion masses of nitrate, ammonium, chloride and sulfate over the entire measurement period.
In order to estimate the influence of meteorology on the aerosol particles, data from the meteorological station on the rooftop of the university building was evaluated. Apart from the first week, which was on average slightly cooler and drier than the other three weeks, the weather conditions during the measurement campaign were homogeneous (). Wind direction and wind speed were uniform, with prevailing main wind direction from southwest ( and ). Thus, the meteorological station was likely not affected by different sources of substances (gases or particles) due to rotating wind directions. The long-range transported air masses were, therefore, of oceanic origin and were influenced by local sources in the Münster area, mainly by emissions from agriculture and traffic (Gietl and Klemm Citation2009).
Figure 2. Absolute frequency of 10-min intervals of wind directions for each sampling week.
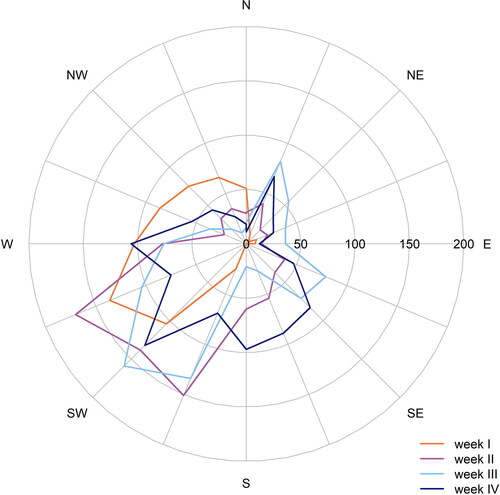
Figure 3. Box and whisker plots of the particle mass concentration over the entire measurement period. Rectangular boxes display the first and third quartiles. The line within each box represents the median value. Whiskers are shown according to Tukey, outliers are excluded.
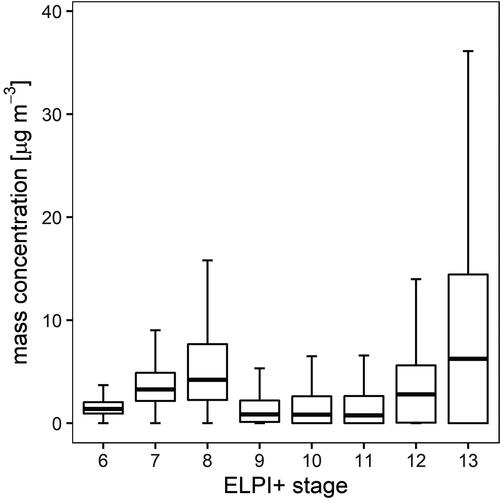
Table 1. Sampling periods and meteorological data obtained on the rooftop of the Geo 1 building of the University of Münster, Germany.
In a study in urban Russia, Stulov, Plaude, and Monakhova (Citation2010) found that in all particle size classes, the particle number concentration depends strongly on wind speed, while it does not depend much on precipitation. Therefore, small changes in total precipitation during our measurement period should have only a minor effect on the particle number concentration. However, the relative humidity of air does influence the composition of the aerosol particles. In contrast to most other species, the sulfate content increases with increasing air humidity (>50%), since aqueous-phase processing plays an increasingly important role (Sun et al. Citation2013). At the same time, the nitrate and ammonium content change insignificantly, which such that a higher portion of sulfate is present in air masses with higher relative humidity. During our measurement period, the relative humidity showed only a minor week-to-week variability, making the data comparable ().
Overall, any differences in particle mass concentration and composition were most likely not caused by changing meteorological conditions.
Inorganic ion analysis
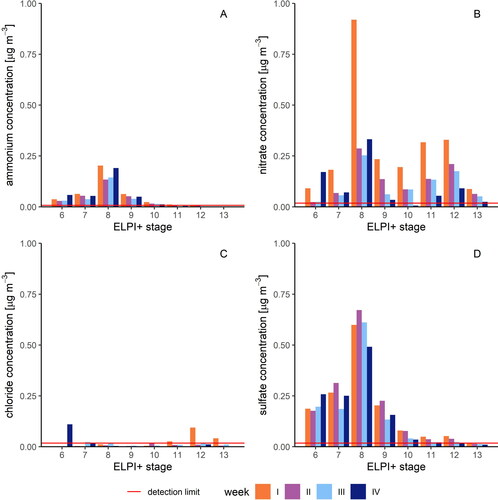
To identify the sources of the particulate matter at the urban site, we determined the matter’s anion concentrations. We found that the ions accounted for up to 39% of the total particle mass, on a median (). Taken together, the concentration of all four detected ions had the highest median in stage 8 (1.06 µg m−3) and the lowest in stage 13 (0.08 µg m−3). In more detail, nitrate was present in all stages, with peaks in stage 8 (up to 0.92 µg m−3) and stage 12 (up to 0.33 µg m−3) and a median of 0.09 µg m−3 across stages 6 to 13 (). The minimum value above the detection limit of 0.02 µg m−3 was observed in stage 6. The ammonium concentration was high in the small-diameter stages and decreased rapidly from stage 10 on (). The largest value (0.20 µg m−3) was found in stage 8 (). The median value of the NH4+ concentration for stages 6 to 13 was 0.03 µg m−3. A similar pattern was also evident for sulfate: stage 8 displayed the maximum value of 0.67 µg m−3, whereas stage 12 showed the minimum value of 0.02 µg m−3. The median across all weeks for stages 6 to 13 was at 0.11 µg m−3. The concentration of chloride was very small and mostly below the detection limit of 0.02 µg m−3, with a median value of 0.01 µg m−3 ().
Figure 4. Concentration of cations and anions in the respective sample week. (a) Particulate NH4+; (b) particulate NO3; (c) particulate Cl; (d) particulate SO42-.
Overall, the chemical composition we determined is consistent with previous findings on the formation and composition of aerosol particles in the literature. Certain precursor gases are required for the formation of secondary fine particulate matter, especially gases such as sulfur oxides (SOx), nitrogen oxides (NOx) and ammonia (NH3). The composition of inorganic ion species we found indicates that these gases are also the main precursors in Münster. Ammonia and inorganic acid gases, which are released from livestock, poultry farming, and from the use of liquid manure, can impair air quality through the formation of secondary particles in the fine dust range of PM2.5 (Koziel, Aneja, and Baek Citation2006).
The Münsterland region is an important agricultural region in Germany. With its milk, beef and pork production, it is one of the most important refining regions, and poultry farming has also increased significantly in recent years (Lammers and Becker Citation2014). The ammonia and ammonium deposition in the Münsterland region is over 18 kg N per hectare per year, twice the national average (Niederau and Jedrusiak Citation2005). The main sources of ammonia are intensive livestock farming and the application of liquid manure as fertilizer. The oxidation of sulfur dioxide and nitrogen oxides produces sulfuric acid (H2SO4) and nitric acid (HNO3). Ammonia neutralizes these acids in the atmosphere, forming ammonium sulfate and ammonium nitrate (Schiferl et al. Citation2014). In an ammonium-rich environment, such as the measuring site, the sulfate reacts primarily to form ammonium sulfate (Behera and Sharma Citation2010). The remaining ammonia is converted to ammonium nitrate. The pattern of ammonium concentration often corresponds to the sum of sulfate and nitrate in the fine particle fractions (Seinfeld and Pandis Citation2016).
Stages 5 to 10 contained, on average, more sulfate than nitrate. Most of the sulfuric acid present reacted to form ammonium sulfate and ammonium bisulfate, and the remaining ammonia was available for ammonium nitrate formation. Yet, ammonium nitrate concentrations have been shown to be enhanced in the Münster area by emissions from livestock farming (Gietl and Klemm Citation2009). While sulfate concentrations in Western Europe have generally decreased in recent years, ammonium concentrations have remained relatively constant. According to the German Environment Agency (Citation2019), sulfur dioxide emissions in Germany decreased by 94.3% from 1990 to 2017, whereas nitrogen oxide emissions decreased by 59% and ammonia emissions only decreased by 10.9%. Thus, nitrate has become increasingly important in the fine aerosol range (Wang et al. Citation2019).
In contrast to sulfate and ammonium, the nitrate concentrations within our weekly samples were also high in the larger particle classes. The low ammonium values in the larger stages indicate that nitrate is not present as ammonium nitrate in the coarse particle range. While previous studies have shown that nitrate is often present in coarse particles (Harrison and Yin Citation2004; Pakkanen Citation1996), there is no primary particle source for coarse particulate nitrate. Nonetheless, gaseous nitrogen species as gaseous nitric acid or fine particles containing nitrate can interact with existing coarse particles (Pakkanen Citation1996), and nitrate also attaches itself as a coating to already existing particles. Components of coarse particles could be abrasion from traffic, wind-eroded soil and sea spray (Liu and Harrison Citation2011) Sea salt particles in particular can interact with anthropogenic nitrate during their transport via urban areas, which may be the case in Münster, as Gietl and Klemm (Citation2009) found that the main wind direction from the southwest advects humid oceanic air masses with high sea salt content to Münster. There, sea salt can react with acidic pollutants whereas HCl volatilizes, leading to a reduction of the chloride concentration in aerosol particles. Aged sea salt that is present in the coarse particle range is thus greatly reduced in chloride (Crilley et al. Citation2017; Hoffman, Laskin, and Finlayson-Pitts Citation2004; Schiferl et al. Citation2014). Such chloride depletion was also confirmed in our measurement data, as hardly any chloride was detected across all size classes.
Isotopic fractionation processes in fine and coarse aerosol particles
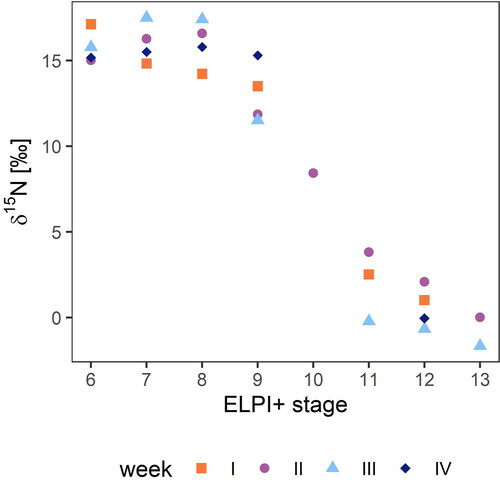
Nitrogen isotope measurements were only obtained for 26 samples due to sample limitations, but the results reveal a striking trend (). The fine particles were highly enriched in 15N, while as the D50% of the particles increased, particulate matter became more and more depleted in 15N. Namely, the particle classes with D50% between 0.15 and 0.60 µm showed δ15N values between +11 ‰ and +18 ‰, whereas the values of the coarse particle classes between 1.6 and 3.6 µm ranged from −2 ‰ to +4 ‰. Unfortunately, we could only obtain one reliable sample in stage 10 (D50% = 0.940 µm) to observe the transition of δ15N between fine and coarse particle fractions. The isotope ratio in this sample showed an intermediate position (8.43 ‰) between the fine and coarse particles ().
Figure 5. δ15N total nitrogen values for particle samples of each week.
In order to make assumptions about the origins of aerosol particles, previous studies have measured the isotope signatures of the precursor gases of particles. Felix et al. (Citation2013) studied isotope ratios of ammonia in the USA. They recorded 15N-NH3 values between −56 ‰ and −23 ‰ for volatilized livestock waste and values between −15 ‰ and −2 ‰ for fossil fuels. In 1990, Heaton determined the isotope ratios of NOx emitted by cars (-13 ‰ to − 2 ‰) and NOx emitted by coal-fired power plants (+6 ‰ to +13 ‰). More recent 15N-NOx values for gasoline powered vehicles has been reported to range between −13 ‰ and 9 ‰ and for diesel powered vehicles between −21 ‰ and −2 ‰ (Walters, Goodwin, et al. Citation2015; Walters, Goodwin, et al. Citation2015). The broader range of values from the more recent studies can be explained by the increased use of selective catalytic reducers. The catalytic reduction of NOx increases the δ15N-NOx values relative to the generated NOx (Walters, Goodwin, et al. Citation2015).
However, a recent study by Pan et al. (Citation2020) found that passive collections provided mean 15N-NH3 values that were almost 15 ‰ lower than those obtained with active sampling. This implies that many previous studies using passive measurement methods to collect NH3 may have obtained biased values.
Moreover, one cannot consider the isotope ratios in (condensed) aerosols as a direct consequence of different source signatures of the respective precursor gases. In 1977, Moore reported that chemical and physical processes in the atmosphere change the isotopic composition. For example, while the δ15N value of NH3 indicates the signature of the system prior to further processes, the δ15N in precipitation or aerosols represents the result of phase-change and removal mechanisms; heterogeneous reactions in which the condensed phase is removed leads to a fractionation of the N isotopes in the ammonia system (Moore Citation1977). Elliott et al. (Citation2019) conclude in their review article that due to the many NOy reactions taking place in the atmosphere, it is not easily possible to relate the 15N of the deposited atmospheric NO3- to that of the emitted NOx. A combination of source and isotope effects is therefore the most likely driver of the large fluctuations reported for the deposition of NO3 and NH4+ isotopes in environmental systems (Elliott et al. Citation2019).
According to Vodička et al. (Citation2019), organic compounds are mostly depleted in heavier isotopes because the underlying non-equilibrium process favors the lighter isotopes in the reaction products. For inorganic species, however, the equilibrium effect is usually predominant. Equilibrium isotope effects occur during reversible chemical reactions or phase changes. In these reactions, the heavier isotope is bound in the most stable compounds with the lowest total energy. Several studies have indicated that 15N is depleted in the precursor gases and enriched in precipitation, especially in aerosol particles (Heaton, Spiro, and Robertson Citation1997; Moore Citation1977; Ti et al. Citation2018; Vodička et al. Citation2019); this fractionation effect was further quantified by Heaton, Spiro, and Robertson (Citation1997). They exposed filters with ammonium sulfate to an atmosphere enriched with ammonia gas, and they exposed filters with ammonium nitrate to nitric acid vapor. The calculated enrichment factor (ε), defined as δion - δgas, is +33 ‰ for the NH3/NH4+ system and +21 ‰ for HNO3/NO3-. Pan et al. (Citation2016) found δ15N-NH4+ values between −37.1 ‰ and 5.8 ‰ in fine particles during haze periods in an urban area in China. In order to draw conclusions about the precursor gases, they used the enrichment factor by Heaton, Spiro, and Robertson to determine hypothetical δ15N-NH3 ratios. This enabled them to confirm fossil sources in the majority of cases. If we apply these factors to our data, we can likewise draw conclusions about the precursor gases. Assuming that only ammonia plays a significant role as a precursor gas for fine particles, we calculated δ15N-NH3 values between −24.6 ‰ and −15.5 ‰ for the particles with a D50% between 0.15 and 0.94 µm at our site, which is consistent with the signatures measured by Felix et al. (Citation2013) in areas with high livestock production. Even if the latest findings of Pan et al. (Citation2020) are taken into account and a bias of −15 ‰ is considered for the values of Felix et al. (Citation2013), this assumption still applies quite well. By further assuming that nitrogen oxides are the main precursor of nitrate in the coarse particles, we then subtracted the respective enrichment factor from our values (Heaton, Spiro, and Robertson Citation1997), resulting in δ15N-NOx values between −22.7 ‰ and −17.19 ‰. These values are considerably lower than those determined by Heaton (Citation1990) for δ15N-NOx from precursors. Thus, the fractionation effect observed in the laboratory matches the isotope ratios we observed in the fine particles when we assume ammonia as a precursor. However, as the isotope values for the coarse particles cannot be represented by the laboratory values, this approach does not explain the wide range of isotope values found here between the different particle size classes. The values vary between +18 ‰ in the fine particle classes and −2 ‰ in the coarse classes.
Mkoma et al. (Citation2014) observed a similar order of magnitude in aerosol particles with higher δ15N-TN ratios in fine particles than in coarse particles, i.e., average values of 17.4 ‰ for PM2.5 and 12.1 ‰ for PM10. Also, Freyer (Citation1991) reported higher δ15N values for NO3- in fine aerosol particles (<3.5 µm) than in coarse particles (>3.5 µm). Under conditions comparable to those in our study during summer, respective values ranged, on average, from +4.2 ‰ to −1.4 ‰.
Assuming that NH3 and NOx cycles are not coupled (Moore Citation1977), the respective dominance of these species in the different size classes and the underlying processes represent the reasons for the observed wide range in δ15N. Therefore, the two formation pathways for particulate nitrogen seem to differ in their degree of isotope fractionation.
Direct absorption of HNO3 into existing aerosols can enhance the nitrate content of particles in the coarse range (Freyer Citation1991); this presumption is supported by the ion composition of the coarse particles, which likely consist of aged sea salt (Schiferl et al. Citation2014). Nitric acid is highly hydrophilic and deposits very quickly onto existing surfaces, and nitric acid is enriched in 15N in relation to its precursor gases, because equilibrium fractionation occurs during the oxidation of NOx (Savard et al. Citation2017). In a study that quantified the net isotope effect of gas-to-particle conversion from NOx to NO3-, Chang et al. (Citation2018) used a model calculation and determined an isotope effect of 15.33 ‰ ± 4.90 ‰ for an urban, high-traffic area in China. If this isotope effect is applied to the isotope ratios of the presumed predecessor gases, i.e., NOx for the coarse particles, hypothetical values for the particles can be calculated. Adding this isotope effect to the δ15N-NOx values reported for traffic by Heaton (Citation1990) result in δ15N-NO3- values around 0 ‰, which correspond well to values obtained in this study for the coarse particles. Once absorbed, NOx rarely evaporates again; in non-equilibrium processes such as this (absorption), the isotopic fractionation is very low (Vodička et al. Citation2019). Consequently, we can exclude an additional enrichment in 15N in the coarse particle spectrum. Furthermore, coarse particles are more likely to be deposited and more frequently washed out by rain (Freyer Citation1991). Such coarse particles are enriched in 15N compared to the precursor gas, but to a much lesser degree than fine particles are.
Regarding N fractionation in fine particles, the fine particles mainly consist of semi-volatile ammonium nitrate, and the degree of isotopic fractionation is determined by the chemical equilibrium between gas phase and aqueous or solid phase (Savard et al. Citation2017). A shift in the dissociation equilibrium leads to the partwise evaporation of NH4NO3. Thereby, the lighter 14N isotope is preferred, which leads to a 15N enrichment in the residual fraction of the particulate nitrate.
Elliott et al. (Citation2019) conclude that the combined effects of source changes, seasonal variations in reaction chemistry and temperature-dependent fractionation factors exert an influence on the isotope ratios. The seasonal δ15N-NO3 and δ15N-NH4+ values are generally lower in the summer months and higher in the winter months and the combustion of fossil fuels influences the δ15N values to a higher extent in the colder months. However, we cannot track this seasonality due to the sole measurement campaign in summer.
Due to the constant availability of NH3 at our measuring site, it is likely that dissociation occurs and ammonium nitrate forms, such that 15N progressively accumulates in the aerosol particles. Furthermore, the formation of ammonium sulfate influences the δ15N of total nitrogen; namely, as soon as a chemical balance is reached, NH4+ stabilizes with higher 15N values than the precursor gas NH3 (Heaton, Spiro, and Robertson Citation1997). Given the high ammonium sulfate content in our samples, this effect contributes to the higher δ15N for the fine particle fraction. In addition, fine particles are more reactive due to their larger surface-to-volume ratios, and they have a longer residence time in the atmosphere than coarse particles. All these factors lead to higher δ15N values in the fine particle fraction (Vodička et al. Citation2019), which the observed data from this study confirms. Thus, our findings support the hypothesis that the observed differences in δ15N result from fractionation processes rather than from particles that came from different sources.
Despite this overall agreement, artifacts cannot be excluded from our results. Due to the long residence time of the filters in the device, further reactions cannot be completely excluded. Volatilization of NO3- from the impaction surface can lead to further accumulation of 15N in the remaining material, a process that has been shown to be potentially relevant for filters (Freyer Citation1991). Appel, Tokiwa, and Haik (Citation1981) also showed that inert filters such as Teflon are affected by negative errors due to the volatilization of NH4NO3 and the volatilization of HNO3. However, we do not consider these processes to be prominent in our case, since the differences in δ15N ratios are substantial for fine versus coarse particles.
Furthermore, particle losses cannot be excluded due to the length of the suction hose. According to Kumar et al. (Citation2008), however, the losses for particles larger than 0.02 µm are moderate. Since the losses should also have no influence on the isotope ratios, we also assume this influence to be negligible.
Conclusion
During summer, the atmospheric nitrogen budget in Münster is characterized by high ammonia concentrations resulting from agriculture in the surrounding Münsterland and high nitrate emissions caused by traffic in the city. As clearly shown, δ15N values reported for total nitrogen are not uniform across the size range of particulate matter. Size-resolved collection and analytical strategies such as the ones applied here are necessary to understand the complex chemical processes that occur during the formation of atmospheric particles. In particular, our size-resolved sample collection routine allows for a greater size resolution of particles upon which δ15N can be determined. The difference in δ15N between fine and coarse particles is greater than shown by previous models and laboratory experiments, and this difference results from different fractionation processes that occur during particle formation. In both fine and coarse particles, these processes lead to an enrichment of the heavier 15N isotope; however, the fine particles are subject to equilibrium exchange processes that lead to a further enrichment in 15N. Furthermore, fine particles’ higher reactivity due to their larger surface areas and their longer residence times in the atmosphere account for the observed large difference in δ15N for fine and coarse particles. Our results show that there is no distinct difference in the formation processes of fine and coarse particles, and the gradual decrease of the δ15N-TN values from fine to coarse particles suggests a smooth transition from the dominant fractionation processes in fine particles to those in coarse particles. Nonetheless, this study is a feasibility study. Further measurements are required for a better understanding of the isotope fractionation processes of atmospheric nitrogen compounds in order to improve our understanding of a possible temperature dependence of these processes as well as the influence of other sources such as seasonal agricultural activity, measurement campaigns during various seasons of the year including winter should be performed. Furthermore, determining the δ15N for individual species of nitrogen (nitrate, ammonium, organic N) with a high particle size resolution and of the precursor gases (nitrogen oxides, ammonia) would be of great value.
Acknowledgment
For support and chemical analysis, the authors are grateful to the laboratory of the Institute of Landscape Ecology. Many thanks also go to Artur Fugmann from the Stable Isotope Laboratory at the Institute of Geology and Paleontology for the isotope analyses and scientific assistance. We also thank Celeste Brennecka for the language editing of the final manuscript and two anonymous reviewers for their helpful comments.
References
- Dekati Ltd. 2003. Elpi user manual, 2003.
- Dekati Ltd. 2015. Dekati® elpi + user manual, 2015.
- Appel, B. R., Y. Tokiwa, and M. Haik. 1981. Sampling of nitrates in ambient air. Atmos. Environ. (1967) 15 (3):283–9. doi:https://doi.org/10.1016/0004-6981(81)90029-9.
- Behera, S. N., and M. Sharma. 2010. Investigating the potential role of ammonia in ion chemistry of fine particulate matter formation for an urban environment. Sci. Total Environ. 408 (17):3569–75. doi:https://doi.org/10.1016/j.scitotenv.2010.04.017.
- Beyn, F., V. Matthias, and K. Dähnke. 2014. Changes in atmospheric nitrate deposition in Germany-an isotopic perspective. Environ. Pollut. 194:1–10. doi:https://doi.org/10.1016/j.envpol.2014.06.043.
- Carslaw, D. C., and K. Ropkins. 2012. Openair — an r package for air quality data analysis.
- Chang, Y., Y. Zhang, C. Tian, S. Zhang, X. Ma, F. Cao, X. Liu, W. Zhang, T. Kuhn, and M. F. Lehmann. 2018. Nitrogen isotope fractionation during gas-to-particle conversion of no x to no 3− in the atmosphere – implications for isotope-based no x source apportionment. Atmos. Chem. Phys. 18 (16):11647–61. doi:https://doi.org/10.5194/acp-18-11647-2018.
- Crilley, L. R., F. Lucarelli, W. J. Bloss, R. M. Harrison, D. C. Beddows, G. Calzolai, S. Nava, G. Valli, V. Bernardoni, and R. Vecchi. 2017. Source apportionment of fine and coarse particles at a roadside and urban background site in London during the 2012 summer clearflo campaign. Environ. Pollut. 220 (Pt B):766–78. doi:https://doi.org/10.1016/j.envpol.2016.06.002.
- Deventer, M. J., F. Griessbaum, and O. Klemm. 2013. Size-resolved flux measurement of sub-micrometer particles over an urban area. Metz. 22 (6):729–37. doi:https://doi.org/10.1127/0941-2948/2013/0441.
- Elliott, E. M., Z. Yu, A. S. Cole, and J. G. Coughlin. 2019. Isotopic advances in understanding reactive nitrogen deposition and atmospheric processing. Sci. Total Environ. 662:393–403. doi:https://doi.org/10.1016/j.scitotenv.2018.12.177.
- Felix, J. D., and E. M. Elliott. 2014. Isotopic composition of passively collected nitrogen dioxide emissions: Vehicle, soil and livestock source signatures. Atmos. Environ. 92:359–66. doi:https://doi.org/10.1016/j.atmosenv.2014.04.005.
- Felix, J. D., E. M. Elliott, T. J. Gish, L. L. McConnell, and S. L. Shaw. 2013. Characterizing the isotopic composition of atmospheric ammonia emission sources using passive samplers and a combined oxidation-bacterial denitrifier approach. Rapid Commun. Mass Spectrom. 27 (20):2239–46. doi:https://doi.org/10.1002/rcm.6679.
- Freyer, H. D. 1991. Seasonal variation of 15n/14n ratios in atmospheric nitrate species. Tellus B. 43 (1):30–44. doi:https://doi.org/10.1034/j.1600-0889.1991.00003.x.
- German Environment Agency 2019. Daten zur umwelt: Daten der deutschen berichterstattung atmosphärischer emissionen – luftschadstoffe. Dessau: German Environment Agency.
- Gietl, J. K., and O. Klemm. 2009. Source identification of size-segregated aerosol in münster, Germany, by factor analysis. Aerosol. Sci. Technol. 43 (8):828–37. doi:https://doi.org/10.1080/02786820902953923.
- Harrison, R., and J. Yin. 2004. Characterisation of particulate matter in the united kingdom: Literature review, The University of Birmingham.
- Heaton, T. H. E. 1990. 15n/14n ratios of nox from vehicle engines and coal-fired power stations. Tellus B. 42 (3):304–7. doi:https://doi.org/10.1034/j.1600-0889.1990.00007.x-i1.
- Heaton, T. H. E., B. Spiro, and S. M. C. Robertson. 1997. Potential canopy influences on the isotopic composition of nitrogen and sulphur in atmospheric deposition. Oecologia. 109 (4):600–7. doi:https://doi.org/10.1007/s004420050122.
- Hoffman, R. C., A. Laskin, and B. J. Finlayson-Pitts. 2004. Sodium nitrate particles: Physical and chemical properties during hydration and dehydration, and implications for aged sea salt aerosols. J. Aerosol Sci. 35 (7):869–87. doi:https://doi.org/10.1016/j.jaerosci.2004.02.003.
- Kassambara, A. 2020. Ggpubr: 'ggplot2' based publication ready plots (version R package version).
- Kawanaka, Y., E. Matsumoto, N. Wang, S.-J. Yun, and K. Sakamoto. 2008. Contribution of nitrated polycyclic aromatic hydrocarbons to the mutagenicity of ultrafine particles in the roadside atmosphere. Atmos. Environ. 42 (32):7423–8. doi:https://doi.org/10.1016/j.atmosenv.2008.06.032.
- Koziel, J. A., V. P. Aneja, and B.-H. Baek. 2006. Gas-to-particle conversion process between ammonia, acid gases, and fine particles in the atmosphere. Animal Agriculture and the Environment: National Center for Manure and Animal Waste 67:201–24.
- Kumar, P., P. Fennell, J. Symonds, and R. Britter. 2008. Treatment of losses of ultrafine aerosol particles in long sampling tubes during ambient measurements. Atmos. Environ. 42 (38):8819–26. doi:https://doi.org/10.1016/j.atmosenv.2008.09.003.
- Kundu, S., K. Kawamura, and M. Lee. 2010. Seasonal variation of the concentrations of nitrogenous species and their nitrogen isotopic ratios in aerosols at gosan, jeju island: Implications for atmospheric processing and source changes of aerosols. J. Geophys. Res. 115 (D20):0148–0227. doi:https://doi.org/10.1029/2009JD013323.
- Lammers, M., and T. Becker. 2014. Landwirtschaft im münsterland: Daten - fakten - analysen, Landwirtschaftskammer Nordrhein-Westfalen, Bonn.
- Lee, T., X. Yu, B. Ayres, S. Kreidenweis, W. Malm, and J. Collettjr. 2008. Observations of fine and coarse particle nitrate at several rural locations in the united states. Atmos. Environ. 42 (11):2720–32. doi:https://doi.org/10.1016/j.atmosenv.2007.05.016.
- Liu, Y.-J., and R. M. Harrison. 2011. Properties of coarse particles in the atmosphere of the united kingdom. Atmos. Environ. 45 (19):3267–76. doi:https://doi.org/10.1016/j.atmosenv.2011.03.039.
- Minguillón, M. C., X. Querol, U. Baltensperger, and A. S. H. Prévôt. 2012. Fine and coarse pm composition and sources in rural and urban sites in switzerland: Local or regional pollution? Sci. Total Environ. 427-428:191–202. doi:https://doi.org/10.1016/j.scitotenv.2012.04.030.
- Mkoma, S. L., K. Kawamura, E. Tachibana, and P. Fu. 2014. Stable carbon and nitrogen isotopic compositions of tropical atmospheric aerosols: Sources and contribution from burning of c 3 and c 4 plants to organic aerosols. Tellus B: Chemical and Physical Meteorology 66 (1):20176. doi:https://doi.org/10.3402/tellusb.v66.20176.
- Moore, H. 1974. Isotopic measurement of atmospheric nitrogen compounds. Tellus 26 (1-2):169–74. doi:https://doi.org/10.1111/j.2153-3490.1974.tb01963.x.
- Moore, H. 1977. The isotopic composition of ammonia, nitrogen dioxide and nitrate in the atmosphere. Atmos. Environ. (1967) 11 (12):1239–43. doi:https://doi.org/10.1016/0004-6981(77)90102-0.
- Niederau, H., and T. Jedrusiak. 2005. Gewässerbelastung durch stickstoffeinträge im münsterland, Staatliches Umweltamt Münster, Münster.
- OpenStreetMap contributors, and the GIS User Community. 2021. Arcgis. Esri, HERE, Garmin, FAO, NOAA, USGS.
- Pachauri, R. K., and L. Mayer. 2015. Climate change 2014: Synthesis report.
- Pakkanen, T. A. 1996. Study of formation of coarse particle nitrate aerosol. Atmos. Environ. 30 (14):2475–82. doi:https://doi.org/10.1016/1352-2310(95)00492-0.
- Pan, Y., M. Gu, L. Song, S. Tian, D. Wu, W. W. Walters, X. Yu, X. Lü, X. Ni, Y. Wang, et al. 2020. Systematic low bias of passive samplers in characterizing nitrogen isotopic composition of atmospheric ammonia. Atmos. Res. 243:105018. doi:https://doi.org/10.1016/j.atmosres.2020.105018.
- Pan, Y., S. Tian, D. Liu, Y. Fang, X. Zhu, Q. Zhang, B. Zheng, G. Michalski, and Y. Wang. 2016. Fossil fuel combustion-related emissions dominate atmospheric ammonia sources during severe haze episodes: Evidence from (15)n-stable isotope in size-resolved aerosol ammonium. Environ. Sci. Technol. 50 (15):8049–56. doi:https://doi.org/10.1021/acs.est.6b00634.
- R Core Team. 2020. R: A language and environment for statistical computing. R foundation for (version 4.0.0). Vienna, Austria: R Foundation for Statistical Computing.
- Savard, M. M., A. Cole, A. Smirnoff, and R. Vet. 2017. Δ 15 n values of atmospheric n species simultaneously collected using sector-based samplers distant from sources – isotopic inheritance and fractionation. Atmos. Environ. 162:11–22. doi:https://doi.org/10.1016/j.atmosenv.2017.05.010.
- Schiferl, L. D., C. L. Heald, J. B. Nowak, J. S. Holloway, J. A. Neuman, R. Bahreini, I. B. Pollack, T. B. Ryerson, C. Wiedinmyer, and J. G. Murphy. 2014. An investigation of ammonia and inorganic particulate matter in california during the calnex campaign. J. Geophys. Res. Atmos. 119 (4):1883–902. doi:https://doi.org/10.1002/2013JD020765.
- Seinfeld, J. H., and S. N. Pandis. 2016. Atmospheric chemistry and physics: From air pollution to climate change. 3rd ed. s.l. Hoboken, NJ: Wiley.
- Spirig, C., and A. Neftel. 2006. Ammoniakemissionen aus der landwirtschaft und feinstaub. AGRARForschung 13 (9):392–7.
- Straßenwesen, B. f. 2017. Verkehrsstärkenkarte 2015: Periodische verkehrszählungen. Accessed November 5, 2020. https://www.strassen.nrw.de/de/verkehr/verkehrsbelastung.html.
- Stulov, E. A., N. O. Plaude, and I. A. Monakhova. 2010. Weather effects on the aerosol characteristics in the surface layer of the atmosphere. Russ. Meteorol. Hydrol. 35 (2):94–100. doi:https://doi.org/10.3103/S1068373910020020.
- Sun, Y., Z. Wang, P. Fu, Q. Jiang, T. Yang, J. Li, and X. Ge. 2013. The impact of relative humidity on aerosol composition and evolution processes during wintertime in Beijing, China. Atmos. Environ. 77:927–34. doi:https://doi.org/10.1016/j.atmosenv.2013.06.019.
- Ti, C., B. Gao, Y. Luo, X. Wang, S. Wang, and X. Yan. 2018. Isotopic characterization of nhx-n in deposition and major emission sources. Biogeochemistry 138 (1):85–102. doi:https://doi.org/10.1007/s10533-018-0432-3.
- Vodička, P., K. Kawamura, J. Schwarz, B. Kunwar, and V. Ždímal. 2019. Seasonal study of stable carbon and nitrogen isotopic composition in fine aerosols at a central european rural background station. Atmospheric Chem. Phys. 19 (6):3463–79. doi:https://doi.org/10.5194/acp-19-3463-2019.
- Walters, W. W., S. R. Goodwin, and G. Michalski. 2015. Nitrogen stable isotope composition (δ15n) of vehicle-emitted nox. Environ. Sci. Technol. 49 (4):2278–85. doi:https://doi.org/10.1021/es505580v.
- Walters, W. W., and G. Michalski. 2015. Theoretical calculation of nitrogen isotope equilibrium exchange fractionation factors for various no y molecules. Geochim. Cosmochim. Acta. 164:284–97. doi:https://doi.org/10.1016/j.gca.2015.05.029.
- Walters, W. W., B. D. Tharp, H. Fang, B. J. Kozak, and G. Michalski. 2015. Nitrogen isotope composition of thermally produced nox from various fossil-fuel combustion sources. Environ. Sci. Technol. 49 (19):11363–71. doi:https://doi.org/10.1021/acs.est.5b02769.
- Wang, Y., Y. Chen, Z. Wu, D. Shang, Y. Bian, Z. Du, S. H. Schmitt, R. Su, G. I. Gkatzelis, P. Schlag, et al. 2019. Mutual promotion effect between aerosol particle liquid water and nitrate formation lead to severe nitrate-dominated particulate matter pollution and low visibility.
- Wickham, H. 2007. Reshaping data with the {reshape} package (version 21(12)). J. Stat. Softw. 21 (12):1–20. doi:https://doi.org/10.18637/jss.v021.i12.
- Wickham, H. 2016. Ggplot2: Elegant graphics for data analysis. New York: Springer-Verlang.
- Yeatman, S. G., L. J. Spokes, P. F. Dennis, and T. D. Jickells. 2001. Can the study of nitrogen isotopic composition in size-segregated aerosol nitrate and ammonium be used to investigate atmospheric processing mechanisms? Atmos. Environ. 35 (7):1337–45. doi:https://doi.org/10.1016/S1352-2310(00)00457-X.
- Zeileis, A., and G. Grothendieck. 2005. zoo: S3 Infrastructure for Regular and Irregular Time Series. J. Stat. Softw. 14 (6):1–27.