
 ?Mathematical formulae have been encoded as MathML and are displayed in this HTML version using MathJax in order to improve their display. Uncheck the box to turn MathJax off. This feature requires Javascript. Click on a formula to zoom.
Abstract
In this work, the effect of relative humidity, RH, on the readouts of five light-scattering-based PM sensors were investigated by using particles composed of different hydroscopic materials and comparing the readouts with those measured by Tapered Element Oscillating Microbalance (TEOM). It was found the RH has various effects on the readouts of PM sensors, highly depending on the hydroscopic property of particles. Negligible RH effect on the PM sensors’ readouts was observed for hydrophobic particles while significant increase in the readouts was observed for hydroscopic particles at the RH setting higher than the deliquescence relative humidity, DRH, of particle materials. For particles in the binary components, the effect of the mixture deliquescence on the sensor readouts depends on the hygroscopicity of composite materials (e.g., NaCl + Glucose; NaCl + OA; NaCl + K2SO4). In the case of NaCl + OA, the water uptake of resultant NaCl + OA particles is less than that of pure NaCl and OA (because of the possible formation of less hygroscopic di-sodium oxalate, Na2C2O4, in particles). The readouts of PM sensors were also influenced by the mixing status of particles, i.e., internally vs. externally mixed. The correlation slopes for different PM sensors were compared. More, the sampling misalignment was found affecting the readouts of some PM sensors. It is thus suggested to calibrate PM sensors using field particles under the application environments for getting PM data in good quality (assuming that the seasonal change of field RH, and the size distribution and composition of field particles is minor).
Copyright © 2021 American Association for Aerosol Research
EDITOR:
1. Introduction
Airborne Particulate Matter (PM) is a mixture of particles (in both solid and liquid) suspended in air that often varies in the size distribution and chemical composition in space and time. Various chemicals have been identified in atmospheric PM. Among these chemicals, the most common constituents include inorganic ions (e.g., sulfates, nitrates, ammonium, sodium, potassium, calcium, magnesium and chloride), elemental and organic carbons, organic compounds (e.g., polycyclic aromatic hydrocarbons, PAH), biological compounds (e.g., endotoxin, cell fragments) and crustal material and metals (e.g., cadmium, copper, nickel, vanadium and zinc) (Brook et al. 2004; Kim, Kabir, and Kabir Citation2015). Based on the generation routes, PM can be divided as the primary PM emitted directly into the atmosphere and the secondary PM generated through physicochemical transformation of gaseous precursors. The sources of PM can be both natural and anthropogenic including volcanoes, dust storms, forest fires, living vegetation, sea spray, road dust, vehicle emission, fuel combustion, and industrial and agriculture activities. The PM in the Atmosphere may change the cloud coverage, decrease the visibility, and have a complex effect on the climate change (Hansen and Sato Citation2001; Jacobson Citation2002; Potter and Colman Citation2003). Studies have found both the long-term chronic PM exposure and the acute increase of ambient PM would increase the cardiovascular morbidity and mortality, aggravate the respiratory symptoms, and increase the lung cancer mortality (Dockery et al. Citation1993; Dominici et al. Citation2006; Gent et al. Citation2009; Pope et al. Citation2004). With the consideration of the adverse effect of the PM exposure on both the human health and environment, many countries and regions have released their standards to regulate the ambient mass concentration of both PM2.5 and PM10. For examples, the US Environment Protection Agency (EPA) released the National Ambient Air Quality Standard (NAAQS, 40 CFR part 50) setting a 24-h average mass concentration upper limit of 35 µg·m−3 and 150 µg·m−3 for PM2.5 and PM10, respectively. In Europe, an annual average upper limit of 25 µg·m−3 and a 24-h average upper limit of 50 µg·m−3 are set for PM2.5 and PM10, respectively, under the new air quality directive (UNION Citation2008). In China, the Grade-I 24-h PM2.5 and PM10 average mass concentration upper limit are set as 35 µg·m−3 and 50 µg·m−3, respectively (based on the National Ambient Air Quality Standard, NAAQS, GB3095-2012). The mass concentration of PM is assessed by the reference methods. In the United States, either federal reference method (FRM) or federal equivalent methods (FEMs), defined in the 40 CFR 53, are recommended. The mass concentration measured by the FRM/FEMs is generally in a high accuracy. However, due to the high cost and laborious maintenance, the instruments for FRM/FEMs are typically only utilized in the monitoring stations required by the standards. The PM exposure data at the small community and personal levels are typically interpolated from the data collected by the above standard PM network. Because of the sparse distribution of the standard PM stations in space, the accuracy of the interpolated PM exposure-especially for residents in heavy traffic cities, and local communities in close proximity to high traffic highways-is often in question.
Cost-effective (or so called low-cost) PM sensors have been recently utilized to build up an air quality monitoring network to collect the PM data in a high spatial resolution. For examples, Gao, Cao, and Seto (Citation2015) used seven portable PM sensors (i.e., Shinyei PPD42NS) to measure the spatiotemporal variation of PM2.5 in Xi’an, China. They found the sensors were able to identify the potential PM2.5 hotspot. Snik et al. (2014) distributed more than 8,000 smartphone spectropolarimeters in the Netherlands to obtain the maps of aerosol property in high spatiotemporal resolution. The aerosol optical thickness (AOT) maps derived from the spectro-polarimetric measurement were in good agreement with those derived from the satellite images and ground-based precision photometry with a high spatial resolution.
The performance of cost-effective PM sensors has been widely investigated in the literatures. Holstius et al. (Citation2014) did the field calibration of the low-cost sensors (Shinyei PPD42NS) using the 1 h and 24 h data measured by FEMs and research instruments, and a good linear correlation between both datasets was observed. Wang et al. (Citation2015) evaluated three cost-effective PM sensors (Shinyei PPD42NS, Samyoung DSM501S, and Sharp GP2Y1010AU0F) in the laboratory setting. They found all the sensors demonstrated high linearity against the portable PM meters in the concentration range of 0–1000 µg·m−3, and the sensors’ performance was dependent on the particle size and composition. Sousan et al. (Citation2016) evaluated the performance of two low-cost sensors (i.e., Alphasense OPC-N2 and PAS-1.108) using salt particles, welding fume and ARD dust. The counting efficiency of both sensors as a function of particle sizes was also evaluated using PSL particles. Good linear correlations between the readouts of each sensor and reference instruments were found. Liu et al. (Citation2017) calibrated four cost-effective PM sensors (Shinyei PPD42NS, Samyoung DSM501A, Sharp GP2Y1010AU0F, and Oneair CP-15-A4) using the lab-generated particles to investigate the effect of particle size distribution and composition on the readouts of the PM sensors. The Tapered Element Oscillation Microscope (TEOM; Thermal Scientific Model 1405) was selected as the reference instrument for the particle mass concentration measurement. They found the increase of the mean particle size and the standard deviation of particle size distributions resulted in an increase on the readouts of the PM sensors. Kelly et al. (Citation2017) tested the PM sensor (PMS 1003/3003) both in the wind tunnel and under the ambient environment. They concluded the sensor’s readouts linearly correlated with the data collected by FRM, FEMs and research instruments in both settings. All these previous studies serve as the evidence that cost-effective PM sensors could be applied to map the PM concentration in a high spatial and temporal resolution, but they are required to be calibrated well and periodically. It is because various factors could influence the readouts of cost-effective PM sensors.
The relative humidity (RH) is an important factor among all the factors affecting the readouts of cost-effective PM sensors. For particles made of the hygroscopic material, they will take up water until all the solid is dissolved in water and become droplets, which is called deliquescence when the ambient RH is equal to or higher than its deliquescence relative humidity (DRH or critical relative humidity, CRH). The hygroscopic growth of particles due to the water uptake would affect the readout of PM sensors. More, under a high RH condition, the water moisture may condense on the circuit boards of cost-effective PM sensors if they are not well protected, causing undesired bridging across electronic components and the performance failure of the circuit boards (Jayaratne et al. Citation2018; Wang et al. Citation2015). Some studies have been published regarding the RH effect on the performance of cost-effective PM sensors. Holstius et al. (Citation2014) reported negligible RH effect on the performance of the low-cost sensor (Shinyei PPD42NS) when they did the field calibration with the RH value ranging from 10% to 60%. No higher RH condition was encountered during the above field calibration. Wang et al. (Citation2015) calibrated three PM sensors (Shinyei PPD42NS, Samyoung DSM501A and Sharp GP2Y1010AU0F) using the lab generated NaCl particles at the RH of 20%, 67%, 75% and 90%. They observed the outputs of the sensors first increased, and then decreased as the RH increased. Note that, in the above study, the referenced mass concentration of test particles was derived from the size distribution measured by a Scanning Mobility Particle Sizer (SMPS), which may amplify the measurement errors when converting the number-based size distribution measured by a SMPS to the mass-based size distribution. Further, the sensors of Shinyei PPD42NS and Samyoung DSM501A utilize the natural convention, with the temperature field created by heating a resister near the sensor inlet, to sample ambient particles. The elevated temperature in the sensors is expected to reduce the RH of sampled particle stream compared with the ambient RH. Han, Symanski, and Stock (Citation2017) investigated the effect of RH on the ratio of the mass concentrations measured by the PM sensor (Dylos DC 1700) to the research instrument (Grimm 11-R) in the ambient environment. They concluded when the RH was higher than 60%, the PM sensor overestimated the referenced PM mass concentration. Jayaratne et al. (Citation2018) investigated the influence of humidity on the performance of the cost-effective PM sensors (Plantower PMS1003) in both the laboratory and ambient settings. They observed a significant readout increase at the RH above 75%. Crilley et al. (Citation2018) also found the cost-effective sensor (Alphasense OPC-N2) demonstrated a significant increase of PM mass concentration when the RH value was higher than 85% in the field study.
While works have been reported regarding the RH effect on the readouts of cost-effective PM sensors in both laboratory and ambient settings, the use of pure NaCl particles in the lab calibration oversimplifies particles in the ambient. The field calibration of PM sensors makes it difficult to generalize the gained knowledge for their applications in different environments. Various measurement issues also arise in the selected reference instruments whose working principles are not directly related to the mass concentration of particles. In this work, five cost-effective PM sensors, popularly used in the field applications (by our literature survey), were selected. An experimental setup with the RH control feature was put together to calibrate the selected PM sensors under the RH setting up to 85%. The sensor readouts for particles in different hygroscopicity were first studied under various RH conditions. Particles in different binary compositions (i.e., internally mixed), which simulate ambient particles, were also prepared, and the sensor readouts for these bi-component particles were examined under different RH settings. The performance of PM sensors was further compared using both internally and externally mixed particles (while keeping the volumetric percentage of particles constant). The slopes of the correlation lines between the readouts of the selected PM sensors and those of the reference instrument were then compared under different RHs. In addition to the RH effect, the effect of the sampling misalignment on the readouts of selected PM sensors was lastly investigated.
2. PM sensors and experiments
2.1. Selected cost-effective PM sensors
Five cost-effective PM sensors, i.e., Luftmy LD12, Luftmy LD16, Nova SDS018, Sensirion SPS30 and Alphasense OPC-N2, are selected for this study. shows the specification of selected cost-effective PM sensors. The working principles of these PM sensors are all based on the light scattering, i.e., the intensity of the scattered light when single/multiple particles intercept a beam of the laser light is measured by a photodetector. The detected optical signal is then correlated to the PM mass concentration. PM sensors included in this study can be classified into two groups: one is using the single particle technique (e.g., optical particle counters, OPCs) and the other is based on multiple particle technique (e.g., photometers). For an OPC, the sizes and number of particles are one-by-one characterized by measuring the intensity peak of the light scattered by a single particle and counting the number of particles with the sizes in the pre-defined size bins, respectively. To realize the above operation, particles are focused into a narrow beam, enabling them to individually pass through the OPC’s sensing volume (defined by the aerosol flow and optical arrangement). The light intensity peak of a sensed particle is converted to the particle size (based on a calibration curve, established typically by PSL particles). The above-sensed particle is then placed in one of the pre-defined size bins based on the converted size. After measuring particles for a period, i.e., sampling time), the number concentration of sensed particles in each size bin is calculated from the number of particles counted, sampling flowrate and time. The mass concentration of particles is later derived by assuming particles are in spherical shape and the given density. Unlike a particle beam applied in a typical OPC, the sensor OPC-N2 uses an elliptical mirror and a dual-element photodetector to define a ‘virtual sensing volume’ for characterizing each particle passing through the volume (i.e., not all the particles are passed through the sensing volume). Particles are assumed to be uniform across the cross-section of particle transport channel, where the sensing volume is. In a photometer, particles to be detected could be either focused in a beam or distributed or not. The light intensity scattered by an ensemble of particles intercepting with an illuminating laser light is partially collected, depending on the optical design in a photometer. The collected light intensity is then correlated to the mass concentration of particles by a built-in calibration curve. The calibration curves are obtained by the correlation of scattered light signals to the mass concentration of test particles (measured by reference instruments). Because large particles scatter more light photons than small ones, the collected light signal is typically dominated by larger particles in photometers. In addition to the optical property of particle material, the built-in calibration curves are thus dependent on the size distribution of particles. Significant discrepancy between the readouts of photometer-type PM sensors and actual particle mass concentration is expected if the size distribution and material of sampled particles are very different from those of calibration particles. Algorithms for converting the collected signals to the mass and even number concentrations of particles require the assumptions on the functional forms of size distribution and optical property (i.e., refractive index) of particles. Notice that the readouts of photometers are independent of the sampling flowrates due to the nature of multiple particle characterization. All other PM sensors (except OPC-N2) selected in this study are in the photometer type. Unfortunately, the data conversion algorithms in these PM sensors are claimed as the proprietary information by the vendors.
Table 1. Specification of cost-effective PM sensors chosen in this study.
The schematics of selected PM sensors, illustrating the optical arrangement and particle transport passage inside the sensors, are given in . The solid lines in each layout represent the opening on the sensor’s cover, and the dotted dash lines are the borderlines of the transport passage and space occupied by particles. An injection-molded plastic chamber (in black) is utilized to house the particle transport passages, light source and photodetector, sampling fan and circuit board. No filter is applied before the sampling fan for the simplicity and cost reduction. The basic optical arrangement of a light scattering sensor consists of a light source for illuminating particles and a photodetector for measuring the intensity of photons scattered from single/multiple particles. A laser is utilized as the light source for all the selected PM sensors. The wavelength of the light is ∼650 nm for the sensors of LD12, LD16, SDS018 according to the vendor (not shown in the user manuals), and ∼660 and 658 nm for the sensors of SPS30 and OPC-N2, respectively, from their user manuals. Compared with infrared light-emitting diodes (LED), the wavelength spectrum of lights emitted from laser diodes is narrower. A solid-state photoelectric transducer is applied as the photon intensity detector. The “sensing volume” of a PM sensor is defined by the intersection between the optical path of the illuminating light and the particle stream. The optical arrangement of the light source and photodetector window is either in the 30° or 90° angle for the selected PM sensors. For the selected photometer-type PM sensors, only particles moving in a fraction of the transport passage cross-section are measured because the sensing volumes of sensors are not large enough to cover the entire cross-section of particle transport passage.
Figure 1. Schematic layouts of selected cost-effective PM sensors: (a) LD12, (b) LD16, (c) SDS018, (d) SPS30, and (e) OPC-N2.
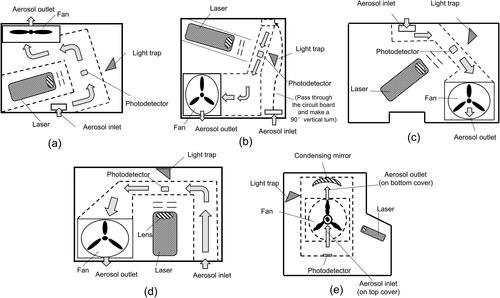
By small fans, the active sampling is utilized to drive the aerosol flow into all the selected PM sensors. In contrast, the passive sampling of particles is accomplished by the gradient temperature field attributed to the electrical heating of a resistor near the sensor’s inlet. Examples of cost-effective PM sensors using passive particle sampling are sensors of Shinyei PPD42NS and Samyoung DSM501A, which are not included in this study. In general, sensors with the active sampling are more responsive to the change of the particle concentration than the ones with the passive sampling. For the sensor of OPC-N2 (), particles enter the sensor via the sampling inlet on the front cover, directly pass through the sensor’s sensing volume (without passing through a winded transport channel), and exit the sensor from the opening on the back cover. For PM sensors of LD12, SDS018 and SPS30 (, and ), particles are required to make a 90° turn once entered the sensors and pass through a winded transport passage prior to reaching the sensors’ sensing volumes. Significant particle loss might occur during the particle transport to the sensing volume of the sensors, particularly for large particles. Much more winded aerosol transport is included in the sensor LD16 (), particles enter the inlet on the back cover of the sensor, pass through the narrow spacing defined by the circuit board and the back cover (without the circuit board protection from the moisture), penetrate through the hole on the circuit board to reach the particle transport passage designed on the other side of the circuit board, and eventually reach the sensor’s sensing volume. The winded aerosol transport design with multiple turns may lead to a significant particle loss, and the circuit board corrosion due to the presence of moisture in the sampled flow may also occur in this sensor once it is used in the ambient for a long time period. For sensors of LD16 and SPS30, the sampling inlet and outlet are located on the same side cover of the sensor. The flow shortcut between the inlet and outlet needs to be avoided when using these sensors.
For the sensors of LD12 and LD16, detected particles are classified into 6 size bins ranging from 0.3–10 µm, and the mass concentration readouts include PM1.0, PM2.5 and PM10. Note that the vendor claims the lower detection limit particle size for these sensors is 0.1 µm while particles less than 0.3 µm in sizes are not counted. The counting efficiencies for particles in the size of 0.1 µm, 0.3 µm and 0.5 µm are 35%, 70%, and 99%, respectively (according to the user manuals). For the sensor of SPS30, 6 size bins ranging from 0.3–10 µm and the mass concentration of PM1.0, PM2.5, PM4 and PM10 are employed. No detection efficiency was reported by the manufacturer. For these sensors of LD12, LD16 and SPS30, it is unclear how the signals are converted into the number and mass concentrations of particles (because it is claimed as the proprietary information by vendors). For the sensor of Nova SDS018, only the mass concentration of PM2.5 and PM10 are reported. The time duration in the high and low signal thresholds is converted to the particle mass concentration by the formula provided by the vendor. For the sensor of OPC-N2, particles pass through the virtual sensing volume individually and the scattered photon intensity of each detected particle is measured and converted to the particle size assuming the particle is spherical, and a default refractive index of 1.5 + i0. Particles are classified into 16 size bins ranging from 0.38 to 17 µm. The number-based size distribution of particles is obtained by measuring particles in each period with the sampling flowrate of 220 ml·min−1. The mass concentration of particles is then derived from the measured number-based size distribution with the default particle density of 1.65 g·cm−3. The mass concentration outputs include PM1, PM 2.5 and PM10. For the PM sensor OPC-N2, Sousan et al. (Citation2016) measured its counting efficiency for PSL particles of 0.5, 0.83, 1.0, 3.0, and 5.0 µm by comparing the sensor readouts with those measured by the reference instrument. It is found the counting efficiency of OPC-N2 is 78% for the 0.5 µm PSL particles and ranging from 83–101% for PSL particles with the sizes larger than 0.8 µm. A DC power supply is used to provide the required voltage for all the sensors, and a STM32 microcontroller is utilized to collect the readouts of all the PM sensors via the serial interface and Universal Serial Bus (USB).
2.2. Experimental setup
shows the schematic diagram of the experimental setup assembled for this study. The setup includes three major components for the particle generator, RH-conditioner and sensor testing chamber. For the generation of hydrophobic particles, a powder disperser (TOPAS, SAG410/U) was employed to airborne the Arizona road dust (ARD; A1 ultrafine dust). A SKC cyclone was applied to remove dust particles with diameters larger than 10 µm. For the generation of hydroscopic particles in the sub-micrometer size range, a custom-made Collison atomizer was used to produce droplets from various solutions. Four solutes, i.e., Sodium Chloride, Glucose, Oxalic Acid, Potassium sulfate, were selected in this study to generate particles in single and binary components. Atomized droplets were directed through a diffusion dryer (with the silica gel as the desiccant) to remove the solvents in droplets. The chemical composition of resultant particles was determined by the mixture percentage of solutes in atomized solutions. An ultrasonic nebulizer (SONAER 241CST) was also used to generate NaCl droplets. Generated droplets were directed into a cylindrical chamber in a large diameter to evaporate the water in droplets by mixing them with dry clean air. The resultant particles were solid NaCl particles with a larger mean particle diameter compared with those generated by the Collision automizer. To generate externally mixed particles, a 2nd Collison atomizer was applied to produce particles in the composition different from ones produced by the 1st Collison atomizer. Two particle streams were then mixed to obtain externally mixed particles for the testing. An air-operated vacuum pump (Air-Vac, TD260MSS) was included at the downstream of the aerosol generation setup to control the flow rate of particle stream entering the RH-conditioner. Prior to the RH conditioner, resultant particles were passed through the Po210 neutralizer to minimize the electrical charges on particles for reducing the electrostatic particle loss during the sampling and transport of particles in selected PM sensors (Forsyth, Liu, and Romay Citation1998).
Figure 2. Schematic diagram of the experimental setup to investigate the effect of relative humidity on the performance of cost-effective PM sensors.
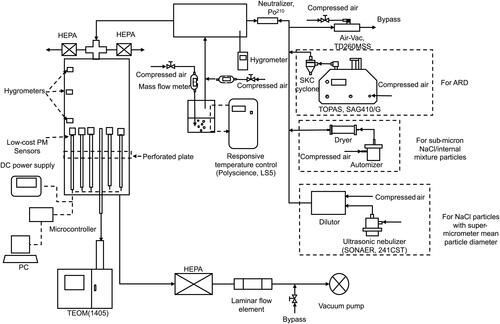
In the RH conditioner (i.e., a cylindrical chamber with a large diameter), the particle stream from the Po210 neutralizer was mixed with a humidified air flow by bubbling the dry air through DI water in the glass bottle and mixing with the dry makeup air (in order to have a desired flow rate of humidified air). Two mass flow meters (TSI 4000) were applied in the lines of humidified and dry air to monitor the flow rates. A close-looped temperature control (Polyscience, LS5) was employed to keep the DI water temperature at the set value. At the set water temperature, the RH in the conditioner could be varied by adjusting the flow rates of both humidified and dry air. A NIST-traceable hygrometer (Fisher Scientific, Traceable) was inserted into the RH conditioner to monitor both the RH and temperature.
A plexiglass chamber with the inner diameter of 30 cm and height of 1.5 m was constructed as the test chamber to house all the selected PM sensors. A 4″ PVC cross was installed at the chamber top to introduce the test particle stream into the chamber. To keep the RH in the test chamber the same as that in the conditioner, the flowrate of particle stream entering the test chamber was set higher than that withdrawn by the downstream pump. Two HEPA filter cartridges were installed at both side openings of the cross to remove particles in the excess flow. Three miniature hygrometers were also installed at the top, middle and bottom sections of the test chamber to monitor the uniformity of the humidity in the chamber. A perforated plate was placed close to the base of the test chamber to ensure the uniformity of the flow profile in the chamber cross-section. Six 316 stainless steel tubes, evenly spaced, were inserted into the test chamber from the base plate and penetrated through the perforated plate to reach the testing section of the chamber. Five cost-effective PM sensors were mounted close to the top ends of five SS tubes (with the top end sealed), and the one located at the center of the perforated plate was used as the sampling probe for the TEOM. A large HEPA filter cartridge and a laminar flow element (Meriam, Z50MC2-2) were placed at the exhaust of the test chamber to remove particles and monitor the flow rate of the exhaust stream, respectively. A make-up airline whose flow rate could be adjusted via a control valve was included in the exhaust line to provide enough flow rate for the downstream vacuum pumps. In this study, the total flow rate in the test chamber was fixed at 150 L·min−1 (LPM), resulted in an average chamber flow velocity of ∼3.5 cm·s−1.
2.3. Testing particles and conditions
To investigate the RH effect on the performance of above selected PM sensors, the inlet openings of all the PM sensors were positioned in the direction perpendicular to the chamber flow. Test particles in different compositions, which were conditioned to various RHs, were produced. The RHs of 20% and 85% were selected in the case with ARD particles (as hydrophobic particles). The RHs of 20%, 50%, 65%, 75% and 85% were chosen in the case with NaCl particles (as hydrophilic particles). The selection of several RH levels in the NaCl particle testing (compared to the two RHs in the ARD testing) is due to the hydroscopic property of test particles.
Sea salt particles are one of the major PM sources in the ambient, particularly in the areas near the coastal lines, and NaCl is the major composition in sea salt particles (Lewis et al. Citation2004). In addition to the sea salt, the dicarboxylic acids (DCAs) represent a significant portion of the organic fraction in ambient particles (Chebbi and Carlier Citation1996; Kawamura and Ikushima Citation1993; Wang et al. Citation2010; Yang and Yu Citation2008). DCAs can be generated by the internal engine combustion, biomass burning, and the oxidation of volatile organic compounds (VOCs) in the photochemical reactions and in-cloud processes. As the most abundant DCAs in atmospheric aerosols, the Oxalic acid, malonic acid, and succinic acid have been frequently detected together with sea salt (Pope et al. Citation2010; Sullivan and Prather Citation2007; Tervahattu et al. Citation2002). To produce surrogates of ambient aerosol, the NaCl and Oxalic Acid (OA) were selected to represent the sea salt and the DCAs, respectively, in this part of the study. Aqueous NaCl and OA solutions in 0.5% (by volume) were prepared and mixed for the generation of internally mixed NaCl + OA particles. Glucose was also selected as another ingredient for ambient particle surrogates because of its hydrophilic property. Internally mixed NaCl + Glucose particles were generated from the mixture of aqueous NaCl and Glucose solutions in 0.5% by volume. The mixture ratio of the NaCl solution to the OA/Glucose solution was kept 1:1 by volume. The RHs of 20%, 65%, and 85% were selected in this part of the testing.
The RH effect on the sensor readouts for internally and externally mixed particles were also investigated. In our study, “internally mixed” particles are defined as particles having binary chemical components, regardless of mixing status in the composition. “Externally mixed” particles are defined as ones formed by mixing two streams of particles in different chemical compositions. Inorganic chemicals of NaCl and K2SO4 were selected in this part of the experiment. The selection of NaCl and K2SO4 was due to their solubility in water and obvious difference in the deliquescence points. To produce internally mixed particles, aqueous solutions of NaCl and K2SO4 (0.5% by volume) were well mixed and filtered. The above solution mixture was then used as the spray solution in a Collison atomizer. To generate externally mixed particles, two Collison atomizers were utilized to separately spray NaCl and K2SO4 solutions in 0.5% by volume and both particle streams were then mixed. The readouts of the PM sensors were collected at the RH of 85% in the cases with internally mixed particles, and at the RH of 20% and 85% in the cases with externally mixed particles.
The effect of the sampling misalignment (relative to the incoming flow) on the readouts of sensors was investigated last. The misalignment angle of the sampling flow in this study was defined as 0° when the sensor’s inlet opening is faced against the incoming flow. The motivation of this part of testing stemmed from the fact that the wind direction in the ambient could be varied from time to time while the sampling inlet of a PM sensor is fixed once installed, which could have its effect on the PM sensors’ readouts. Three misalignment angles for the particle sampling, i.e., 0°, 90° and 180°, were selected. For this part of testing, the RH in the test chamber was kept at 20%, and NaCl particles with different size distributions were utilized. NaCl particles with sub-micrometer mean particle diameter were produced by spraying an aqueous NaCl solution of 0.5% in volume via a custom-made Collison automizer, while an ultrasonic nebulizer (SONAER 241CST) was applied to spray an aqueous NaCl solution of 0.25% in volume to generate NaCl particles with a super-micron mean particle diameter. The size distributions of particles used in this part of study can be found in in the online supplementary information (SI).
3. Result and discussion
3.1. For hydrophobic and hydrophilic particles
ARD (i.e., A1 ultrafine dust) and NaCl particles were selected in this part of the testing to investigate the effect of the RH on the readouts of selected PM sensors. shows the correlation of the readouts of PM sensors to the corresponding TEOM-measured particle mass concentration at RHs of 20% and 85% in the case of ARD particles. As expected, the increase of the RH has negligible effect on the readouts of all the sensors.
Figure 3. Calibration of cost-effective PM sensors for hydrophobic ARD particles at RHs of 20% and 85%.
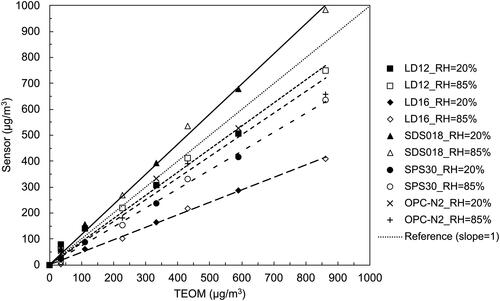
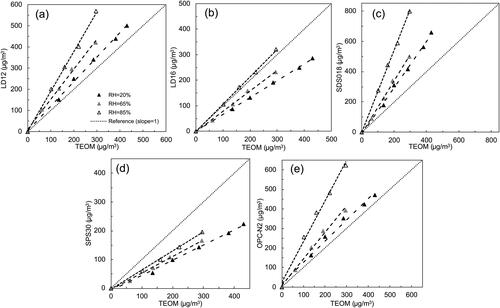
shows the linear correlation for all the sensor challenged by hydrophilic NaCl particles at the RHs of 20%, 50%, 65%, 75%, and 85%. It was found the readouts of all PM sensors were independent on the RH when the RH value was less than 75%. When the RH was increased up to 85%, the slope of the correlation line for each PM sensor increased significantly which means with the same TEOM-measured particle mass concentration, the readouts of all the PM sensors obviously increased. For the NaCl particles, Its DRH is ∼75% (Cruz and Pandis Citation2000; Pope et al. Citation2010; Tang, Munkelwitz, and Davis Citation1977). When the RH is higher than the DRH, NaCl particles absorb enough moisture and abruptly change its phase from the solid to the liquid, resulting in a significant increase in the particle size. Size-enlarged particles led to the increased light scattering and sensor readout.
Figure 4. Calibration of cost-effective PM sensors when challenged by hydrophilic NaCl particles at RHs of 20%, 50%, 65%, 75% and 85%: (a) LD12, (b) LD16, (c) SDS018, (d) SPS30, and (e) OPC-N2.
3.2. For particles in the binary components
The chemical compositions of atmospheric particles are typically composed of a couple or more chemicals. To understand the RH effect on the readout of PM sensors when applied in the field, particles with the inorganic-organic compositions (i.e., NaCl + Glucose; NaCl + OA) in the 1:1 volumetric ratio were generated for this part of testing.
shows the linear correlation for all the PM sensors when tested by NaCl + Glucose particles at the RHs of 20%, 65%, and 85%. It was found the readouts of all the sensors were increased as the RH was increased. However, the DRHs of pure NaCl and anhydrous α-Glucose particles are ∼75% and ∼90%, respectively (Peng, Chow, and Chan Citation2001; Salameh, Mauer, and Taylor Citation2006). DRHs of both particle materials in the pure form are higher than 65%. The data shown in indicates that the DHR of internally mixed particles could be significantly lower than those of particles in pure individual materials. As reported by Salameh, Mauer, and Taylor (Citation2006), a significant low DRH for particles composed of two or more deliquescent materials was observed (compared to those for particles in pure individual materials), and the DRH of internally mixed particles was independent with the mixing ratio of composite materials according to the Gibbs-Duhem Equation. The reduced DRH for internally mixed NaCl + Glucose particles may explain the increased readouts of PM sensors at the RH of 65%. If the RH was continually increased up to 85%, the mass concentration reported by the PM sensors significantly increased due to the continuous deliquescence of NaCl + Glucose particles.
Figure 5. Calibration of cost-effective PM sensors when evaluated by internally mixed NaCl + Glucose particles at RHs of 20%, 65% and 85%: (a) LD12, (b) LD16, (c) SDS018, (d) SPS30, and (e) OPC-N2.
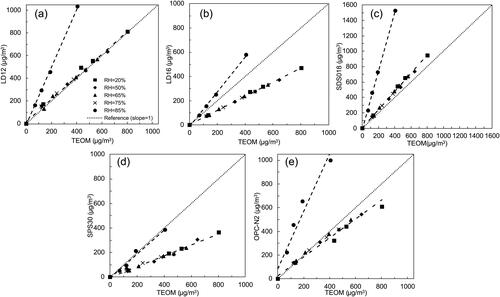
shows the calibration lines for NaCl + OA particles at the RHs of 20%, 65%, and 85%. It was evidenced that the increase of the RH from 20% to 65% had no obvious effect on the readouts of all the PM sensors for NaCl + OA particles. This observation was consistent with what had been reported in the work of Peng et al. (Citation2016). Peng et al. (Citation2016) investigated the hygroscopic behavior of multicomponent aerosols involving NaCl and Dicarboxylic Acids and found that no obvious hygroscopic growth of NaCl + OA particles in the mass ratios of 1:3 and 1:1 was observed when the RH is lower than 75%. The DRH of NaCl + OA particles in the mass ratio of 3:1 was observed ∼73%, slightly less than 75%. For the internally mixed NaCl + OA particles used in this study, since the volumetric ratio of 1:1 led to a mass ratio close to 1:1, no obvious deliquescence was expected to occur at the RH of 65%. At the RH of 85%, the readouts of all the sensors significantly increased due to the water uptake of NaCl + OA particles.
Figure 6. Calibration of cost-effective PM sensors when evaluated by internal mixture of NaCl + OA particles at RHs of 20%, 65% and 85%: (a) LD12, (b) LD16, (c) SDS018, (d) SPS30, and (e) OPC-N2.
For the reference, at the RH higher than 75%, the observed particle growth of NaCl + OA particles was found less than that predicted by the theory (Peng et al. Citation2016). It is found di-sodium oxalate (Na2C2O4), which is less hydroscopic than NaCl and OA, was present in resultant NaCl + OA particles likely due to the HCl evaporation in the dehydrate process of aqueous droplets generated by atomizers (Ma et al. Citation2013; Wu et al. Citation2011). The presence of less hygroscopic Na2C2O4 resulted in the reduced water uptake of resultant NaCl + OA particles when exposed in a high RH environment. It has also been confirmed that the presence of organic compounds in particles could decrease the water uptake of NaCl due to the chemical reaction between inorganic and organic compounds in droplets (Chan and Chan Citation2003).
3.3. For particles of internally and externally mixed NaCl and K2SO4
Particles in the ambient could be either ones in multi-components (i.e., internally mixed), ones mixed with particles in single components (i.e., externally mixed), or combined. The readouts of PM sensors when tested with internally and externally mixed particles under the high RH were studied in this part. As mentioned in Section 2.3, the internally and externally mixed NaCl + K2SO4 particles with the same overall volumetric fractions of NaCl and K2SO4 were generated accordingly, and the RH was set at 85%. For the reference, the readouts of PM sensors for externally mixed particles at the RH of 20% were also collected.
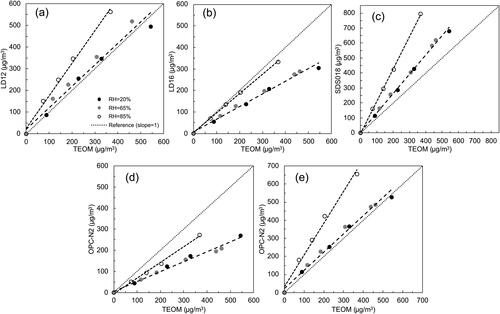
shows the correlation between the readouts of the PM sensors and the corresponding TEOM measurement for both internally and externally mixed NaCl + K2SO4 particles. For externally mixed particles, with the increase of RH from 20% to 85%, the readouts of the PM sensors increased due to the moisture uptake of particles. Because the DRH of pure K2SO4 is ∼96% (Freney, Martin, and Buseck Citation2009), the increase in the readouts is primarily due to the deliquescence of NaCl particles in externally mixed particles. For internally mixed particles, it was found the readouts of PM sensors increased at the RH of 85% (compared to those for externally mixed particles at the RH of 20%) and were even higher than those for externally mixed particles. To explain the above observation, the deliquescence behavior of internally mixed inorganic particles was briefly introduced in the following.
Figure 7. Calibration of cost-effective PM sensors when tested by externally mixed NaCl + K2SO4 particles at RHs of 20% and 85%, and internal mixture of NaCl and K2SO4 particles at the RH of 85%: (a) LD12, (b) LD16, (c) SDS018, (d) SPS30, and (e) OPC-N2.
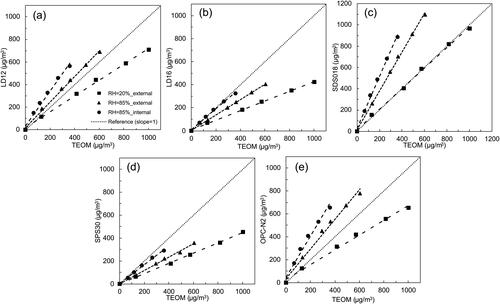
For internally mixed particles, the mutual deliquescence relative humidity (MDRH), i.e., the 1st DRH, triggers the deliquescence of internally mixed particles (Li et al. Citation2014). The MDRH of bi-component inorganic aerosols is independent of their mixing ratio and always lower than the DRH of each component (Wexler and Seinfeld Citation1991). When the RH setting is higher than the MDRH, both the solid phase and saturated aqueous solution co-exist in individual particles. When the RH is continually increased and higher than the 2nd DRH of the mixed particles, only the aqueous solution exists. In our study, the set RH of 85% is between the DRHs of NaCl and K2SO4. NaCl in individual particles was totally dissolved and the phase of K2SO4 could be either in the co-existed solid and aqueous solution (if the RH is lower than the 2nd DRH of NaCl + K2SO4 particles) or in the aqueous solution only (if the RH is higher than the 2nd DRH). The total water uptake is increased under the above two scenarios compared with that for the externally mixed particles in which only the NaCl particles absorb the water moisture significantly. The higher PM sensor readouts (compared with those for externally mixed particles) might be attributed to the higher moisture uptake for internally mixed NaCl + K2SO4 particles.
3.4. On the linear correlation of the sensor readout to the TEOM data
The linear correlation of the sensors’ readouts to the corresponding TEOM-measured mass concentration was investigated in this section. summarizes the correlation slopes of selected PM sensors for various test particles at the RHs of 20% (a) and 85% (b). Note that the readout of a sensor is close to the TEOM mass concentration when the correlation slope is close to 1.0. At the RH of 20%, it was found that the general correlation slope ranking among all the sensors was SDS018 > LD12 ≥ OPC-N2 > LD16 ≥ SPS30 for all the tested hydroscopic particles. The correlation slopes for the sensor SDS018 were the highest among all the sensors and their values were either higher than or close to 1.0 (i.e., its readout is always higher than the actual value). The correlation slopes for the sensor LD12 and OPC-N2 were close to 1.0 except for the internally mixed NaCl + K2SO4 particles (which was 0.73 and 0.68, respectively). For the sensors of LD16 and SPS30, their slopes were much less than 1.0 in all the hydroscopic particle cases. Various factors may contribute to the above experimental observation.
Table 2. The linear correlation of the readouts of cost-effective PM sensors and the corresponding particle mass concentration for various testing particles at RHs of (a) 20% and (b) 85%.
(a)
First, each PM sensor has its own design of a winded passage for transporting sampled particles to the sensing volume, resulting in different particle losses. The loss of particles in the transport passage of each PM sensor in general depends on the passage channel design, sampling flow rate and particle size as well as the electrical charges on particles. Second, the non-uniformity of the particle distribution across the channel cross-section of a PM sensor could be another influencing factor for the sensor’s readout because not all the particles are passed through the sensing volume of the sensor. The counting efficiency of a light scattering device, which is also dependent on the particle size, is also a contributing factor to the change of correlation line slope. Cost-effective PM sensors often use a correction factor to take the consideration of the mass concentration of particles with the sizes less than the lower detection limit, which may contribute to different correlation line slopes observed. The particle co-incidence for PM sensors of the OPC type would be an additional factor resulting in the observed difference in the correlation line slopes. The max. concentration of particles prior to the particle coincidence for a PM sensor depends on the size of its sensing volume. Lastly, the readouts of light-scattering PM sensors are determined by the signal processing and empirical calibration curves included in PM sensors, which are not publicly shared.
For examples, the detection part of the sensor LD16 is like that of the sensor LD12. However, the particle transport channel in the sensor LD16 is much more complex (described in the section 2.1) compared to that in the sensor LD12. It was found the correlation slopes for the sensor of LD16 were much lower than those for the sensor of LD12 for all kinds of particles especially for the super-micron ARD dust under different RHs according to . The significant particle loss in the sensor LD16 may explain this observation. For the sensor of SPS30, the correlation slope for the ARD dust was much higher than those in other cases (i.e., 0.71 for ARD vs. 0.44, 0.50, 0.51, and 0.44 for NaCl, internally mixed NaCl + Glucose, NaCl + OA, and NaCl + K2SO4 particles, respectively). As is shown in , compared with the ARD dust, the NaCl, internally mixed NaCl + Glucose, NaCl + OA and NaCl + K2SO4 particles have a much lower mean particle size. Since the lower detection limit in the particle size is 0.3 µm for the sensor of SPS30, particles with the sizes less than 0.3 µm cannot be detected, which might result in the significantly low readouts.
At the RH of 85%, the correlation slope ranking among all the sensors was SDS018 ≥ OPC-N2 > LD12 > LD16 > SPS30 in the cases with hydroscopic particles. In general, the correlation slopes for all the sensors significantly increased compared with those at the RH of 20%. For the sensor SDS018, the ratio of the correlation slope at the RH of 85% to that at the RH of 20% was in fact higher than those for the other sensors. The above observation indicates that the readout of the sensor SDS018 is significantly affected by the RH. The correlation slope for the sensor OPC-N2 was slightly higher than that for the sensor LD12. The same as what has been observed at the RH of 20%, the correlation slope for the sensors LD16 was higher than that for the sensor SPS30 but their slope values were still the two lowest ones among all the sensors. The linear correlation for the sensors at other RH settings can be found in in the SI.
Notice that the readouts of selected PM sensors at low and high RHs could not be applied to measure the hygroscopic growth of particles. It is supported by the example cases of pure NaCl particles for simplicity. The selection of the above example is also because the hygroscopic growth of NaCl has been well studied. The ratios of the correlation lines slopes at the RH of 85% to those at the RH of 20% by each PM sensor are 2.43, 2.35, 3.17, 2.19, and 3.19 for the sensors LD12, LD16, SDS018, SPS30 and OPC-N2, respectively. However, the mass growth factor of NaCl particles at the RH of 85% based on the theoretical prediction is ∼4.94 (Cruz and Pandis Citation2000). The above example evidences our finding. Various factors may contribute to the observed discrepancy. For examples, the counting efficiency for particles in the sizes close to the lower size detection limit is different for different PM sensors (although their lower size detection limits are all claimed at ∼0.3 µm). The loss of measuring particles in small sizes may result in the above discrepancy, particularly for particles having a significant portion in the small size range. The readouts of ensemble-based PM sensors also depend on the pre-defined calibration curves which are established using standard particles and reference instruments. As the refractive index and density of particles changed due to the hydroscopic growth (Cabada et al. Citation2004), the readouts of PM sensers are likely different from the actual ones. The particle loss in the winded transport channels of PM sensors is another factor contributing to the above discrepancy. The particle loss in the transport channels of PM sensers may be increased as the particle sizes are enlarged after the hydroscopic growth. The non-uniformity of particle distribution in the cross-section, particularly for large particles, may also have its contribution on the sensor-measured mass ratios because only particles in a small portion of the cross-section where the sensing volume is are measured in photometer-typed PM sensors.
Methods have been proposed to correct the readouts of cost-effective PM sensors at a high RH condition for the mass concentration of dry particles. The κ-Khler theory describes the relationship between the particle hygroscopicity and volume by a single hygroscopicity parameter, κ (Petters and Kreidenweis Citation2007). Based on the above theory, Crilley et al. (Citation2018) proposed to correct the readouts of the sensor OPC-N2 at high RHs by the following equation,
(1)
(1)
where m is the original readout of the sensor at a high RH, m0 is the sensor readout for dry particles from the reference instrument. ρw and ρp are the density of water and dry particles, respectively. aw is the water activity which is equal to the ambient RH in decimal form. The hygroscopicity parameter κ can be obtained by the curve fitting between m/m0 and aw. With the κ known, the mass ratio can be calculated, and the corrected sensor readout can be obtained. By applying this method, the difference between the corrected PM2.5 mass concentrations and the reference values were reported within 33% of the reference measurements. Di Antonio et al. (Citation2018) further developed a size distribution-based correction algorithm according to the same theory. They also reported a significant improvement on the accuracy of the readouts for the sensor OPC-N2 under high RHs if a reasonable κ value was defined.
To test the above correlation method proposed by Crilley et al. (Citation2018), we took the case of NaCl particles as example. According to Petters and Kreidenweis (Citation2007), the κ value for NaCl is ∼1.12. With the bulk material density of NaCl is 2.16 g·cm−3, the ratio between the readout of the sensor and the corresponding TEOM data at the RH of 85% were calculated as 4.03. With the above ratio, the slope of the calibration lines for sensors of LD12, LD16, SPS018, SPS30 and OPC-N2 were corrected as 0.62, 0.34, 0.93, 0.24, and 0.67, respectively. From , under a low RH (i.e., RH = 20%), the slopes of the calibration lines for above PM sensors were 1.04, 0.59, 1.20, 0.44, and 0.85, respectively. The previously proposed correction parameter results in significantly underestimation of dry particle mass concentration measured by TEOM for pure NaCl particles, particularly for PM sensors based on multiple particle technique.
In general the hygroscopicity constant κ used to describe the hygroscopicity of particles is highly dependent on the chemical composition of particles (Crilley et al. Citation2020). Due to the complexity of the chemical compositions of ambient aerosols which could be varied by location and time, it is difficult to find a universal κ value applicable for all the cases. Even under the condition that the chemical compositions of particles are well defined, in which the κ value can be reasonably determined, the sensor readouts would have the difficulty to be corrected for the actual hygroscopic growth of particles due to various reasons: for examples, lower counting efficiency, the particle loss in the sensor’s transportation channel, the non-uniformity distribution of particles across the sensing cross-section, and the change of the particle property due to the hygroscopic growth (i.e., refractive index and density) and so on.
For the reference, the empirical correction parameters, κ, for the pure submicron NaCl particles, internally mixed NaCl + Glucose, NaCl + OA, and externally mixed NaCl + K2SO4 particles using the experimental data obtained in this study were given in . The readouts at the RH of 20% were selected as the dry particle mass concentrations measured by the PM sensors. The densities of particles were calculated according to the sprayed solutions. shows the comparation between the slopes of the correlation lines at the RH of 20% and the ones corrected from the data at the 85% RH. It can be found the readouts for each PM sensor due to the hygroscopic growth of particles can be corrected to obtain the dry PM mass concentration.
Table 3. The empirical correction parameters, κ, for the pure submicron NaCl particles, internally mixed NaCl + Glucose, NaCl + OA, and externally mixed NaCl + K2SO4 particles using the experimental data obtained in this study.
Table 4. The comparation of the correlation line slopes of selected PM sensors at 20% RH (measured) and those corrected from the data measured at the RH of 85% (via EquationEquation (1)(1)
(1) ) for the cases with pure submicron NaCl particles, internally mixed NaCl + Glucose, NaCl + OA, and externally mixed NaCl + K2SO4 particles.
It is thus suggested that the readouts of cost-effective PM sensors shall be calibrated using particles where the PM sensors are to be applied (because of the complex chemical composition of ambient particles and simplified design of PM sensors). By assuming the minor seasonal variation of local aerosols in their chemical composition and size distribution, the readouts of cost-effective PM sensors could be corrected using the correction factor founded in local.
3.5. Effect of the sampling misalignment
The effect of the sampling misalignment, i.e., 0°, 90° and 180°, on the sensors’ readouts was evaluated in this part of testing. NaCl particles with mean particle diameters in both sub-micrometers and super-micrometers were generated at the RH of 20%. Notice that the tested particles are all solid at the RH of 20%.
shows the correlation among the readouts of five PM sensors with the mass concentration measured by the TEOM when they were tested by NaCl particles with different mean particle diameters. It was found that the readout of each PM sensor under each selected sampling misalignment setting was linearly correlated with the TEOM-measured particle mass concentration for both particle size distributions. For the sensors of LD12, LD16, SDS018, and SPS30, the sampling orientation had negligible effect on their readouts for particles in each tested size distribution. However, the correlation slopes for particles with super-micrometer mean particle diameter were higher than those for particles with sub-micrometer mean particle diameter which may be explained by the low detection efficiency for the small particles. Since the average flow velocity in the test chamber was 3.5 cm·s−1, the inertia of particles carried by the chamber flow was very low. Thus, the effectiveness of the particle sampling for the PM sensor merely depended on the air flow field around the sensor. The flow field surrounding a PM sensor was affected by the sensor package size and the sampling flow driven by the sensor’s fan in addition to the chamber flow. Since the package sizes of all four PM sensors (except OPC-N2) were very compact (in a rectangular and thin box), the disturbance on the flow surrounding a sensor due to its presence could be neglected.
Figure 8. Effect of the sampling misalignment on the readouts of cost-effective PM sensors. The misalignment angles were set as 0°, 90°, and 180°, and test particles are NaCl particles in both sub-micrometer and super-micrometer size ranges at the RH of 20%: (a) LD12, (b) LD16, (c) SDS018, (d) SPS30, and (e) OPC-N2.
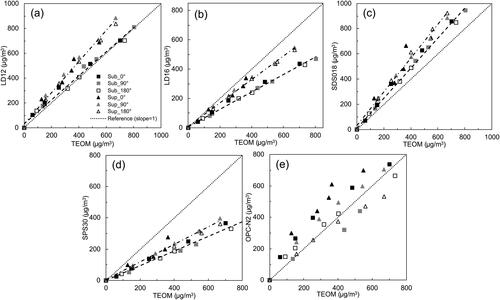
Unlike the above observation, the linear correlations of the OPC-N2 readouts to the corresponding TEOM data were different under different sampling misalignment settings. For the same TEOM mass concentration, the correlated readout for sensor OPC-N2 was higher at the sampling misalignment angle of 0°, and lower at the angle of 180° (compared to that at the setting of 90°). The above observation was more obvious in the case of particles with super-micrometer mean sizes compared to that in the case of particles with sub-micrometer mean sizes. Since the OPC-N2 sensor package size is much larger compared with the sizes of the other PM sensors, the presence of this sensor may significantly block the chamber flow field, resulting in the non-uniform distribution of particles surrounding the sensor. Less large particles would be present in the wake region of the sensor. The correlation slope for the sensor OPC-N2 at the 0° sampling setting is thus higher than that at the 180° sampling setting.
Our finding shows that, when a cost-effective PM sensor is applied in the field, the sensor inlet shall be clear of any flow obstacle. The effect of sampling alignment on the performance of PM sensors and the correction of the sensor readouts shall be taken into the consideration in the field application of some cost-effective PM sensors under the calm air condition, particularly for the applications at the personal level.
4. Conclusion
The RH effect on the performance of five cost-effective PM sensors, i.e., Luftmy LD12, LD16, Sova SDS30, Scensirion SPS30 and Alphasense OPC-N2 were investigated in this study. Test particles including ones in the single component, i.e., ARD and NaCl, and in the binary components (or internally mixed), i.e., NaCl + Glucose, NaCl + OA and NaCl + K2SO4, were generated for this study. In addition, a mixture of NaCl and K2SO4 particles (i.e., externally mixed) was also produced for the comparison purpose. The TEOM, one of the FRMs, was selected as the reference instrument for the measurement of particle mass concentration. The RH was varied between 20% to 85%.
Consistent with what reported in the previous studies, a linear correlation between the sensor readouts and the corresponding TEOM data was found in all the testing cases at a specific RH setting although the slope of the correlation line may not be close to 1.0, i.e., the readouts of tested PM sensors were not the same as those measured by the TEOM. The correlation slopes for each sensor were varied as the RH setting was changed, particularly for particles made of hydroscopic materials.
For hydrophobic particles (i.e., ARD particles), the humidity has negligible effect on the readouts of all the PM sensors (as expected). For the hydrophilic particles in the single component, e.g., NaCl, no significant humidity effect on the PM sensor’s readouts was observed when the RH was less than the DRH of the delinquent material. As the RH setting was higher than DRH of the particle material, the readouts of PM sensors were significantly increased due to the deliquescence of particle materials.
The effect of RH on the sensor readouts is more sophisticated for particles made of multiple delinquent materials. In the cases of particles composed of inorganic and organic materials, the DRH of these composite particles was lower/higher than the DRHs of individual materials. For NaCl + Glucose particles, the DRH of composed particles was lower than those of pure NaCl and glucose materials. The deliquescence of NaCl + Glucose particles would occur at a low humidity, resulting in the increased readouts of all the PM sensors. For NaCl + OA particles, the readouts of PM sensors would increase only at a relatively high RH. It is because the less hygroscopic di-sodium oxalate (Na2C2O4) was possibly formed in resultant particles (due to the chemical reaction between NaCl and OA and the evaporation of the HCl byproduct) and the DRH of resultant particles is not obviously reduced compared with those of NaCl and OAs. In the cases of particles composed of two delinquent materials, e.g., NaCl + K2SO4 particles in this study, the water uptake by the composite particles was more than that by the mixture of particles of individual materials (having the same volumetric percentages as that for composite particles).
The correlation slopes of the PM sensors for different hydroscopic particles were also compared. It was found that various designs in optical arrangement, particle transport passages, signal processing, and different empirical sensor calibration may lead to the different correlation slopes for PM sensors. The ratios of the correlation slopes at high and low RH conditions for selected cost-effective PM sensors were compared to the theoretical factor for the hydroscopic growth of pure NaCl particles. It was found that the ratios of selected PM sensors did not follow the actual hygroscopic growth of particles. The single-parameter method with the previously published hygroscopicity constant for correcting the readouts of cost-effective PM sensors at high RHs was further tested (Crilley et al. Citation2018). It is found that the use of previous correction values significantly underestimated dry mass concentration of particles. Empirical hygroscopicity constants based on our experimental data are thus provided as the reference.
It is thus recommended, for the practical applications, the readouts of cost-effective PM sensors shall be calibrated using field particles under the ambient RH condition in order to get mass concentration readings in good quality (assuming the minor change of field particles in their compositions and the size distribution, and the ambient RH). This study also found that the sampling misalignment may have its effect on some PM sensors. How to properly position the PM sensors to minimize the sampling misalignment effect shall be considered in practice.
Supplemental Material
Download MS Word (113.8 KB)Acknowledgments
Dr. Huanqin Wang thanks the Chinese government-sponsored visiting scholar research program, managed by the Chinese Scholarship Council (CSC), to provide the financial support for visiting Virginia Commonwealth University. Feng Xu would acknowledge the University of Science and Technology of China Excellent Student International Exchange Funding Program to provide the chance visiting Virginia Commonwealth University for this study.
Additional information
Funding
References
- Brook, R. D., B. Franklin, W. Cascio, Y. Hong, G. Howard, M. Lipsett, R. Luepker, M. Mittleman, J. Samet, S. C. Smith, Expert Panel on Population and Prevention Science of the American Heart Association, et al. 2004. Air pollution and cardiovascular disease: A statement for healthcare professionals from the expert panel on population and prevention science of the american heart association. Circulation 109 (21):2655–71. doi:https://doi.org/10.1161/01.CIR.0000128587.30041.C8.
- Cabada, J. C., A. Khlystov, A. E. Wittig, C. Pilinis, and S. N. Pandis. 2004. Light scattering by fine particles during the pittsburgh air quality study: Measurements and modeling. J Geophy Res Atmos 109 (D16). doi:https://doi.org/10.1029/2003JD004155.
- Chan, M. N., and C. K. Chan. 2003. Hygroscopic properties of two model humic-like substances and their mixtures with inorganics of atmospheric importance. Environ. Sci. Technol. 37 (22):5109–15. doi:https://doi.org/10.1021/es034272o.
- Chebbi, A., and P. Carlier. 1996. Carboxylic acids in the troposphere, occurrence, sources, and sinks: A review. Atmos. Environ. 30 (24):4233–49. doi:https://doi.org/10.1016/1352-2310(96)00102-1.
- Crilley, L. R., M. Shaw, R. Pound, L. J. Kramer, R. Price, S. Young, A. C. Lewis, and F. D. Pope. 2018. Evaluation of a low-cost optical particle counter (alphasense opc-n2) for ambient air monitoring. Atmos. Meas. Techn. 11 (2):709–20. doi:https://doi.org/10.5194/amt-11-709-2018.
- Crilley, L. R., A. Singh, L. J. Kramer, M. D. Shaw, M. S. Alam, J. S. Apte, W. J. Bloss, L. Hildebrandt Ruiz, P. Fu, W. Fu, et al. 2020. Effect of aerosol composition on the performance of low-cost optical particle counter correction factors. Atmos. Meas. Techn. 13 (3):1181–93. doi:https://doi.org/10.5194/amt-13-1181-2020.
- Cruz, C. N., and S. N. Pandis. 2000. Deliquescence and hygroscopic growth of mixed inorganic − organic atmospheric aerosol. Env. Sci. Technol. 34 (20):4313–9. doi:https://doi.org/10.1021/es9907109.
- Di Antonio, A.,. O. A. Popoola, B. Ouyang, J. Saffell, and R. L. Jones. 2018. Developing a relative humidity correction for low-cost sensors measuring ambient particulate matter. Sensors 18 (9):2790. doi:https://doi.org/10.3390/s18092790.
- Dockery, D. W., C. A. Pope, X. P. Xu, J. D. Spengler, J. H. Ware, M. E. Fay, B. G. Ferris, and F. E. Speizer. 1993. An association between air pollution and mortality in six U.S. cities. New England J. Med. 329 (24):1753–9. doi:https://doi.org/10.1056/NEJM199312093292401.
- Dominici, F., R. D. Peng, M. L. Bell, L. Pham, A. McDermott, S. L. Zeger, and J. M. Samet. 2006. Fine particulate air pollution and hospital admission for cardiovascular and respiratory diseases. JAMA 295 (10):1127–34. doi:https://doi.org/10.1001/jama.295.10.1127.
- Forsyth, B., B. Y. Liu, and F. J. Romay. 1998. Particle charge distribution measurement for commonly generated laboratory aerosols. Aerosol Sci. Technol. 28 (6):489–501. doi:https://doi.org/10.1080/02786829808965540.
- Freney, E. J., S. T. Martin, and P. R. Buseck. 2009. Deliquescence and efflorescence of potassium salts relevant to biomass-burning aerosol particles. Aerosol Sci. Technol. 43 (8):799–807. doi:https://doi.org/10.1080/02786820902946620.
- Gao, M., J. Cao, and E. Seto. 2015. A distributed network of low-cost continuous reading sensors to measure spatiotemporal variations of PM2.5 in Xi'an, China. Environ. Pollut. 199:56–65. doi:https://doi.org/10.1016/j.envpol.2015.01.013.
- Gent, J. F., P. Koutrakis, K. Belanger, E. Triche, T. R. Holford, M. B. Bracken, and B. P. Leaderer. 2009. Symptoms and medication use in children with asthma and traffic-related sources of fine particle pollution. Environ. Health Perspect. 117 (7):1168–74. doi:https://doi.org/10.1289/ehp.0800335.
- Han, I., E. Symanski, and T. H. Stock. 2017. Feasibility of using low-cost portable particle monitors for measurement of fine and coarse particulate matter in urban ambient air. J. Air Waste Manag. Assoc. 67 (3):330–40. doi:https://doi.org/10.1080/10962247.2016.1241195.
- Hansen, J. E., and M. Sato. 2001. Trends of measured climate forcing agents. Proc. Natl Acad. Sci. USA. 98 (26):14778–83. doi:https://doi.org/10.1073/pnas.261553698.
- Holstius, D. M., A. Pillarisetti, K. Smith, and E. Seto. 2014. Field calibrations of a low-cost aerosol sensor at a regulatory monitoring site in california. Atmos. Meas. Tech. 7 (4):1121–31. doi:https://doi.org/10.5194/amt-7-1121-2014.
- Jacobson, M. Z. 2002. Control of fossil-fuel particulate black carbon and organic matter, possibly the most effective method of slowing global warming. J. Geophy. Res. 107 (D19):ACH 16-1–16-22. doi:https://doi.org/10.1029/2001JD001376.
- Jayaratne, R., X. Liu, P. Thai, M. Dunbabin, and L. Morawska. 2018. The influence of humidity on the performance of a low-cost air particle mass sensor and the effect of atmospheric fog. Atmos. Meas. Tech. 11 (8):4883–90. doi:https://doi.org/10.5194/amt-11-4883-2018.
- Kawamura, K., and K. Ikushima. 1993. Seasonal changes in the distribution of dicarboxylic acids in the urban atmosphere. Environ. Sci. Technol. 27 (10):2227–35. doi:https://doi.org/10.1021/es00047a033.
- Kelly, K.,. J. Whitaker, A. Petty, C. Widmer, A. Dybwad, D. Sleeth, R. Martin, and A. Butterfield. 2017. Ambient and laboratory evaluation of a low-cost particulate matter sensor. Environ. Pollut. 221:491–500. doi:https://doi.org/10.1016/j.envpol.2016.12.039.
- Kim, K.-H., E. Kabir, and S. Kabir. 2015. A review on the human health impact of airborne particulate matter. Environ. Int. 74:136–43. doi:https://doi.org/10.1016/j.envint.2014.10.005.
- Lewis, E. R., E. R. Lewis, R. Lewis, K. E. Karlstrom, and S. E. Schwartz. 2004. Sea salt aerosol production: Mechanisms, methods, measurements, and models. Vol. 152. American Geophysical Union. 152
- Li, X., D. Gupta, H.-J. Eom, H. Kim, and C.-U. Ro. 2014. Deliquescence and efflorescence behavior of individual nacl and kcl mixture aerosol particles. Atmos. Environ. 82:36–43. doi:https://doi.org/10.1016/j.atmosenv.2013.10.011.
- Liu, D., Q. Zhang, J. Jiang, and D.-R. Chen. 2017. Performance calibration of low-cost and portable particular matter (pm) sensors. J. Aerosol Sci. 112:1–10. doi:https://doi.org/10.1016/j.jaerosci.2017.05.011.
- Ma, Q., J. Ma, C. Liu, C. Lai, and H. He. 2013. Laboratory study on the hygroscopic behavior of external and internal C2-C4 dicarboxylic acid-NaCl mixtures. Env. Sci. Technol. 47 (18):10381–8. doi:https://doi.org/10.1021/es4023267.
- Peng, C., A. H. Chow, and C. K. Chan. 2001. Hygroscopic study of glucose, citric acid, and sorbitol using an electrodynamic balance: Comparison with uniface predictions. Aerosol Sci. Technol. 35 (3):753–8. doi:https://doi.org/10.1080/02786820152546798.
- Peng, C., B. Jing, Y.-C. Guo, Y.-H. Zhang, and M.-F. Ge. 2016. Hygroscopic behavior of multicomponent aerosols involving nacl and dicarboxylic acids. J. Phys. Chem. A. 120 (7):1029–38. doi:https://doi.org/10.1021/acs.jpca.5b09373.
- Petters, M., and S. Kreidenweis. 2007. A single parameter representation of hygroscopic growth and cloud condensation nucleus activity. Atmos. Chem. Phys. 7 (8):1961–71. doi:https://doi.org/10.5194/acp-7-1961-2007.
- Pope, C. A., 3rd, R. T. Burnett, G. D. Thurston, M. J. Thun, E. E. Calle, D. Krewski, and J. J. Godleski. 2004. Cardiovascular mortality and long-term exposure to particulate air pollution: Epidemiological evidence of general pathophysiological pathways of disease. Circulation 109 (1):71–7. doi:https://doi.org/10.1161/01.CIR.0000108927.80044.7F.
- Pope, F. D., B. J. Dennis-Smither, P. T. Griffiths, S. L. Clegg, and R. A. Cox. 2010. Studies of single aerosol particles containing malonic acid, glutaric acid, and their mixtures with sodium chloride. I. Hygroscopic growth. J. Phys. Chem. A. 114 (16):5335–41. doi:https://doi.org/10.1021/jp100059k.
- Potter, T. D., and B. R. Colman. 2003. Handbook of weather, climate, and water: Atmospheric chemistry, hydrology, and societal impacts. Hoboken, N.J.: Wiley-Interscience.
- Salameh, A. K., L. J. Mauer, and L. S. Taylor. 2006. Deliquescence lowering in food ingredient mixtures. J. Food Sci. 71 (1):E10–E16. doi:https://doi.org/10.1111/j.1365-2621.2006.tb12392.x.
- Snik, F., J. H. H. Rietjens, A. Apituley, H. Volten, B. Mijling, A. Di Noia, S. Heikamp, R. C. Heinsbroek, O. P. Hasekamp, J. M. Smit, 3187 iSPEX citizen scientists, et al. 2014. Mapping atmospheric aerosols with a citizen science network of smartphone spectropolarimeters. Geophys. Res. Lett. 41 (20):7351–8., doi:https://doi.org/10.1002/2014GL061462.
- Sousan, S.,. K. Koehler, L. Hallett, and T. M. Peters. 2016. Evaluation of the alphasense optical particle counter (opc-n2) and the grimm portable aerosol spectrometer (pas-1.108). Aerosol Sci. Technol. 50 (12):1352–65. doi:https://doi.org/10.1080/02786826.2016.1232859.
- Sullivan, R. C., and K. A. Prather. 2007. Investigations of the diurnal cycle and mixing state of oxalic acid in individual particles in asian aerosol outflow. Environ. Sci. Technol. 41 (23):8062–9. doi:https://doi.org/10.1021/es071134g.
- Tang, I., H. Munkelwitz, and J. Davis. 1977. Aerosol growth studies—ii. Preparation and growth measurements of monodisperse salt aerosols. J. Aerosol Sci. 8 (3):149–59. doi:https://doi.org/10.1016/0021-8502(77)90002-7.
- Tervahattu, H., K. Hartonen, V. M. Kerminen, K. Kupiainen, P. Aarnio, T. Koskentalo, A. F. Tuck, and V. Vaida. 2002. New evidence of an organic layer on marine aerosols. J. Geophy. Res. 107 (D7):AAC 1-1–1-8. doi:https://doi.org/10.1029/2000JD000282.
- UNION, P. 2008. Directive 2008/50/ec of the european parliament and of the council of 21 may 2008 on ambient air quality and cleaner air for europe. Official Journal of the European Union.
- Wang, G., M. Xie, S. Hu, S. Gao, E. Tachibana, and K. Kawamura. 2010. Dicarboxylic acids, metals and isotopic compositions of c and n in atmospheric aerosols from inland china: Implications for dust and coal burning emission and secondary aerosol formation. Atmos. Chem. Phys. 10 (13):6087–96. doi:https://doi.org/10.5194/acp-10-6087-2010.
- Wang, Y., J. Li, H. Jing, Q. Zhang, J. Jiang, and P. Biswas. 2015. Laboratory evaluation and calibration of three low-cost particle sensors for particulate matter measurement. Aerosol Sci. Technol. 49 (11):1063–77. doi:https://doi.org/10.1080/02786826.2015.1100710.
- Wexler, A. S., and J. H. Seinfeld. 1991. Second-generation inorganic aerosol model. Atmo. Environ. A. 25 (12):2731–48. doi:https://doi.org/10.1016/0960-1686(91)90203-J.
- Wu, Z., A. Nowak, L. Poulain, H. Herrmann, and A. Wiedensohler. 2011. Hygroscopic behavior of atmospherically relevant water-soluble carboxylic salts and their influence on the water uptake of ammonium sulfate. Atmos. Chem. Phys. 11 (24):12617–26. doi:https://doi.org/10.5194/acp-11-12617-2011.
- Yang, L., and L. E. Yu. 2008. Measurements of oxalic acid, oxalates, malonic acid, and malonates in atmospheric particulates. Environ. Sci. Technol. 42 (24):9268–75. doi:https://doi.org/10.1021/es801820z.