
 ?Mathematical formulae have been encoded as MathML and are displayed in this HTML version using MathJax in order to improve their display. Uncheck the box to turn MathJax off. This feature requires Javascript. Click on a formula to zoom.
Abstract
To assess the risk of aerosol transmission of SARS-CoV-2, measurements of the airborne viral concentrations in proximity to infected individuals, the persistence of the virus in aerosols, and the dose of the virus needed to cause infection following inhalation are required. For studies aimed at quantifying these parameters, an aerosol sampling device needs to be employed. A number of recent studies have reported the detection of both genetic material and infectious SARS-CoV-2 virus in air samples collected in clinical settings. Previous studies have demonstrated that the efficiency of different samplers for collection and preservation of the infectivity of microorganisms can vary as a function of the specific microorganism. In the present study, the performance of eight common low-flow aerosol sampling devices were compared for their ability to collect and preserve the infectivity of airborne SARS-CoV-2 contained in small particle aerosols. The influence of sampling duration on recovery of infectious virus was also evaluated. Similar concentrations of infectious SARS-CoV-2 were measured in aerosols for the majority of the samplers tested, with the exception of the midget impingers, which measured significantly lower concentrations of SARS-CoV-2. Additionally, in three of the four impingers tested, additional clean airflow through the device following collection of infectious virus resulted in a decrease of the infectious concentration of virus over time, suggesting that virus was being inactivated and these devices may not be suitable for sampling for long durations. Further, RNA copies in the samples over time did not correspond with the losses of infectious SARS-CoV-2 observed in the impingers samples. These data can be utilized to inform interpretation of current studies on the SARS-CoV-2 viral loads in air samples, as well as inform sampling device selection in future studies.
EDITOR:
Introduction
Severe acute respiratory syndrome coronavirus 2 (SARS-CoV-2) causes the disease COVID-19, an acute respiratory disease characterized by fever, dry cough, shortness of breath, and pneumonia (Docherty et al. Citation2020). Aerosol transmission of SARS-CoV-2 is believed to contribute to the spread of COVID-19, although its contribution relative to other routes of exposure remains unknown (Ma et al. Citation2020, Zhang et al. Citation2020, Morawska and Cao Citation2020, Morawska and Milton Citation2020, Domingo, Marquès, and Rovira Citation2020). To assess the risk of aerosol transmission of SARS-CoV-2, understanding of the airborne viral concentrations in proximity to infected individuals, the persistence of the virus in aerosols, and the dose of the virus needed to cause infection following inhalation are essential. In order to quantify these parameters in clinical or laboratory studies, aerosol sampling devices need to be employed. Recent studies using several different types of aerosol sampling devices have reported the presence of SARS-CoV-2 viral genetic material in the air in clinical settings (Guo et al. Citation2020, Liu et al. Citation2020, Santarpia et al. Citation2020, Chia et al. Citation2020). A recent study also reported detection of infectious SARS-CoV-2 in air samples collected near an infected patient in a hospital using a novel condensation collector (Lednicky et al. Citation2020).
Previous studies have demonstrated that the efficiency of different samplers to collect and maintain viability of microorganisms can vary as a function of aerosol particle size and microorganism (Cao et al. Citation2011, Mbareche et al. Citation2018, Haig et al. Citation2016, Verreault, Moineau, and Duchaine Citation2008, Fabian et al. Citation2009). Thus, different sampling devices may give different estimates of the infectious aerosol concentration, potentially biasing the results of a study (Mainelis Citation2020). While numerous studies have employed different aerosol sampling devices to measure airborne SARS-CoV-2, no study exists comparing the performance of these different sampling devices (Rahmani et al. Citation2020). Therefore, the aim of the present study was to compare the performance of eight commercially available low-flow aerosol sampling devices for their ability to collect and preserve the infectivity of SARS-CoV-2 contained in small particle aerosols. These data are needed to inform interpretation of studies in which SARS-CoV-2 in aerosols are measured, as well as inform guidance for sampling device selection in future studies.
Materials and methods
Propagation of virus in cells and quantification
Vero cells (ATCC CCL-81) were grown in complete growth medium (gMEM) consisting of minimum essential medium (Life Technologies) supplemented with 10% v/v heat-inactivated fetal bovine serum (Sigma Aldrich), 2 mM Glutamax (Life Technologies), 0.1 mM nonessential amino acids (Life Technologies), 1 mM sodium pyruvate (Life Technologies), and 1% v/v antibiotic-antimycotic solution (Life Technologies) at 37 °C and under 5% CO2. As previously described, SARS-CoV-2 USA-WA1/2020 was obtained from the Biodefense and Emerging Infections Research Resources Repository (NR-52281; Source: Centers for Disease Control and Prevention). Passage five virus was grown in Vero cells, harvested, clarified by centrifugation, concentrated using tangential flow filtration, and then frozen as 1 mL aliquots until use (Biryukov et al. Citation2020, Ratnesar-Shumate et al. Citation2020, Schuit et al. Citation2020). Thawed virus was diluted 1:10 into simulated saliva (Woo et al. Citation2010, Zuo et al. Citation2014, ASTM Citation2010) resulting in a starting concentration of 5.7 ± 0.1 log10 TCID50/mL for aerosol experiments. Infectious SARS-CoV-2 concentrations in all samples were determined by microtitration assay as previously described and reported as log10 median tissue culture infectious dose (log10 TCID50/mL) (Ratnesar-Shumate et al. Citation2020, Schuit et al. Citation2020, Biryukov et al. Citation2020).
Measurement of SARS-CoV-2 RNA in samples
SARS-CoV-2 RNA was quantified by a reverse-transcription real-time polymerate chain reaction (RT-qPCR) assay using an Applied Biosystems® 7500 Fast real-time PCR instrument and the SuperScript III One-Step RT-PCR MasterMix with Platinum™ Taq DNA Polymerase. The target of the PCR assay is a conserved region of the viral RNA-dependent RNA polymerase (RdRp) gene. The primers and probe were based on primer and probe sequences previously published (Corman et al. Citation2020), but were modified to replace the redundant bases to consensus bases. Viral RNA from test samples was isolated and purified using the Qiagen Viral RNA Mini Kit centrifugation protocol per the manufacturer’s instructions. PCR mastermix was comprised of sterile, molecular biology grade water, 1X SuperScript reaction mix, 1X Superscript reverse transcriptase, 0.2 μM forward and reverse primers, and 0.1 μM FAM-labeled fluorescent probe. Each reaction consisted of 5 μL of RNA and 15 μL of PCR mastermix per well. Each plate also had a seven-point standard curve based on a synthetic DNA positive control representing the target amplicon (gBlocks, Integrated DNA Technologies) of the assay. Cycling conditions were as follows: hold for 50 °C for 30 min, 95 °C for 10 min, and then 40 cycles of 95 °C for 15 s and 60 °C for one minute. Quantification was determined by the number of cycles required to cross a threshold of 0.02 (values reported as Ct). Viral RNA copies/mL present in test samples were interpolated from the average of the seven-point standard curve across all experiments.
Aerosol test system
A schematic of the aerosol test plenum used in the present study is shown in . The plenum consists of four inch diameter stainless steel tri-clamp pipes and fittings. Aerosols were generated into the system using a two-fluid nozzle (#IAZA520041, The Lee Company) operating at 45 psi and 13.6 L/min of air flowing through the nozzle. Viral suspensions were fed to the nozzle at 300 μL/min using a syringe pump. Additional dilution air at 34 L/min was supplied to the plenum from inlet ports located around the nozzle to aid in mixing and equilibration of the generated aerosol. A high efficiency particulate air (HEPA) filter at the top of the plenum minimized excessive pressurization of the test plenum. The aerosol was passed into a sampling region () consisting of a six inch diameter stainless steel pipe with six one inch diameter sampling ports spaced equally around the circumference. Exhaust air flow through the system was maintained at 48 L/min using a combination of the total sampler flow and a vacuum pump controlled by a mass flow controller (Alicat Scientific) downstream from the sampling region (). The additional 0.4 L/min that was not provided by the aerosol generator or dilution air was allowed to passively enter the system through the HEPA filter. Flow-straighteners were installed upstream and downstream of the sampling region to aid in uniformly distributing the aerosol throughout the sampling region.
Figure 1. Aerosol sampler test system. Schematic of the aerosol test plenum used to compare the performance of aerosol samplers for SARS-CoV-2 is shown in (a). Aerosol was generated using a two-fluid nozzle into the top of the plenum, mixed with dilution air, and then passed into a sampling region. Six sampling ports were arranged around the circumference of the sampling region. Eight samplers were connected to the sampling region, as shown in (b) at one of eight of the labeled locations.
Eight commercially available low-flow aerosol samplers were evaluated in the present study (). The samplers tested employ either wet impingement, inertial impaction, or filtration for collecting aerosols. The impingement-based samplers consisted of an all-glass impinger (AGI; #7541-06, Ace-Glass), Biosampler (225-9595, SKC), a glass midget impinger (#225-36-1, SKC) and a perfluoroalkoxy fluorepolymer (PFA) midget impinger (#225-0020, SKC). Two size-selective inertial impaction based samplers were utilized, the Sioutas impactor (#225-370, SKC) and the BC 251 sampler (kindly provided by Dr. William Lindsley, NIOSH). These devices have recently been used for measuring airborne SARS-CoV-2 in clinical settings (Liu et al. Citation2020, Chia et al. Citation2020). The Sioutas impactor was loaded with 25 mm polytetrafluoroethylene (PTFE) filters for the first four stages (#225-3708, SKC) and a 37 mm PTFE filter (#225-1709, SKC) for the last stage. A 37 mm gelatin filter (#224-9552, SKC) was used for the last stage of the BC 251 sampler. Filtration based devices included 25 mm gelatin filters (#225-9551, SKC) and 25 mm PTFE filters (#225-3708, SKC) filters loaded into in-line Delrin filter holders (225-1109, SKC). Sampler flow was controlled using either integrated critical orifices, downstream external critical orifices (O’Keefe Controls), or downstream needles values (McMaster-Carr). For the PFA midget impinger, a ¼” stainless steel tube was used for the sampling neck and was fitted with an internal critical orifice (O’Keefe Controls). Filters (#4433-05-BQ, Parker Balston) were placed in-line after each sampler, before any external critical orifices or needle valves and vacuum. The mass median aerodynamic diameter (MMAD) and geometric standard deviation (GSD) of the aerosol in the sampling region was measured using an Aerodynamic Particle Sizer® Spectrometer (APS, Model 3321, TSI) fitted with a diluter (Model 3302 A, TSI) operating at a 1:20 dilution ratio. Prior to each experiment, the airflow through each sampler was measured using an in-line calibrated flow meter (PN 4146, TSI Inc.). The mean airflow and standard deviation measured across all experiments for each sampler are listed in . Sampling devices were connected to the six sampling ports, as shown in . Due to the number of samplers included in the study, three of the ports were fitted with two samplers. Temperature and relative humidity during experiments were measured using a probe (Vaisala) located upstream of the sampling region ().
Table 1. Summary of aerosol samplers utilized. Values shown are arithmetic mean and standard deviation.
Sampler testing
For each test, the suspension containing SARS-CoV-2 in simulated saliva was aerosolized into the plenum by turning on the air and liquid feed to the generator. Aerosol generation was initiated one minute before initiation of sampling to allow the aerosol to reach a steady state concentration in the sampling region. Samplers collected aerosol continuously for three minutes, after which time aerosol generation and sampling were stopped. In a separate set of experiments, sampling continued for either 10 or 30 min after the termination of aerosol generation, for total sampling times of 13 and 33 min, respectively, in order to assess the ability of the different sampling devices to preserve the infectivity of collected virus over longer sampling times.
The volumes of fluid used in each type of impinger sampler or for recovery of collected aerosol from dry samplers are summarized in . Impingers were pre-loaded with complete gMEM without 10% heat-inactivated fetal bovine serum to avoid foaming during sampling. To account for evaporation of the liquid in the impingers during sampling, the mass of each sampler was recorded before and after sampling to estimate the volume of liquid lost during sampling and determine the final volumes remaining in each sampler. After recovery, heat-inactivated fetal bovine serum was spiked into the sampling medium of the impingers to achieve a final concentration of 10% v/v prior to assay. Material collected in the remaining samplers was recovered using 10 mL of gMEM with 10% heat-inactivated fetal bovine serum, with the exception of the first and second stage of the BC 251 sampler, which were recovered in 5 and 1 mL respectively.
Sampling of the aerosol from test system through the individual ports and to the samplers was not designed to be isokinetic nor isoaxial (Hinds Citation1999). In order to account for any potential sampling bias due to the misalignment in the sampling region or transmission of aerosol to the samplers, physical characterization of the test system using a fluorescent tracer was performed. To evaluate the physical efficiency of the samplers when drawing aerosol from the test system, ammonium fluorescein (#F3651, Millipore-Sigma) dissolved in simulated saliva at a final concentration of 38.0 ± 1.1 mg/mL, was used as a fluorescent tracer in a separate set of tests (Stober Citation1973). Heat-inactivated fetal bovine serum was added to achieve a final concentration of 7.5% v/v in the ammonium fluorescein saliva solution, such that the resulting final MMAD of the ammonium fluorescein in simulated saliva aerosols would match those measured for aerosols generated from virus spiked into the simulated saliva. Concentrations of ammonium fluorescein in samples were determined using a GloMax-Multi Jr Single-Tube Multimode Reader equipped with a blue fluorescence kit (Promega). Tests with ammonium fluorescein were conducted identically to those performed with the viral suspension.
Additionally, a set of tests was conducted in which the samplers were all replaced with 25 mm gelatin filters, flowing at the same airflow rate as the sampler they replaced, to assess the uniformity of the concentration at each sampling location. The use of gelatin filters at all sampling locations normalizes for differences in collection and recovery efficiencies that potentially exist between the different samplers, allowing uniformity of concentration between the different sampling locations to be assessed. These tests were performed identically to those with the viral suspension.
Data analysis
The aerosol concentrations of ammonium fluorescein measured by each sampler (Ca) were calculated as the ratio of the product of the concentration of ammonium fluorescein present in the sampling medium (Cs) and the volume of the sampling medium (Vs) to the product of the sampler flow rate (Qs), and the sampling duration (t; EquationEquation (1)(1)
(1) ). The theoretical maximum concentration of ammonium fluorescein in the test system (Ca,max) was calculated as the product of the concentration of ammonium fluorescein present in the syringe feeding the nozzle (Csyr) and the syringe feed rate of ammonium fluorescein during aerosol generation (Qsyr) to the total air flow in the test system (Qsys; EquationEquation (1)
(1)
(1) ). The ratio of Ca to Ca,max represents the fraction of aerosolized material detected by a given sampler, referred to hereafter at the system efficiency (EquationEquation (1)
(1)
(1) ). In tests with ammonium fluorescein, decreases in the system efficiency are due to physical losses of the aerosolized tracer within the system during aerosol generation, transport, or sampling. Two different system efficiencies were calculated. The first was the system efficiency for each sampling location when gelatin filters were present at each location to normalize for differences in collection and recovery efficiencies that potentially exist between the different samplers (ηs,f). These estimates allow uniformity of the aerosol concentration between ports to be assessed. The second was the system efficiency for each sampling location with the different samplers present (ηs,s). These estimates, when normalized for any non-uniformity of the aerosol concentration in the system, allow the physical collection efficiency of the different samplers to be compared.
(1)
(1)
To compare the relative performance of each sampler type for maintaining the infectivity of SARS-CoV-2 in aerosols during sampling, the measured concentration of infectious virus for each sampler was adjusted using the system efficiencies measured with ammonium fluorescein to account for difference in the physical sampling efficiency of the individual samplers (ηs,s), as well as small differences in the uniformity of the aerosol concentration within the sampling region (ηs,f), as shown in EquationEquation (2)(2)
(2) .
(2)
(2)
All statistical analysis was performed in GraphPad Prism (v 6.03, GraphPad Software, LLC). All values are presented as arithmetic mean ± standard deviation unless otherwise noted.
Results
For SARS-CoV-2 in simulated saliva aerosols, the MMAD, GSD, and mode diameter were 1.54 ± 0.03 μm, 1.53 ± 0.00, and 1.61 ± 0.22 μm respectively. The MMAD, GSD, and mode diameter of the ammonium fluorescein in simulated saliva with 7.5% fetal bovine serum aerosols were 1.52 ± 0.04 μm, 1.51 ± 0.01, and 1.57 ± 0.17 μm respectively. The mean temperatures in the test plenum for the three, 13, and 33 min tests were 23.1 ± 0.5, 23.0 ± 0.6, and 22.3 ± 0.5 °C, respectively. The mean relative humidity levels in the test plenum for the three, 13, and 33-minute tests were 34.2 ± 4.0, 34.7 ± 3.0, and 33.9 ± 1.3%, respectively.
Physical system efficiencies
lists the mean system efficiencies (ηs,f) measured with a gelatin filter located at each sampling location to assess ammonium fluorescein concentration uniformity within the sampling region, as well as when the different samplers were present at each sampling location (ηs,s). The aerosol concentrations of ammonium fluorescein measured at each location with gelatin filters present were compared using one-way analysis of variance (ANOVA) Tukey’s multiple comparison post-test (α = 0.05) and were not statistically different across the sampler locations, except for the PTFE filter location (, location seven), in which the concentrations were slightly, but significantly lower when compared to the other sampling locations (P < 0.004). When the different samplers were present at each location, no significant differences were observed between the ammonium fluorescein concentration measured by the majority of the different samplers with the exception of the glass midget impinger (, location three), which measured significantly lower concentrations of ammonium fluorescein than all of the other samplers (P < 0.0001) and the PFA midget impinger, which was lower than the Biosampler (P = 0.008) when compared using one-way ANOVA with a Tukey’s multiple comparison post-test.
Table 2. Summary of aerosol sampler physical efficiencies.
Measurement of SARS-CoV-2 aerosol concentrations
shows the concentrations of SARS-CoV-2 measured by each sampler as well as the concentrations adjusted for physical losses. The mean and standard deviation of the theoretical maximum concentration of infectious virus titers in the aerosol was 3.5 ± 0.1 log10 TCID50/L-Air, and is indicated by the dashed line in the figure. Measured adjusted concentrations of SARS-CoV-2 were compared using one-way ANOVA with a Tukey’s multiple comparison post-test. The concentrations of infectious SARS-CoV-2 during the three minute of sampling duration measured with the glass midget impinger was significantly lower than all of the other samplers (P < 0.01). The concentration of infectious SARS-CoV-2 measured by the Biosampler was significantly greater than those measured by the glass midget impinger (P < 0.0001) and the PFA midget impinger (P = 0.005). The concentration of infectious SARS-CoV-2 measured by the PTFE filter was higher than those measured by the PFA midget impinger (P = 0.03). The theoretical maximum concentration in the sampling region of the test system for each experiment was determined based on the syringe concentration, syringe feed rate, and dilution air flow of the test system. The concentrations measured for each sampler in during the first three min of sampling were compared to the theoretical maximum concentrations of infectious virus using an ordinary one-way ANOVA (α = 0.05) across all experiments. Both the Biosampler and the PTFE filter were not statistically different than the theoretical maximum, indicating that in the absence of physical losses, these two samplers were the most efficient for measuring the amount of infectious virus in the aerosols during experiments.
Figure 2. Aerosol concentrations of SARS-CoV-2 measured with each sampler during three minutes of sampling. (a) Concentrations of SARS-CoV-2 and (b) adjusted concentrations of SARS-CoV-2 when accounting for physical losses. Recovered concentrations in the glass midget impinger were significantly lower (depicted with *) than all of the other samplers, and concentrations in the PFA midget impinger were lower (depicted with ǂ) than both the Biosampler and the PTFE filter (one-way ANOVA, Tukey’s multiple comparison test, α = 0.05). The concentrations measured with the Biosampler and PTFE filter were not statistically different than the theoretical maximum (dotted line) based on the concentration of the aerosolized material, liquid feed rate, and air flow rate in the system assuming no physical losses (ordinary one-way ANOVA α = 0.05).
To evaluate the effect of longer sampling durations on the infectivity of collected SARS-CoV-2 virus, experiments were performed in which each sampler was allowed to collect aerosol for three minutes and then continued to sample clean air for an additional 10 or 30 min. The measured concentrations for each sampling duration are shown in . The concentration of infectious virus measured by the impingement based collectors, with the exception of the Biosampler, decreased significantly over time when compared using two-way ANOVA with sampler and sampling duration as factors and a Tukey multiple comparison post-test. Both the type of sampler (P < 0.0001) and sampling duration (P < 0.0001) were significant factors affecting the measured concentrations of SARS-CoV-2 in the aerosol samples. Conversely, none of the non-impingement samplers showed a significant decrease in the measured concentrations of infectious SARS-CoV-2 aerosols over time.
Figure 3. Aerosol concentrations of infectious SARS-CoV-2 measured with each sampler after three, 13, and 33 min of sampling. All of the impingers, except for the Biosampler, demonstrated statistically significant losses of infectious virus over 33 min of sampling (depicted with *) and the PFA midget impinger had significant losses during 13 min of sampling (depicted with ⊥) and between the 13 and 33 min sampling duration (depicted with #) (two-way ANOVA, Tukey’s multiple comparison post-test α = 0.05). No significant losses were measured in any of the dry samplers over the 13 and 33-minute sampling durations.
RT-PCR was performed on samples from the three and 33-minute sampling times with SARS-CoV-2 aerosols. The concentrations of the nucleic acid measured using each sampler were compared using a two-way ANOVA with sampler and sampling time as factors and a Tukey’s multiple comparisons post-test (). Similar to the infectious virus concentrations, SARS-CoV-2 RNA copies/L-air were dependent on the sampler type (P < 0.0001) and the sampling duration (P = 0.0098). However, unlike the infectious virus titers, no significant difference in the concentrations of RNA copies/L-air were measured for an individual sampler as a function of sampling time. For example, the concentrations measured with the Biosampler at 33 min were different than both the glass midget impinger at three (P < 0.001) and 33 (P = 0.0007) minutes, however, the concentrations measured in the glass midget impinger between three and 33 min (P > 0.9999) and or the Biosampler between three and 33 min (P = 0.9979) were not significant. The influence of sampling duration on measured RNA concentrations was only due to inter-sampler differences.
Figure 4. Aerosol concentrations of SARS-CoV-2 RNA/L-air measured with each sampler for three and 33 min of sampling. Concentrations were compared using two-way ANOVA, Tukey’s multiple comparison post-test α = 0.05. No statistically significant loss in RNA was measured between the 3 and 33 min sampling durations in any of the samplers.
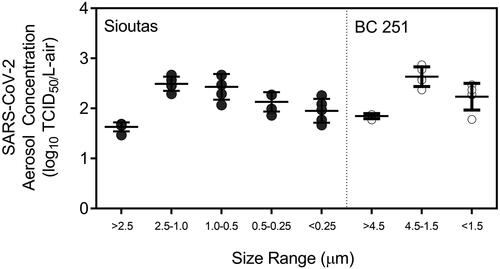
The concentrations SARS-CoV-2 measured in the different size ranges of the two size-selective samplers, the Sioutas impactor and the BC 251 sampler, are shown in . The highest concentrations of infectious SARS-CoV-2 in the Sioutas impactor were measured on the stage that collected aerosols particles ranging from 2.5-1.0 μm size range and in the BC 251 sampler in the 4.5-1.5 μm size range, which is in agreement with the mode of the mass particle size distribution of ∼1.6 μm recorded by the APS across all of the experiments.
Figure 5. Aerosol concentrations of infectious SARS-CoV-2 measured in each size range (stage) of the Sioutas impactor and BC 251 sampler. The highest concentrations in the Sioutas impactor and BC 251 sampler were measured on the stages in the size ranges that were similar to the MMAD measured by the APS during experiments.
Discussion and conclusion
To interpret results of studies in which concentrations of airborne SARS-CoV-2 are being measured, an understanding of the efficiency of different aerosol sampling devices for collecting and maintaining the integrity of the virus is needed. Inaccurate measurements of SARS-CoV-2 aerosol concentrations due to inefficient sampling have the potential to bias interpretation of study results, including underestimation of the amount of virus expelled from or near infected individuals, or the infectious dose via inhalation in animal models of disease. The present study assessed the performance of eight common low-flow personal aerosol sampling devices for collecting and preserving the infectivity of SARS-CoV-2 contained in small particle aerosols, to inform both laboratory studies and field sampling efforts.
The size distribution mode of the aerosol particles containing SARS-CoV-2 utilized in the present study was approximately 1.6 μm and mimics those observed to be emitted by humans during breathing, singing and speaking (Gregson et al. Citation2021, Johnson et al. Citation2011) and falls within the range of sizes in which SARS-COV-2 RNA has been previously detected in aerosol samples taken from clinical settings (Chia et al. Citation2020, Liu et al. Citation2020).
The majority of the sampling devices measured similar concentrations of infectious virus, with the exception of the glass midget impinger, which measured significantly lower concentrations than all of the other samplers, and the PFA midget impinger, which measured significantly lower concentrations than the Biosampler and PTFE filter. A portion of the difference observed with the midget impingers is due to low physical efficiency, assessed by comparing concentrations of aerosolized fluorescein measured relative to other samplers. However, after accounting for physical losses due to the sampler and test system, the midget impinger still detected lower concentrations than all of the other samplers, and the PFA midget still measured significantly lower concentrations than the Biosampler and PTFE filter, suggesting that these samplers were less efficient at preserving the infectivity of the collected virus. The Biosampler, PTFE filters, Sioutas impactor, gelatin filters, and BC 251 sampler all measured similar concentration of infectious SARS-CoV-2 in aerosols, and were able to maintain the infectivity of the virus over the course of a 33-minute sampling duration. Conversely, the all-glass impinger and two midget impingers, demonstrated significant losses in infectious virus over the course of both 13 and 33-minute sampling duration, suggesting that these samplers may not be suitable for accurately sampling infectious airborne SARS-CoV-2 over extended sampling durations. Further, it was noted that the concentration of RNA copies of SARS-CoV-2 did not decrease in any of the samplers over the course of 33 min of sampling, indicating that inactivation of the virus was occurring in the impinger samplers and that virus was not being lost to surfaces within the samplers or re-aerosolized. This result also suggests that RNA copies may not correlate with infectious virus concentration in air samples.
The performance of the Biosampler in contrast to the impingers has been reported previously. The Biosampler was designed to be a more gentle device for impinging microorganisms into liquid because traditional impingers have been associated with inactivation and reaerosolization of microorganisms during sampling (Mainelis Citation2020, Lin et al. Citation2000).
The differences in the amount of infectious SARS-CoV-2 measured with the various samplers could potentially create discrepancies when interpreting data from recent studies in which concentrations of airborne SARS-CoV-2 are being quantified. For example, in a study comparing the aerosolization efficiency of different coronaviruses, including SARS-CoV-2 (Fears et al. Citation2020), both Biosamplers and an all-glass impingers were used for sampling the viruses over the course of 10 to 30 min across four different laboratories. It is unclear from this study in which laboratories or for which data sets either sampler was used, but given the results of the present study, which demonstrate that the all-glass impinger can inactivate virus over longer sampling times, the use of different samplers may have potentially introduced significant variability into the study.
In another study performed during the early phase of the COVID-19 pandemic, midget impingers were used to sample the air in patient rooms in a hospital in Iran, and no SARS-CoV-2 virus was detected by PCR. The authors speculated that the absence of SARS-CoV-2 RNA in the samples was indicative that the virus may not be transmissible via the airborne route. However, given the low sampling air flow rate used, 1.5 Lpm, and the lower physical sampling efficiency of the midget impingers, it is possible that virus may have been present below the limit of detection for that combination of sampler type and assay (Faridi et al. Citation2020).
Midget impingers were also used to assess the persistence of SARS-CoV-2 at different relative humidities and in different matrices (Smither et al. Citation2020) over time. In this type of study, while the measured concentration of SARS-CoV-2 may have been lower in samples due to physical inefficiency or sampling stresses associated with the midget impinger, the analysis is based on the relative concentration measured in a time-series of samples collected using the same type of sampler, and, therefore, the estimated decay rates and resulting conclusions may not be influenced by type of sampler employed. Results similar to those obtained by Smither et al. (Citation2020) were reported in two similar studies examining SARS-CoV-2 persistence in aerosols, only utilizing gelatin filters rather than midget impingers (van Doremalen et al. Citation2020, Schuit et al. 2019). While these studies suggest that the type of sampler employed may not influence the results of studies examining the persistence of infectious virus in aerosols, no study to date has directly compared decay rates measured with different types of samplers. It is possible that the stresses associated with sampling may compound damage to the virus due to the environmental conditions in the chamber. Thus, the use of samplers with different sampling stresses may potentially result in differing estimates of the persistence of infectious virus. Future studies should attempt to quantify this phenomenon.
All-Glass impingers are commonly employed in infectivity studies in animal models. In an inhalation study using an African green monkey model of COVID-19, the authors noted that inhaled doses were about 4 log10 PFU and that approximately 2 log10 were lost due to nebulization. However, it is not possible to discern whether those losses were due to damage due to nebulization, physical inefficiencies, dilution in the system, or, given the lower biological sampling efficiency of the all-glass impinger over longer sampling periods, due to sampling stresses (Hartman et al. Citation2020). If the latter were the case, it is possible the inhaled doses received by the animals may have been higher than were reported.
Several studies have attempted to measure the presence of SARS-CoV-2 in aerosols in clinical settings. Using the Sioutas impactor, SARS-CoV-2 RNA has been measured in both the fine and course mode aerosols depending on the location of the sampling (Liu et al. Citation2020). However, in this study the authors did not attempt to measure infectious virus aerosols. In a separate study, gelatin filters were used on the last stage of the BC 251, and infectious SARS-CoV-2 aerosols were detected in the <1.5 μm size range, and RNA was detected in all three size ranges, >4.5, 4.5-1.5, and <1.5 μm (Santarpia et al. Citation2020). In the present study, no losses in infectious SARS-CoV-2 was detected over 33 min of sampling with either the Sioutas or BC 251 impactor, and the initial concentration of virus were comparable to all the other samplers, indicating that other size-selective sampling devices that use dry-impaction, perhaps at higher flow rates to increase the probably of detection, may be appropriate for sampling infectious SARS-CoV-2.
There are several limitations to the application of the data in the present study. Only one size of the SARS-CoV-2 aerosols were utilized for experiments, and physical sampling efficiencies for a given sampler will shift with size (Mainelis Citation2020, Pan, Lednicky, and Wu Citation2019). RNA from SARS-CoV-2 aerosols were noted to be present in a range of particle sizes (Guo et al. Citation2020, Santarpia et al. Citation2020) in clinical settings and aerosol generated from different respiratory modalities such as breathing, talking, and coughing from healthy individuals and those infected with other respiratory diseases results in aerosols particles in a range of sizes (Lindsley et al. Citation2012, Milton et al. Citation2013, Leung et al. Citation2020, Johnson et al. Citation2011). Additional work should be done to characterize the performance of the samplers evaluated in the present study, as well as additional samplers, for collecting and maintaining the infectivity of SARS-CoV-2 in different sized aerosol particles. Additionally, the duration of the sampling used in this study was limited to 33 min. Physical sampling efficiencies for impingers are known to decrease with long durations due to reaerosolization (Lin et al. Citation1997) and desiccation of the collected microorganisms on dry substrates and filters is a concern (Mainelis Citation2020, Fabian et al. Citation2009, Verreault, Moineau, and Duchaine Citation2008). Longer sampling durations should be evaluated to determine if there a maximum sampling time after which the performance of the Biosampler and dry samplers decreases.
The composition of the aerosol in which the virus is suspended may influence the stability of the virus in aerosols or when collected (Kormuth et al. Citation2018, Zuo et al. Citation2014, Pan, Lednicky, and Wu Citation2019). In the present study, SARS-CoV-2 was suspended in simulated saliva; however, it is likely that fluids from other regions of the respiratory tract are also relevant to transmission of respiratory viruses like SARS-CoV-2. It is possible that virus suspended in a different suspending medium may have yielded different results. Therefore, additional testing should be performed to assess the influence of the suspending fluid on the ability of samplers to preserve the infectivity of SARS-CoV-2.
Lastly, it was not possible to evaluate every sampler available for collecting airborne viruses. Novel condensation-based aerosol sampling devices have been employed in recent studies to sample for SARS-CoV-2 in clinical settings (Zhou et al. Citation2020, Lednicky et al. Citation2020). Many other devices are available commercially, such as wetted wall cyclones, dry cyclones, large gelatin filters, and electret filters, and may have utility for sampling in clinical or field settings due to their higher flow rate and greater ability to concentrate collected samples, potentially increasing the probability of detection and accurate quantification of SARS-CoV-2. However, testing similar to that performed in this study should be performed prior to use in a non-laboratory setting to assess the physical collection efficiency of these samplers and their ability to preserve viral infectivity for SARS-CoV-2 aerosols.
Acknowledgment
The authors would like to thank Dr. Victoria Wahl for her assistance with obtaining the virus isolates used in this study and Dr. Michael Hevey for his leadership of the National Biological Threat Characterization Center’s COVID-19 response.
Disclosure statement
No potential competing interests were reported by the author(s).
Additional information
Funding
References
- ASTM E2721-10. 2010. Standard Test Method for Evaluation of Effectiveness of Decontamination Procedures for Surfaces When Challenged with Droplets Containing Human Pathogenic Viruses, ASTM International, West Conshohocken, PA. www.astm.org
- Biryukov, J., J. A. Boydston, R. A. Dunning, J. J. Yeager, S. Wood, A. L. Reese, A. Ferris, D. Miller, W. Weaver, N. E. Zeitouni, et al. 2020. Increasing temperature and relative humidity accelerates inactivation of SARS-CoV-2 on surfaces. mSphere 5 (4):1–9. doi:https://doi.org/10.1128/mSphere.00441-20.
- Cao, G., J. D. Noti, F. M. Blachere, W. G. Lindsley, and D. H. Beezhold. 2011. Development of an improved methodology to detect infectious airborne influenza virus using the NIOSH bioaerosol sampler. J. Environ. Monit. 13 (12):3321–8. doi:https://doi.org/10.1039/c1em10607d.
- Chia, P. Y., K. K. Coleman, Y. K. Tan, S. W. X. Ong, M. Gum, S. K. Lau, X. F. Lim, A. S. Lim, S. Sutjipto, P. H. Lee, for the Singapore 2019 Novel Coronavirus Outbreak Research Team, et al. 2020. Detection of air and surface contamination by SARS-CoV-2 in hospital rooms of infected patients. Nat. Commun. 11 (1):1–7. doi:https://doi.org/10.1038/s41467-020-16670-2.
- Corman, V. M., O. Landt, M. Kaiser, R. Molenkamp, A. Meijer, D. K. Chu, T. Bleicker, S. Brunink, J. Schneider, M. L. Schmidt, et al. 2020. Detection of 2019 novel coronavirus (2019-nCoV) by real-time RT-PCR. Eurosurveillance 25 (3):2000045. doi:https://doi.org/10.2807/1560-7917.ES.2020.25.3.2000045.
- Docherty, A. B., E. M. Harrison, C. A. Green, H. E. Hardwick, R. Pius, L. Norman, K. A. Holden, J. M. Read, F. Dondelinger, G. Carson, ISARIC4C investigators, et al. 2020. Features of 20 133 UK patients in hospital with covid-19 using the ISARIC WHO Clinical Characterisation Protocol: Prospective observational cohort study. BMJ 369:m1985. doi:https://doi.org/10.1136/bmj.m1985.
- Domingo, J. L., M. Marquès, and J. Rovira. 2020. Influence of airborne transmission of SARS-CoV-2 on COVID-19 pandemic. A review. Environ. Res. 188:109861. doi:https://doi.org/10.1016/j.envres.2020.109861.
- Fabian, P., J. J. McDevitt, E. A. Houseman, and D. K. Milton. 2009. Airborne influenza virus detection with four aerosol samplers using molecular and infectivity assays: Considerations for a new infectious virus aerosol sampler. Indoor Air. 19 (5):433–41. doi:https://doi.org/10.1111/j.1600-0668.2009.00609.x.
- Faridi, S., S. Niazi, K. Sadeghi, K. Naddafi, J. Yavarian, M. Shamsipour, N. Z. S. Jandaghi, et al. 2020. A field indoor air measurement of SARS-CoV-2 in the patient rooms of the largest hospital in Iran. Sci. Total Environ. 725:138401.
- Fears, A. C., W. B. Klimstra, P. Duprex, A. Hartman, S. C. Weaver, K. C. Plante, D. Mirchandani, et al. 2020. Comparative dynamic aerosol efficiencies of three emergent coronaviruses and the unusual persistence of SARS-CoV-2 in aerosol suspensions. medRxiv.
- Gregson, F. K., N. A. Watson, C. M. Orton, A. E. Haddrell, L. P. McCarthy, T. J. Finnie, N. Gent, G. C. Donaldson, P. L. Shah, and J. D. Calder. 2021. Comparing aerosol concentrations and particle size distributions generated by singing, speaking and breathing. Aerosol Sci. Technol. :1–15.
- Guo, Z. D., Z. Y. Wang, S. F. Zhang, X. Li, L. Li, C. Li, Y. Cui, R. B. Fu, Y. Z. Dong, X. Y. Chi, et al. 2020. Aerosol and surface distribution of severe acute respiratory syndrome coronavirus 2 in hospital wards. Wuhan, China, 2020." Emerg. Infect. Dis. 26 (7):1583–1591. doi:https://doi.org/10.3201/eid2607.200885.
- Haig, C. W., W. G. Mackay, J. T. Walker, and C. Williams. 2016. Bioaerosol sampling: Sampling mechanisms, bioefficiency and field studies. J. Hosp. Infect. 93 (3):242–55. doi:https://doi.org/10.1016/j.jhin.2016.03.017.
- Hartman, A. L., S. Nambulli, C. M. McMillen, A. G. White, N. L. Tilston-Lunel, J. R. Albe, E. Cottle, et al. 2020. SARS-CoV-2 infection of African green monkeys results in mild respiratory disease discernible by PET/CT imaging and shedding of infectious virus from both respiratory and gastrointestinal tracts. PLoS Pathogens 16 (9):e1008903.
- Hinds, W. C. 1999. Aerosol Science and Technology. Hoboken, NJ: John Wiley & Sons, Inc.
- Johnson, G. R., L. Morawska, Z. D. Ristovski, M. Hargreaves, K. Mengersen, C. Y. H. Chao, M. P. Wan, Y. Li, X. Xie, D. Katoshevski, et al. 2011. Modality of human expired aerosol size distributions. J. Aerosol Sci. 42 (12):839–51. doi:https://doi.org/10.1016/j.jaerosci.2011.07.009.
- Kormuth, K. A., K. Lin, A. J. Prussin, 2nd, E. P. Vejerano, A. J. Tiwari, S. S. Cox, M. M. Myerburg, S. S. Lakdawala, and L. C. Marr. 2018. Influenza virus infectivity is retained in aerosols and droplets independent of relative humidity. J. Infect. Dis. 218 (5):739–47. doi:https://doi.org/10.1093/infdis/jiy221.
- Lednicky, J. A., M. Lauzardo, Z. H. Fan, A. S. Jutla, T. B. Tilly, M. Gangwar, M. Usmani, S. N. Shankar, K. Mohamed, A. Eiguren-Fernandez, et al. 2020. Viable SARS-CoV-2 in the air of a hospital room with COVID-19 patients. J. Infect. Dis. 100 (2020):476–82 doi:https://doi.org/10.1101/2020.08.03.20167395.
- Leung, N. H. L., D. K. W. Chu, E. Y. C. Shiu, K.-H. Chan, J. J. McDevitt, B. J. P. Hau, H.-L. Yen, Y. Li, D. K. M. Ip, J. S. M. Peiris, et al. 2020. Respiratory virus shedding in exhaled breath and efficacy of face masks. Nat. Med. 26 (5):676–80. doi:https://doi.org/10.1038/s41591-020-0843-2.
- Lin, X., K. Willeke, V. Ulevicius, and S. A. Grinshpun. 1997. Effect of sampling time on the collection efficiency of all-glass impingers. 1997. Am. Ind. Hyg. Assoc. J. 58 (7):480–88.
- Lin, X., T. Reponen, K. Willeke, Z. Wang, S. A. Grinshpun, and M. Trunov. 2000. Survival of airborne microorganisms during swirling aerosol collection. Aerosol Sci. Technol. 32 (3):184–96. doi:https://doi.org/10.1080/027868200303722.
- Lindsley, W. G., T. A. Pearce, J. B. Hudnall, K. A. Davis, S. M. Davis, M. A. Fisher, R. Khakoo, J. E. Palmer, K. E. Clark, I. Celik, et al. 2012. Quantity and size distribution of cough-generated aerosol particles produced by influenza patients during and after illness. J. Occup. Environ. Hyg. 9 (7):443–9. doi:https://doi.org/10.1080/15459624.2012.684582.
- Liu, Y., Z. Ning, Y. Chen, M. Guo, Y. Liu, N. K. Gali, L. Sun, Y. Duan, J. Cai, D. Westerdahl, et al. 2020. Aerodynamic analysis of SARS-CoV-2 in two Wuhan hospitals. Nature 582 (7813):557–60. doi: https://doi.org/10.1038/s41586-020-2271-3.
- Ma, J., X. Qi, H. Chen, X. Li, Z. Zhang, H. Wang, L. Sun, L. Zhang, J. Guo, and L. Morawska. 2020. Coronavirus disease 2019 patients in earlier stages exhaled millions of severe acute respiratory syndrome coronavirus 2 per hour. Clin. Infect. Dis. doi:https://doi.org/10.1093/cid/ciaa1283.
- Mainelis, G. 2020. Bioaerosol sampling: Classical approaches, advances, and perspectives. Aerosol Sci. Technol. 54 (5):496–519. doi:https://doi.org/10.1080/02786826.2019.1671950.
- Mbareche, H., M. Veillette, G. J. Bilodeau, and C. Duchaine. 2018. Bioaerosol sampler choice should consider efficiency and ability of samplers to cover microbial diversity. Appl. Environ. Microbiol. 84 (23):01589-18. doi:https://doi.org/10.1128/AEM.01589-18.
- Milton, D. K., M. P. Fabian, B. J. Cowling, M. L. Grantham, and J. J. McDevitt. 2013. Influenza virus aerosols in human exhaled breath: Particle size, culturability, and effect of surgical masks. PLoS Pathogenes. 9 (3):e1003205. doi:https://doi.org/10.1371/journal.ppat.1003205.
- Morawska, L., and J. Cao. 2020. Airborne transmission of SARS-CoV-2: The world should face the reality. Environ. Int. 139:105730. doi:https://doi.org/10.1016/j.envint.2020.105730.
- Morawska, L., and D. K. Milton. 2020. It is time to address airborne transmission of COVID-19. Clin. Infect. Dis. 71 (9):2311–313. doi:https://doi.org/10.1093/cid/ciaa939.
- Pan, M., J. A. Lednicky, and C.-Y. Wu. 2019. Collection, particle sizing and detection of airborne viruses. J. Appl. Microbiol. 127 (6):1596–611. doi:https://doi.org/10.1111/jam.14278.
- Rahmani, A. R., M. Leili, G. Azarian, and A. Poormohammadi. 2020. Sampling and detection of corona viruses in air: A mini review. Sci. Total Environ. 740:140207. doi:https://doi.org/10.1016/j.scitotenv.2020.140207.
- Ratnesar-Shumate, S.,. G. Williams, B. Green, M. Krause, B. Holland, S. Wood, J. Bohannon, J. Boydston, D. Freeburger, I. Hooper, et al. 2020. Simulated Sunlight Rapidly Inactivates SARS-CoV-2 on Surfaces. J. Infect. Dis. 222 (2):214–22. doi:https://doi.org/10.1093/infdis/jiaa274.
- Ratnesar-Shumate, S.,. Williams, G. Brian Green, M. Krause, Brian Holland, S. Wood, J. Bohannon, J. Boydston, D. Freeburger, I. Hooper, K. Beck, J, et al. 2020. Simulated Sunlight Rapidly Inactivates SARS-CoV-2 on Surfaces. J. Infect. Dis. 222 (2):214–22. doi:https://doi.org/10.1093/infdis/jiaa274.
- Santarpia, J. L., D. N. Rivera, V. L. Herrera, M. J. Morwitzer, H. M. Creager, G. W. Santarpia, K. K. Crown, D. M. Brett-Major, E. R. Schnaubelt, M. J. Broadhurst, et al. 2020. Aerosol and surface contamination of SARS-CoV-2 observed in quarantine and isolation care. Sci. Rep. 10 (1):12732. doi:https://doi.org/10.1038/s41598-020-69286-3.
- Schuit, M., S. Gardner, S. Wood, K. Bower, G. Williams, D. Freeburger, and P. Dabisch. 2020. The influence of simulated sunlight on the inactivation of influenza virus in aerosols. J. Infect. Dis. 221 (3):372–78.
- Schuit, Michael, S.,. Ratnesar-Shumate, J. Yolitz, G. Williams, W. Weaver, Brian Green, D. Miller, M. Krause, K. Beck, S. Wood, Brian Holland, J. Bohannon, D, et al. 2020. Airborne SARS-CoV-2 is rapidly inactivated by simulated sunlight. J. Infect. Dis. 222 (4):564–71. doi:https://doi.org/10.1093/infdis/jiaa334.
- Smither, S. J., L. S. Eastaugh, J. S. Findlay, and M. S. Lever. 2020. Experimental aerosol survival of SARS-CoV-2 in artificial saliva and tissue culture media at medium and high humidity. Emerg. Microbes Infect. 9 (1):1415–17.
- Stober, W. 1973. “An Evaluation of Nebulized Ammonium Fluorescein as a Laboratory Aerosol.”
- Van, D., Neeltje, T. Bushmaker, D. H. Morris, M. G. Holbrook, A. Gamble, B. N. Williamson, A. Tamin, et al. 2020. Aerosol and surface stability of SARS-CoV-2 as compared with SARS-CoV-1. N. Engl. J. Med. 382 (16):1564–67.
- Verreault, D., S. Moineau, and C. Duchaine. 2008. Methods for sampling of airborne viruses. Microbiol. Mol. Biol. Rev. 72 (3):413–44. doi:https://doi.org/10.1128/MMBR.00002-08.
- Woo, M. H., Y. M. Hsu, C. Y. Wu, B. Heimbuch, and J. Wander. 2010. Method for contamination of filtering facepiece respirators by deposition of MS2 viral aerosols. J. Aerosol Sci. 41 (10):944–52. doi:https://doi.org/10.1016/j.jaerosci.2010.07.003.
- Zhang, R., Y. Li, A. L. Zhang, Y. Wang, and M. J. Molina. 2020. Identifying airborne transmission as the dominant route for the spread of COVID-19. Proceedings of the National Academy of Sciences.
- Zhou, L., M. Yao, X. Zhang, B. Hu, X. Li, H. Chen, L. Zhang, Y. Liu, M. Du, B. Sun, et al. 2020. Detection of SARS-CoV-2 in exhaled breath from COVID-19 patients ready for hospital discharge. medRxiv. doi:https://doi.org/10.1101/2020.05.31.20115196.
- Zuo, Z.,. T. H. Kuehn, A. Z. Bekele, S. K. Mor, H. Verma, S. M. Goyal, P. C. Raynor, and D. Y. Pui. 2014. Survival of airborne MS2 bacteriophage generated from human saliva, artificial saliva, and cell culture medium. Appl. Environ. Microbiol. 80 (9):2796–803. doi:https://doi.org/10.1128/AEM.00056-14.