
 ?Mathematical formulae have been encoded as MathML and are displayed in this HTML version using MathJax in order to improve their display. Uncheck the box to turn MathJax off. This feature requires Javascript. Click on a formula to zoom.
Abstract
Laser-induced incandescence (LII) is an optical technique that is widely used for the in situ measurement of the soot volume fraction in flames. The low intensity of LII signals in low-sooting turbulent flames means that long camera acquisition times are needed to achieve sufficiently high signal-to-noise ratios. The direct application of auto-compensating LII (AC-LII) to infer the soot volume fraction from the measured LII signals can lead to large errors due to the significant decrease in the temperature of the soot particles over the duration of the camera gate. In order to reduce the measurement errors from AC-LII, we propose an improved approach in which the cooling of soot particles during the camera acquisition of LII signals is considered. The proposed methodology is applied to planar AC-LII measurements for the determination of soot volume fraction and primary particle diameter in a low-sooting turbulent flame, with the help of the open source LII software LIISim. This study represents the first application of planar AC-LII to a turbulent flame. A sensitivity analysis is also conducted in order to determine the main factors affecting the uncertainty of the proposed approach.
Copyright © 2021 American Association for Aerosol Research
EDITOR:
1. Introduction
Soot particles have been identified as the second most important anthropogenic contributor to radiative forcing, just behind carbon dioxide (Ramanathan and Carmichael Citation2008), and have been found to be harmful to human health (USEPA Citation2008). Understanding and modeling the formation of soot in combustion processes are essential in order to reduce particulate emissions and to comply with the more stringent environmental regulations that are imminent, especially in the field of aviation. In view of this, there is a need to develop optical diagnostics that enable in situ measurements of the characteristics of soot particles. Laser-induced incandescence (LII) (Melton Citation1984; Michelsen et al. Citation2007; Schulz et al. Citation2006) is a powerful technique for this application, since it can be used to determine the soot volume fraction () (Geitlinger et al. Citation1999; Ni et al. Citation1995; Shaddix and Smyth Citation1996; Wainner, Seitzman, and Martin Citation1999; Will, Schraml, and Leipert Citation1996) and the primary particle size (Melton Citation1984; Michelsen Citation2003) with high spatial and temporal resolution. LII involves the rapid heating of soot particles to close to their sublimation temperature (∼4000 K), using a high-power laser pulse, and detection of the resultant incandescence signal emitted by the heated soot particles. Although it is often stated that the intensity of emission is proportional to the soot volume fraction, this is correct only at a given temperature; the intensity of emission is also dependent on other physical quantities (such as the optical properties of the soot and the parameters of the experiment) that can be assumed or determined. After the laser pulse interaction with the flame, the heated soot particles cool to a final temperature that is close to the local gas temperature via various processes, mainly sublimation shortly after the laser pulse (∼100 ns) and conduction over a longer period (Michelsen Citation2003). In time-resolved LII, the measured temporal decay of the incandescence signal or the temperature of the soot can be interpreted in terms of the effective primary particle size using a LII model (Michelsen et al. Citation2007).
Based on the assumption that the LII signal is proportional to the soot volume fraction, a calibration procedure is necessary for quantitative measurements. One commonly used method involves using a reference 1D flame, on which an additional extinction measurement is performed to provide a volume fraction that can be used (under certain assumptions) to calibrate the LII setup (Choi and Jensen Citation1998; Quay et al. Citation1994; Vander Wal Citation1998). This calibration method is often referred to as ‘conventional LII’ and has several limitations. For example, the optical properties of the soot in the reference flame (often characterized using the absorption function ) may be different from those to be measured. This source of error can be eliminated by calibrating the LII experiment using an extinction measurement in the flame of interest (Axelsson, Collin, and Bengtsson Citation2001), which also enables correction for laser trapping in time-averaged images. However, this approach may not be suitable for an environment with a high concentration of soot due to strong laser trapping (Simonsson et al. Citation2019). The LII signal is proportional to the soot volume fraction only if the incandescence temperature of the soot at the calibration stage is the same as at the measurement stage, and if the temperature is uniform over the detection volume. To meet these requirements, high laser fluences and nearly top-hat laser profiles are used in LII measurements to ensure that the soot particles are heated to the sublimation temperature (∼4000 K) or slightly above. However, the use of a high laser fluence can lead to an underestimation of the soot volume fraction through partial sublimation of the particles (Olofsson et al. Citation2013). In addition, errors may arise in dense flames, since the attenuation of the laser energy through the flame (laser trapping) will cause an artificial underestimation of the soot volume fraction (Roussillo et al. Citation2019). Inhomogeneities in the laser sheet can also cause this problem (Simonsson et al. Citation2019). In a turbulent flame, beam steering can also modify the local fluence and temperature, and can induce an error of up to 30% in the soot volume fraction (Sun et al. Citation2015a).
A related technique called auto-compensating LII (AC-LII) has also been widely used (De Iuliis, Cignoli, and Zizak Citation2005; De Iuliis et al. Citation2007; Snelling et al. Citation2005). It involves detecting LII signals in two narrow regions of the visible and near infrared spectra. Following the principle of classical two-color pyrometry (De Iuliis et al. Citation1998; Ladommatos and Zhao Citation1994), AC-LII enables the determination of the effective temperature of the soot, meaning that the assumption of near-sublimation temperature made in conventional LII is no longer required, and that low fluences can be used. Since the incandescence temperature of the soot is determined, the volume fraction can be obtained even in the presence of fluctuations in the laser energy or laser trapping through the flame. Calibration of the detectors is required in AC-LII, and this can be achieved by using a reference source of known radiance (generally an integrating sphere). The detectors then measure the absolute radiance, thus avoiding the need for a source of known soot concentration or extinction measurements. However, the issue of signal trapping (attenuation of the signal between the probe volume and the camera) still arises in AC-LII, and the values of the absorption function E(m) at the detection wavelengths also need to be assumed. The latter is a significant limitation of all LII techniques, given the fact that E(m) varies spatially in flames due to its dependence on soot maturity (Leschowski et al. Citation2015; Yon et al. Citation2021).
The application of planar AC-LII is common for laminar flames (De Iuliis et al. Citation2007; Snelling et al. Citation2005), and the results have been shown to agree well with those of extinction measurements. To the best of our knowledge, planar AC-LII has never been used to measure soot in unsteady flames, which we found surprising. Recent LII measurements in complex flames, i.e., high- turbulent flames (Mulla and Renou Citation2019), low-
laminar flames (Tian et al. Citation2015), low-
turbulent flames (Narayanaswamy and Clemens Citation2013; Roussillo et al. Citation2019) or high-pressure turbulent flames (Geigle et al. Citation2015a, Citation2015b), have all been made with the conventional approach (one-color signal detection, extinction-based calibration). With a view to applying the planar AC-LII technique to turbulent flames, Crosland, Johnson, and Thomson (Citation2011) studied the application of this method to a laminar diffusion flame with single-shot signal acquisition, in order to evaluate the ability of this technique to provide instantaneous distributions for the soot volume fraction. The authors identified the photon shot noise as a non-negligible source of error. This is characterized by a high-frequency noise in the signals that is enhanced when the width of the detector gate is reduced. Finally, they concluded that the most critical parameter for the application of AC-LII was the absorption function
as this is the main source of uncertainty in the determination of soot volume fraction for all LII and absorption-based methods. This is a quantity that is difficult to determine accurately, and varies over the lifetime of soot particles according to their composition (Bescond et al. Citation2016). Numerous experimental studies have shown large variations in the measured optical properties of soot (Chang and Charalampopoulos Citation1990; Dalzell and Sarofim Citation1969; Zhu et al. Citation2000).
The aim of the present study is to investigate a low-sooting turbulent flame with the planar AC-LII technique, in order to benefit from the advantages of the two-color and time-resolved features of this method. However, due to the low sooting propensity of this kind of flame, a fairly large value for the detector gate width is necessary to reduce the photon shot noise induced by low incandescence signals and to enhance the signal-to-noise ratio. In previous studies, Tian et al. (Citation2015) and Roussillo et al. (Citation2019) used a gate width of 100 ns. A large value such as this can cause an error in the measurement of if the cooling of soot particles during signal acquisition is not considered at the data analysis stage. This is because the effective soot temperature becomes lower as the camera gate width increases (Cenker et al. Citation2015). In order to take into consideration the cooling effect of soot particles over the camera gate width in AC-LII data analysis, we propose a methodology in Section 2 that relies on the evolution of the soot particle temperature, which is predicted numerically using an open-source LII modeling software called LIISim (Mansmann et al. Citation2018). Our methodology is also extended to the determination of the primary particle diameter by using the two-color time-resolved signal detection features of the AC-LII method and by considering the natural intermittency of the turbulent flame. We compare our results with those of the conventional AC-LII method (without considering the cooling effect of soot particles during the camera gate width), and evaluate the sensitivity of the measured soot volume fraction to the different parameters involved in our method. This last point is presented as a complement to the study of Crosland, Johnson, and Thomson (Citation2011), and the sources of uncertainty that have already been analyzed by Crosland et al. will therefore not be examined here.
2. Proposed methodology
2.1. Impact of the camera gate width
A qualitative description of the impact of the camera gate width is given in this section, and the proposed methodology is discussed. The reader can find a detailed theoretical treatment of our methodology in the online supplementary information (SI).
As explained in the Introduction, the classical two-color pyrometry approach used in AC-LII involves measuring the thermal emission of soot particles at two different spectral intervals and
centered on
and
respectively. The corresponding effective temperature
is then deduced from the ratio of the two signals
and
based on the Planck law and the assumed spectral emissivities:
(1)
(1)
where
is related to the Plank constant, the speed of light, and the Boltzmann constant,
is the absorption function, and
and
are the intensity calibration coefficients. In a planar measurement, two cameras are used to collect the signals emitted in two distinct spectral bands, with identical signal collection instants and gates. The signal collection instant can be delayed with respect to the laser pulse
and the duration of signal collection (the camera gate width)
can be varied. For low-sooting flames and single-shot acquisitions, the shot noise must be reduced in order to achieve an acceptable signal-to-noise ratio, and this means that
must be increased to a few tens of nanoseconds. This relatively long duration in comparison to the LII signal decay time can have a significant impact on the value determined for the soot effective temperature
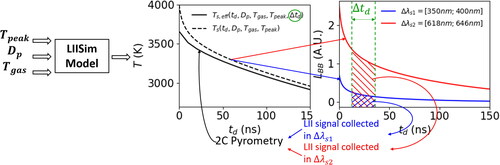
A schematic diagram that illustrates the impact of the camera gate width on the effective temperature of the soot is shown in for simulated LII signals based on LIISim (Mansmann et al. Citation2018), for a primary particle diameter
of 15 nm, a bath gas temperature of 1550 K and a peak temperature of 4000 K. The LIISim model of the decay of the soot temperature starts with an assumed peak soot temperature, without considering the laser heating phase. In , the dashed black line corresponds to the instantaneous soot temperature
calculated using LIISim. The two cameras collect temporally integrated signals, represented by the colored hatched regions in the plot on the right of , based on the values for the starting instant
and gate duration
used in the experiments. These integrated signals are then used to determine the effective temperature
represented by the plain black curve in the middle plot of , which was obtained by varying the starting time for signal collection
while keeping
at a constant value of 30 ns. It can be seen that
is consistently lower than
. The difference between these two temperatures increases with
Figure 1. Evolution of the effective temperature (solid curve) based on the ratio between the LII signals integrated over the detector gate width in the two-color method (shown by the red and blue shaded areas) and the instantaneous soot temperature modeled by LIISim (dashed curve). The input parameters are
and
Since the intensity of Planck blackbody radiation is a nonlinear function of temperature, and the decay of the soot temperature is also nonlinear over time, the assumption of a constant temperature determined from two-color pyrometry over the camera gate will not give the same intensity of incandescence as that based on the temporal integration of the real temperature
An error can obviously be introduced into the value determined for the soot volume fraction using AC-LII when the incandescence intensity per unit particle volume is estimated based on the effective temperature. In this article, the soot volume fraction calculated with the effective temperature is represented as (where subscript stands for “no cooling”), whereas
(“cooling considered”) refers to the volume fraction calculated by considering the blackbody intensity evolution during time due to the decreasing soot temperature. Mathematical derivations of the expressions for
and
as functions of the experimental signals are given in the online SI.
can be expressed as:
(2)
(2)
where
is the signal collected by the detector when exposed to a light source of radiance
calibrated against a reference intensity,
is the thickness of the laser light sheet which is small compared to the dimension of the flame, and
is the blackbody radiance.
is calculated as follows:
(3)
(3)
The error in the calculated value for the soot volume fraction is expected to increase with the gate width of the camera. shows that becomes lower than
as the camera gate width increases for
= 15 nm,
= 1550 K,
= 4000 K, and
For short gate widths of less than about 20 ns, the error is relatively low (less than ∼5%), because the intensities of the soot incandescence calculated based on the effective temperature or with a decreasing instantaneous temperature are similar. For higher values of the gate width, for instance around 100 ns, the error becomes non-negligible and can reach close to 20%. This source of error was addressed by Crosland, Johnson, and Thomson (Citation2011) in order to justify the low impact of their gate width (40 ns). Cenker et al. (Citation2015) also performed a study of the sensitivity of
to the detector gate width, and found that the actual soot temperature may be underestimated by about 200 K for a gate width of 15 ns. However, these studies did not include a correction of this phenomenon in their evaluation of the soot temperature and volume fraction.
Figure 2. Variation of with detector gate width
This evaluation was conducted for a primary particle diameter
of 15 nm, a bath gas temperature of 1550 K, a peak temperature of 4000 K, and
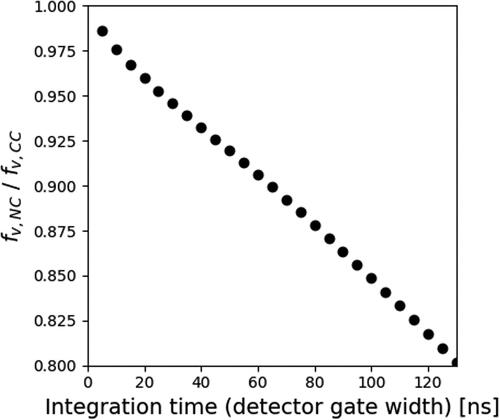
2.2. Determination of the physical parameters for TiRe-LII
As shown in and , the error induced by the camera gate width when evaluating the soot volume fraction can be determined if the evolution over time of the instantaneous soot temperature is known or can be modeled with high resolution. To achieve this, the governing parameters of the model (mainly the primary sphere diameter, the local gas temperature, and the soot peak temperature at the beginning of particle cooling) must be known. Experimentally, the evolution of the soot temperature is determined using two-color pyrometry by varying i.e., by shifting the camera opening time relative to the peak LII signal in planar LII measurements.
TiRe-LII has been widely used for in situ measurements of the primary particle diameter of soot, in both point (Bladh et al. Citation2015; Snelling et al. Citation2000) and planar configurations, and with one (Tian et al. Citation2017) or several cameras (Sun et al. Citation2015b). In the present study, the TiRe-LII method is used to examine the effect of the camera gate width on AC-LII measurements. In addition to allow for a correct evaluation of the effective temperature and volume fraction, it also enables the determination of a 2D map of the primary particle diameter in the flame. Soot particles are aggregates composed of a number of primary particles (also referred as monomers) with diameter For simplicity, the polydispersity of the primary particles is not considered in the present study, although it could in principle be accounted for if the standard deviation were known. As a consequence, the value determined for
is a monodisperse equivalent diameter that tends to be biased toward large particles, and is generally larger than the mode of the real polydisperse size distribution.
In the present study, is varied from 0 to 110 ns relative to the peak LII signal, in order to capture the temporal decay of the temperature. The collection gate width
is set to 30 ns in the measurement of
as a tradeoff between an adequate temporal resolution for the temperature decay and a sufficiently large signal-to-noise ratio. Based on these experimental constraints, LIISim is used to generate a dataset of effective temperature decays (through a temporal integration of the modeled instantaneous LII signals over the camera gate width) for ranges of values for
of 4–40 nm and
of 3400–4300 K. The surrounding gas temperature
is set at 1550 K for the whole flame. The impact of this assumption on the results is evaluated in Section 4.3.1. In this approach, modeling of the soot temperature starts from the assumed peak value, without taking into consideration the laser heating process. The sublimation term is considered in the particle cooling process, and is expressed as a function of the soot temperature. Based on the LII model, the contribution from sublimation is expected to be low. For instance, for
a reduction in
of 0.4 nm is computed by the model, after a sufficiently long time that sublimation becomes negligible.
To determine the two key physical parameters (), we minimize the difference between the modeled and measured effective temperature
over a range of values for the camera delay
Due to the intermittency of the flame and the experimental setup used, each camera delay
provides different instantaneous effective temperature distributions corresponding to different sooting events. The temperature decay at each position in the flame therefore needs to be averaged based on events corresponding to the presence of soot. However, a classical time averaging would produce artificially low temperatures that are not representative of the effective incandescence temperature used in the blackbody radiative intensity to determine the soot volume fraction. For this reason, a conditioned temporal average of the effective temperature is performed for each time delay (denoted as
and at each position in the flame. This is referred to as the ‘gate-sweeping’ technique (Hadef et al. Citation2013). The experimental curve
is then fitted (least mean square) to the numerical database to determine the two key physical parameters
and
which reproduce the measured particle temperature curve. It should be noted that these two parameters have very different impacts on the temporal behavior of the soot temperature. Whereas
primarily affects the amplitude of the soot temperature,
affects the decay rate. It can therefore be reasonably concluded that the proposed inversion process based on these two parameters will not suffer from a strong coupling effect that would result in an unphysical pair of parameters. The confidence in the value of
determined in this way depends on the quality and hypotheses of the model (for example, the assumption of monodispersed primary particles). Finally, the above operation at a given location in the flame is repeated for all the image pixels, to produce a 2D distribution of
The sensitivity of the mean value of
in a turbulent flame to fluctuations in the local gas temperature, the peak soot temperature, and the actual soot primary particle diameter using the gate-sweeping technique is investigated in the online SI.
2.3. Consideration of the temperature decay in the determination of 
Based on the TiRe-LII approach described in the previous section, the two key physical parameters () for the LII model were determined at each position in the flame from a conditional average of the effective temperature decay. Based on the assumption that the temporal fluctuation of the peak soot temperature is negligible at each position in the flame (when soot is present), the model can be used to correct the locally determined value for the soot volume fraction. A longer gate width (
ns) was used to measure the soot volume fraction than the value of 30 ns used to determine the two physical parameters (
). To allow us to consider fluctuations in the peak soot temperature caused by fluctuations in laser fluence and local gas temperature, a dedicated database of effective temperatures
was generated using LIISim for different pairs of
and
with
ns. At each pixel and at each instant (two single-shot images of the LII signal), the experimentally determined value for
was used to determine the instantaneous peak temperature by matching the measured and modeled
In this procedure, the value for
determined in the previous section was used, which enabled us to evaluate a local and instantaneous peak temperature and its corresponding modeled instantaneous temperature decay, which was then used to calculate the soot volume fraction in the ‘cooling considered’ case, i.e.,
3. Experimental setup
3.1. Burner
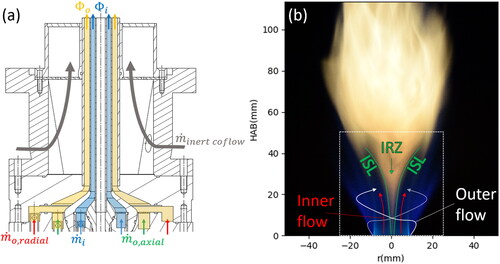
The turbulent premixed ethylene/air flame studied in this work was produced by the SIRIUS stratified swirl burner composed of two annular coflows, the outer of which could be swirled. The design of this burner was based on the SANDIA swirl burner (Sweeney et al. Citation2012a, Citation2012b).
Swirling motion was ensured through a combination of radial and axial injection at the base of the burner (see ). The structure of the flow in the flame was analyzed using particle image velocimetry (PIV) and is shown schematically in . The mean velocities of the outer and inner flows were around 15 and 5 respectively. The swirling motion and pressure gradients induced by these differences in velocity led to the formation of an inner recirculation zone (IRZ) delimited by an inner shear layer (ISL), where the mean flow velocity was about 1
Large turbulent eddies were observed in the IRZ. The area under study is enclosed by the dashed rectangle in , and was 50 mm wide and 47.5 mm high.
Figure 3. (a) Profile view of the SIRIUS burner, and (b) photograph of the premixed flame, with information on the flow field under study and the direction of propagation of the laser sheet.
3.2. Auto-compensating laser-induced incandescence
The experimental setup used for planar AC-LII is shown in . An 8 ns (full width half maximum) 1064 nm laser pulse (Quantel Brilliant Eazy) was shaped into a sheet, and was characterized using a beam profiler (UsBeamPro CMOS, ). It had a nearly top-hat energy profile along both the height and width, with a height of 60 mm and a thickness of approximately 400 µm, and this was the value used for the laser thickness when calculating
Figure 4. (a) Schematic of the two-dimensional AC-LII experimental setup, and (b) characterization of the energy of the laser sheet (image, vertical and horizontal energy profiles).
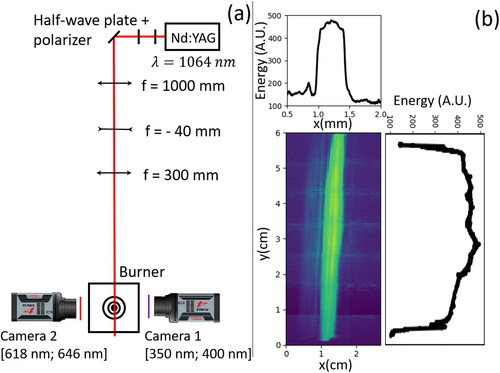
As shown in incandescence signals were recorded simultaneously on two cameras (Princeton Instruments PIMAX4 emICCD) equipped with different bandpass filters (Edmund Optics OD4 CWL with 375 nm 50 nm width and Semrock FF02-632/22-25), to enable detection in the intervals [350 nm; 400 nm] and [618 nm; 646 nm]. The laser repetition rate was set to 10 Hz, and the cameras were triggered after every three laser pulses, in order to use the whole CCD area. The camera gates were opened for ns from the peak of the LII signal (
ns) to determine the soot volume fraction as described in Section 2.1, and the gate width was reduced to
ns (with variable
) to determine the primary particle diameters, as described in Section 2.2. The laser fluence was measured using a power meter and a beam profiler, and was set to 315 mJ/cm2. Although this high value for the fluence can induce some sublimation of the soot particles, and cause underestimation in the measured soot volume fraction (Cenker and Roberts Citation2017; Olofsson et al. Citation2013), it was necessary in order to maximize the incandescence signal of the low-sooting flame. The fluence curve is given in the online SI, and shows a plateau regime starting at approximately 300 mJ/cm2, which is consistent with the values found in the literature (De Iuliis, Cignoli, and Zizak Citation2005; Schulz et al. Citation2006) for a 1064 nm laser excitation. To reduce the shot noise further, the raw images were smoothed with a Gaussian filter with a standard deviation of 5 pixels.
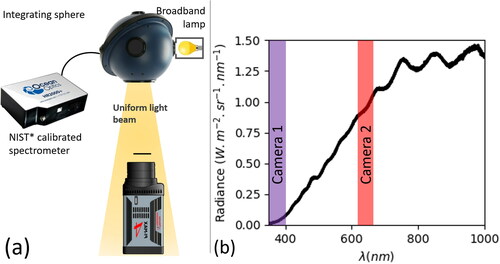
3.3. Calibration setup
To calibrate the experimental setup, we replaced the laser sheet with an integrating sphere positioned in front of the cameras (see ). The interior walls of the integrating sphere were illuminated by a lamp, resulting in a broadband uniform light source at the output of the sphere. A NIST calibrated spectrometer was connected to the system to allow us to measure the output spectral radiance (). The response of the camera to the sphere
was recorded and used to determine the calibration factor for the detection.
Figure 5. (a) Schematic of the experimental setup for camera calibration (*National Institute of Standards and Technology), and (b) spectral radiance of the integrating sphere, showing the two spectral intervals used for LII signal detection.
When determining the volume fraction and effective temperature of the soot, the absorption function was set to the value used by Bescond et al. (Citation2016) (for mature ethylene soot, the values were 0.45 and 0.4 at wavelengths of 375 nm and 627 nm, respectively). This was assessed as being a reliable choice in a recent review by Liu et al. (Citation2020).
4. Results
4.1. Determination of model parameters () for TiRe-LII
depicts the conditioned time-averaged laser-heated soot effective temperature distributions obtained for different delays of the camera gate relative to the instant of the peak LII signal. As explained in Section 2.2, only conditionally time-averaged soot effective temperature fields were used to determine
For each instantaneous image, the calculated value for the effective temperature was included in the time-averaging only if the corresponding raw signal was larger than a threshold value. This threshold value was set manually, based on the authors’ experience of data analysis, to determine if the intensity at a given pixel was considered as LII signal from soot or background noise. Since the soot was localized around the center of the image in the flame investigated, it was relatively easy to set this threshold value. Nevertheless, its effect on the calculation of
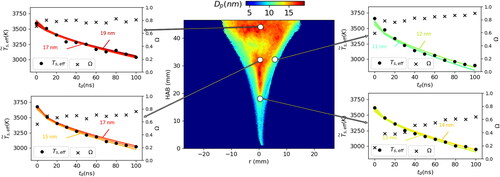
is discussed in Section 4.3.1. The value determined for the temporal rate of temperature decay shown in is well within the range predicted by LIISim for diameters of between 5 and 40 nm, and a comparison between the experimental and modeled results enabled us to determine an effective primary particle diameter. This procedure was repeated for all the pixels in the image to obtain a primary particle diameter field, as shown in . This figure also presents a comparison of the measured soot effective temperatures with the corresponding modeled values as a function of
at four locations in the flame. The model allows us to accurately fit the experimental results for the whole flame. The intermittency index
(Roussillo et al. Citation2019) is close to one in highly intermittent regions, whereas it is null at positions where soot is always present. This index is shown in at the four selected locations for different time delays. Its value appears to be approximately constant for variations in the camera gate delay (
meaning that the thresholding method used was suitable for the range of intensities from the prompt LII signal up to 100 ns after the peak LII signal. The results show that in the investigated region,
falls in the range 5–20 nm, with peak values occurring in the IRZ. In a recent study, we carried out measurements of the planar laser-induced fluorescence for polycyclic aromatic hydrocarbons (PAHs) and hydroxyl radicals (OHs) and velocity measurements using PIV for this flame (Bouvier et al. Citation2021). The results of that study showed good agreement between the low
region shown in light blue in and the regions of PAHs, which are known to be precursors to soot. The transition from PAHs to small solid soot particles that subsequently grow into larger ones can be clearly observed. The red area in the upper part of the investigated region is part of the IRZ, where large pockets of soot particles with long residence times propagate upstream. This may offer an explanation for the large soot primary particle diameters found in the IRZ.
Figure 6. (a) Evolution of the conditioned time-averaged laser-heated soot effective temperature field (over a detector gate width of 30 ns) obtained for different delays of the camera gate, and (b) comparison between the experimentally determined soot effective temperature (at the location of the white crosses in (a)) and the results of LIISim simulations (colored curves for ) for a range of primary particle diameters from 5 to 40 nm, as a function of time.
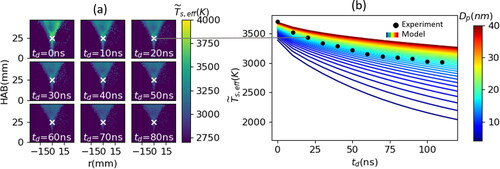
Figure 7. 2D distributions of primary particle diameters, determined using 2D time-resolved LII, with experimental values for the effective temperature temporal decay (dots) and values from LIISim modeling (colored curves) at four locations in the flame. The colors of the curves correspond to the color bar at the top of the image. The corresponding temporal variation in the intermittency index at these four locations is also shown by crosses.
4.2. Measurements of the soot volume fraction
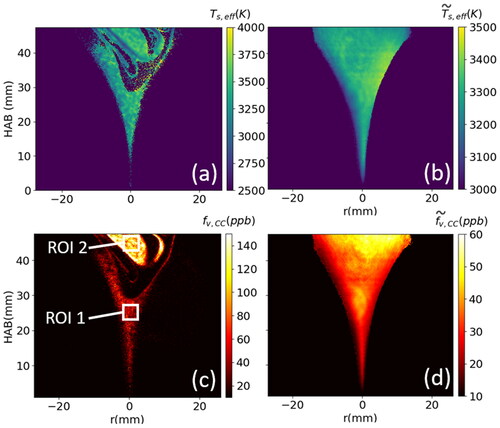
The values for the soot volume fraction reported in this section were determined by considering particle cooling during camera acquisition, following the procedure described in Section 2.3. A comparison with the ‘no cooling’ method will be presented in Section 4.3.2. For this analysis, the camera gate duration was fixed at ns and began at the peak of the LII signal (
ns). An example of a single-acquisition temperature field is shown in . The corresponding single-acquisition field of the volume fraction
is given in . It can be seen that the conditioned time-average effective temperature () is higher on the right (the side from which the laser sheet enters the flame), which is likely to be caused by a decrease in the incoming laser fluence due to soot absorption (laser trapping). This feature is automatically corrected in AC-LII due to the determination of the effective soot temperature; evidence for this is provided by the relatively symmetrical distribution of the conditionally averaged soot volume fractions (), as expected from symmetrical burner and inlet flow conditions. The classical time-averaged volume fraction is naturally lower due to soot intermittency (see online SI). However, the effect of signal trapping (due to soot between the probe volume and the camera) is not corrected. Since the signal absorption is larger at lower wavelengths, this can produce a bias in the determination of the effective temperature. The experimental configuration used here (two cameras on opposite sides of the flame) can induce a further bias, as the signals detected by the two cameras may be affected by different degrees of signal trapping. Nevertheless, an evaluation of the optical path (not presented here) seemed to indicate that incandescence signal attenuation was limited to 0.7%.
Figure 8. (a) Distributions of effective soot temperature determined using a single-acquisition method and (b) conditioned time-averaging; (c) soot volume fraction determined using a single-acquisition method and (d) conditioned time-averaging. The LII signal collection started at and the camera gate width was 100 ns. The soot volume fractions shown in (c) and (d) were calculated taking into account the cooling effect during signal acquisition.
4.3. Sensitivity assessment
We analyzed the sensitivity of our method of determining and
to various experimental and post-processing parameters, with a particular focus on the sensitivity of the ‘cooling considered’ method of determining
to the estimated value of
In this section, we present a sensitivity analysis of two regions of interest (ROI) that were chosen in order to consider both a low-sooting region with weak intermittency (ROI 1 in ) and a high-sooting region marked by high intermittency (ROI 2 in ).
4.3.1. Primary particle diameter
We first investigated the effect of the dispersion in the effective temperature on the determination of The experimental decay curve for the effective temperature shown in is compared with the curves predicted by the model that encompass the experimental values. This is illustrated in , where the experimental results are shown in black filled circles and the results from the model are shown as curves of different colors for different locations. This enables us to quantify the global uncertainty in
caused by the overlap of
with a few modeled temperature curves as approximately 2 nm over the entire sooting region under study.
The 2D field of shown in was calculated based on conditionally time-averaged effective temperatures determined for different delays of the camera gate. In this case, the camera gate width used to determine the effective soot temperature was set at
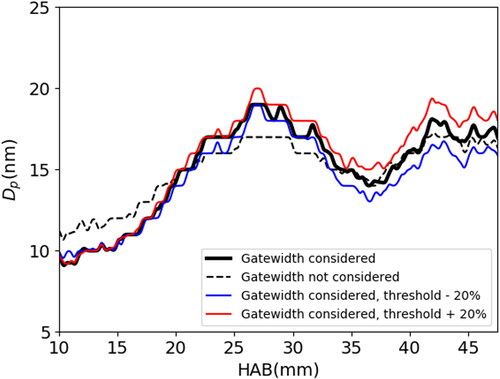
ns. We then analyzed the sensitivity of the primary particle diameter to the camera gate width and the signal threshold used to determine whether the signal was due to soot incandescence or should be considered as noise, as required for the evaluation of the conditionally averaged soot effective temperature. shows a plot of the vertical profiles of
along the centerline of the burner, calculated with (solid curves) and without (dashed curves) the camera gate-width effect. These correspond to the solid and dashed curves in , respectively. It appears that ignoring the gate width effect in the analysis causes an underestimation for
with the exception of the lower part of the flame, where the primary particle diameters are relatively small (below about 15 nm). The uncertainty in
due to the gate width effect is low in regions that are close to the burner exit, but increases with the height above the burner (HAB) to reach 2 nm in the middle and 1 nm in the upper part of the investigated region. The different colored curves in represent the different threshold values used to determine whether the intensity is signal or noise; these affect the conditionally time-averaged effective temperature and hence the determination of
The reference case, shown by the thick solid black curve in , was computed using the selected threshold. The sensitivity of
to the threshold value was investigated by varying the selected threshold value by plus and minus 20%, as shown by the solid red and blue curves, respectively. The differences in
caused by these threshold values were negligible for the lower part of the flame, but increased with HAB and intermittency. The maximum deviation in
between the +20% and −20% curves is 3 nm in the upper part of the flame region under study. The gate width effect and threshold value produced larger errors with increasing
As can be seen from , the temperature decay curve is less sensitive to the primary particle diameter for large
This means that a slight variation in the temperature decay rate will lead to a larger difference in the measured
for larger primary particles.
Figure 9. Vertical profiles of along the burner centerline (at r = 0) when different threshold values are used for conditional averaging (shown in different colors), with (solid lines) and without (dashed line) taking into account the camera gate width effect in the analysis. The reference case is shown as a solid black line.
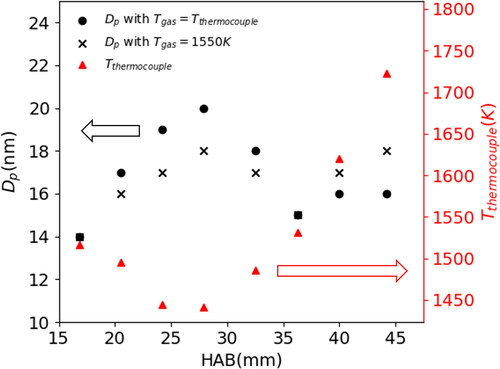
The surrounding gas temperature was also suspected to be an important parameter affecting the LII simulation. Its impact on particle sizing in LII was studied by Will et al. (Citation1998), who found that a 10% error in could cause a 30% error in
The results presented above are based on a local gas temperature that was set to a constant value of 1550 K everywhere. In order to assess the impact of the spatial variation in the flame temperature on the determination of
in the present configuration, thermocouple measurements of flame temperature were performed. A B-type (platinum-rhodium) thermocouple with a diameter of 50 µm was used to measure the gas temperature at different positions along the centerline of the burner. The measured temperatures were corrected for radiation heat losses, following the procedure used by Bradley and Matthews (Citation1968). The temperatures measured using thermocouples
are shown in as red filled triangles. It can be observed that the centerline temperatures vary between about 1450 K at 25 to 30 mm HAB and 1720 K at 45 mm HAB in the IRZ, where hot burnt gases are entrained to the center of the flame. The effect of local gas temperature on
was then evaluated by comparing the values for
that were determined based on a constant gas temperature of 1550 K and with the thermocouple measurements of the local gas temperature
along the centerline of the flame. In the region where
K, the value for
determined based on
= 1550 K was a slight underestimate. Conversely, at HAB where
K, the value of
based on
= 1550 K was an overestimate. However, this effect was relatively small (
1–2 nm) in comparison with the spatial variations in
observed over the entire region of the flame ().
Figure 10. Effect of the local gas temperature on the measured value of for varying HAB along the burner centerline, for a constant
1550 K (black crosses) and
measured using a thermocouple (solid black circles). The measured thermocouple temperatures are shown as solid red triangles.
4.3.2. Soot volume fraction
summarizes the sensitivity of the soot volume fraction to the camera gate width effect, for a value of ns. This analysis was performed in both regions of interest (ROI1 and ROI2) shown in , corresponding to low and high intermittencies, respectively. The sensitivity was evaluated for both single-shot and conditional averaging. Using the ‘cooling considered’ case as a reference, we can observe that ignoring the camera gate width effect produces an underestimate of the volume fraction of about 7% in ROI 1 and of 6% in ROI 2. This quantifies the role played by the temperature decay which is partly governed by the primary particle diameter
Since the uncertainty in
was about 3 nm, as discussed above, we also analyzed the impact of a variation of ± 3 nm in
on the soot volume fraction. The effect of uncertainty in
on the determination of volume fraction was estimated to be between the extreme cases (+3 and −3 nm) and the reference case. The relative difference is higher in the lower part of the flame, where
is smaller, and a slight change in the primary particle diameter induces a larger change in the temperature decay (see ). As expected, the soot volume fractions are generally higher when soot cooling over the camera gate width is considered. This demonstrates the importance of the proposed method.
Table 1. Soot volume fractions determined by conventional AC-LII for ROI 1 and ROI 2 marked by different soot intermittencies with (
and without (
considering the cooling. Influence of the primary particle diameter used in the LII model on
evaluation.
5. Conclusions
In the present work, AC-LII in a 2D configuration is applied to a low-sooting turbulent flame with strong intermittency. This method can provide instantaneous maps of the soot volume fraction, as it takes into consideration the possible non-uniformity of the laser-heated soot temperature caused by laser trapping or non-uniformity in the laser sheet. This technique also enables us to infer the distribution of primary particle diameters from the measured temporal decay rate of the effective soot temperature, based on time-resolved two-color LII signals.
The application of AC-LII to low-sooting flames reveals the necessity of prolonging the camera signal acquisition time to achieve adequate signal-to-noise ratios. This leads to a non-negligible error in the measured soot volume fraction in conventional AC-LII. To minimize the error in the measurement of the soot volume fraction in conventional AC-LII, we proposed a method that explicitly considered the decrease in the temperature of the soot during signal acquisition. The proposed methodology was based on the particle temperature modeled using the publicly available LII modeling software LIISim. In our methodology, the primary particle diameter was first determined by comparing the conditionally averaged effective soot temperature decay curve obtained at different values for the delay in camera acquisition with the database created using LIISim. The second step was to explicitly consider the temporal variation in the LII signal emitted by a single primary particle during the camera gate width, in order to improve the accuracy in the determination of the soot volume fraction. Even for a gate width of up to 100 ns, the underestimation of the soot volume fraction in the conventional AC-LII was less than 10%, meaning that it is likely to be unnecessary to apply the complex analysis proposed here if the purpose is simply to assess the soot volume fraction with an acceptable level of accuracy.
We evaluated the sensitivity of the proposed methodology to the signal threshold level, fitting quality and gas temperature. Each parameter caused an uncertainty in the primary sphere diameter of about 3 nm. The error propagation related to the effect of the primary particle diameter on the determination of the volume fraction was estimated to be 15% in the worst case. However, these errors in the soot volume fraction remain low compared to an analysis of the same set of images using extinction-calibrated LII, which overestimated the volume fractions by a factor of four (Bouvier et al. Citation2021).
This study demonstrates that the planar AC-LII technique can be applied to complex turbulent sooting flames to obtain quantitative results in terms of the soot volume fraction, primary particle diameter and intermittency of soot pockets. In future research, different LII models could be compared using the proposed methodology, and the polydispersity in the primary sphere size could also be incorporated.
Supplemental Material
Download MS Word (322.5 KB)Acknowledgments
The authors gratefully acknowledge funding from the European Union as part of the SOPRANO H2020 project under Grant Agreement No. 690724. The authors also thank the members of CORIA laboratory who supported the experiments: Gilles Godard, Alexis Vandel, Franck Lefebvre and the workshop team.
Additional information
Funding
References
- Axelsson, B., R. Collin, and P.-E. Bengtsson. 2001. Laser-induced incandescence for soot particle size and volume fraction measurements using on-line extinction calibration. Appl. Phys. B 72:367–72.
- Bescond, A., J. Yon, F. X. Ouf, C. Rozé, A. Coppalle, P. Parent, D. Ferry, and C. Laffon. 2016. Soot optical properties determined by analyzing extinction spectra in the visible near-UV: Toward an optical speciation according to constituents and structure. J. Aerosol Sci. 101:118–32. doi:10.1016/j.jaerosci.2016.08.001.
- Bladh, H., N.-E. Olofsson, T. Mouton, J. Simonsson, X. Mercier, A. Faccinetto, P.-E. Bengtsson, and P. Desgroux. 2015. Probing the smallest soot particles in low-sooting premixed flames using laser-induced incandescence. Proc. Combust. Inst. 35(2):1843–50. doi:10.1016/j.proci.2014.06.001.
- Bouvier, M., G. Cabot, J. Yon, and F. Grisch. 2021. On the use of PIV, LII, PAH-PLIF and OH-PLIF for the study of soot formation and flame structure in a swirl stratified premixed ethylene/air flame. Proc. Combust. Inst. (2020) 38(1):1851–8. doi:10.1016/j.proci.2020.10.002.
- Bradley, D., and K. Matthews. 1968. Measurement of high gas temperatures with fine wire thermocouples. J. Mech. Eng. Sci. 10(4):299–305. doi:10.1243/JMES_JOUR_1968_010_048_02.
- Cenker, E., G. Bruneaux, T. Dreier, and C. Schulz. 2015. Sensitivity analysis for soot particle size imaging with laser-induced incandescence at high pressure. Appl. Phys. B 119(4):745–63. doi:10.1007/s00340-015-6009-0.
- Cenker, E., and W. L. Roberts. 2017. Quantitative effects of rapid heating on soot-particle sizing through analysis of two-pulse LII. Appl. Phys. B 123(3):74. doi:10.1007/s00340-017-6653-7.
- Chang, H. C., and T. T. Charalampopoulos. 1990. Determination of the wavelength dependence of refractive indices of flame soot. Proc. R. Soc. Lond. Series A 430(1880):577–591.
- Choi, M. Y., and K. A. Jensen. 1998. Calibration and correction of laser-induced incandescence for soot volume fraction measurements. Combust. Flame 112:485–91. doi:10.1016/S0010-2180(97)00139-9.
- Crosland, B. M., M. R. Johnson, and K. A. Thomson. 2011. Analysis of uncertainties in instantaneous soot volume fraction measurements using two-dimensional, auto-compensating, laser-induced incandescence (2D-AC-LII). Appl. Phys. B 102(1):173–83. doi:10.1007/s00340-010-4130-7.
- Dalzell, W. H., and A. F. Sarofim. 1969. Optical constants of soot and their application to heat-flux calculations. J. Heat Transfer 91(1):100–4. doi:10.1115/1.3580063.
- De Iuliis, S., M. Barbini, S. Benecchi, F. Cignoli, and G. Zizak. 1998. Determination of the soot volume fraction in an ethylene diffusion flame by multiwavelength analysis of soot radiation. Combust. Flame 115(1–2):253–61. doi:10.1016/S0010-2180(97)00357-X.
- De Iuliis, S., F. Cignoli, and G. Zizak. 2005. Two-color laser-induced incandescence (2C-LII) technique for absolute soot volume fraction measurements in flames. Appl. Opt. 44:7414–23. doi:10.1364/ao.44.007414.
- De Iuliis, S., F. Migliorini, F. Cignoli, and G. Zizak. 2007. 2D soot volume fraction imaging in an ethylene diffusion flame by two-color laser-induced incandescence (2C-LII) technique and comparison with results from other optical diagnostics. Proc. Combust. Inst. 31(1):869–76. doi:10.1016/j.proci.2006.07.149.
- Geigle, K. P., M. Köhler, W. O’Loughlin, and W. Meier. 2015a. Investigation of soot formation in pressurized swirl flames by laser measurements of temperature, flame structures and soot concentrations. Proc. Combust. Inst. 35(3):3373–80. doi:10.1016/j.proci.2014.05.135.
- Geigle, K. P., W. O’Loughlin, R. Hadef, and W. Meier. 2015b. Visualization of soot inception in turbulent pressurized flames by simultaneous measurement of laser-induced fluorescence of polycyclic aromatic hydrocarbons and laser-induced incandescence, and correlation to OH distributions. Appl. Phys. B 119(4):717–30. doi:10.1007/s00340-015-6075-3.
- Geitlinger, H., T. H. Streibel, R. Suntz, and H. Bockhorn. 1999. Statistical analysis of soot volume fractions, particle number densities and particle radii in a turbulent diffusion flame. Combust. Sci. Technol. 149(1–6):115–34. doi:10.1080/00102209908952102.
- Hadef, R., K. P. Geigle, J. Zerbs, R. A. Sawchuk, and D. R. Snelling. 2013. The concept of 2D gated imaging for particle sizing in a laminar diffusion flame. Appl. Phys. B 112(3):395–408. doi:10.1007/s00340-013-5507-1.
- Ladommatos, N., and H. Zhao. 1994. A guide to measurement of flame temperature and soot concentration in diesel engines using the two-colour method. Part I: Principles. SAE International No. 941956. SAE Technical Paper.
- Leschowski, M., K. Thomson, D. Snelling, C. Schulz, and G. Smallwood. 2015. Combination of LII and extinction measurements for determination of soot volume fraction and estimation of soot maturity in non-premixed laminar flames. Appl. Phys. B 119(4):685–96. doi:10.1007/s00340-015-6092-2.
- Liu, F., J. Yon, A. Fuentes, P. Lobo, G. J. Smallwood, and J. C. Corbin. 2020. Review of recent literature on the light absorption properties of black carbon: Refractive index, mass absorption cross section, and absorption function. Aerosol Sci. Technol. 54(1):33–51. doi:10.1080/02786826.2019.1676878.
- Mansmann, R., T. Terheiden, P. Schmidt, J. Menser, T. Dreier, T. Endres, and C. Schulz. 2018. LIISim: A modular signal processing toolbox for laser-induced incandescence measurements. Appl. Phys. B 124(4):69. doi:10.1007/s00340-018-6934-9.
- Melton, L. A. 1984. Soot diagnostics based on laser heating. Appl. Opt. 23:2201–8. doi:10.1364/ao.23.002201.
- Michelsen, H. A. 2003. Understanding and predicting the temporal response of laser-induced incandescence from carbonaceous particles. J. Chem. Phys. 118(15):7012–45. doi:10.1063/1.1559483.
- Michelsen, H. A., F. Liu, B. F. Kock, H. Bladh, A. Boiarciuc, M. Charwath, T. Dreier, R. Hadef, M. Hofmann, J. Reimann, et al. 2007. Modeling laser-induced incandescence of soot: A summary and comparison of LII models. Appl. Phys. B 87(3):503–21. doi:10.1007/s00340-007-2619-5.
- Mulla, I. A., and B. Renou. 2019. Simultaneous imaging of soot volume fraction, PAH, and OH in a turbulent n-heptane spray flame. Combust. Flame 209:452–66. doi:10.1016/j.combustflame.2019.08.012.
- Narayanaswamy, V., and N. T. Clemens. 2013. Simultaneous LII and PIV measurements in the soot formation region of turbulent non-premixed jet flames. Proc. Combust. Inst. 34(1):1455–63. doi:10.1016/j.proci.2012.06.018.
- Ni, T., J. A. Pinson, S. Gupta, and R. J. Santoro. 1995. Two-dimensional imaging of soot volume fraction by the use of laser-induced incandescence. Appl. Opt. 34:7083–91. doi:10.1364/AO.34.007083.
- Olofsson, N.-E., J. Johnsson, H. Bladh, and P.-E. Bengtsson. 2013. Soot sublimation studies in a premixed flat flame using laser-induced incandescence (LII) and elastic light scattering (ELS). Appl. Phys. B 112(3):333–42. doi:10.1007/s00340-013-5509-z.
- Quay, B., T. W. Lee, T. Ni, and R. J. Santoro. 1994. Spatially resolved measurements of soot volume fraction using laser-induced incandescence. Combust. Flame 97(3–4):384–92. doi:10.1016/0010-2180(94)90029-9.
- Ramanathan, V., and G. Carmichael. 2008. Global and regional climate changes due to black carbon. Nat. Geosci. 1(4):221–7. doi:10.1038/ngeo156.
- Roussillo, M., P. Scouflaire, S. Candel, and B. Franzelli. 2019. Experimental investigation of soot production in a confined swirled flame operating under perfectly premixed rich conditions. Proc. Combust. Inst. 37(1):893–901. doi:10.1016/j.proci.2018.06.110.
- Schulz, C., B. F. Kock, M. Hofmann, H. Michelsen, S. Will, B. Bougie, R. Suntz, and G. Smallwood. 2006. Laser-induced incandescence: Recent trends and current questions. Appl. Phys. B 83(3):333–54. doi:10.1007/s00340-006-2260-8.
- Shaddix, C. R., and K. C. Smyth. 1996. Laser-induced incandescence measurements of soot production in steady and flickering methane, propane, and ethylene diffusion flames. Combust. Flame 107(4):418–52. doi:10.1016/S0010-2180(96)00107-1.
- Simonsson, J., A. Gunnarsson, M. N. Mannazhi, D. Bäckström, K. Andersson, and P. E. Bengtsson. 2019. In-situ soot characterization of propane flames and influence of additives in a 100 kW oxy-fuel furnace using two-dimensional laser-induced incandescence. Proc. Combust. Inst. 37(1):833–40. doi:10.1016/j.proci.2018.05.035.
- Snelling, D. R., G. J. Smallwood, F. Liu, Ö. L. Gülder, and W. D. Bachalo. 2005. A calibration-independent laser-induced incandescence technique for soot measurement by detecting absolute light intensity. Appl. Opt. 44:6773–85. doi:10.1364/AO.44.006773.
- Snelling, D. R., G. J. Smallwood, R. A. Sawchuk, W. S. Neill, D. Gareau, D. J. Clavel, W. L. Chippior, F. Liu, Ö. L. Gülder, and W. D. Bachalo. 2000. In-situ real-time characterization of particulate emissions from a diesel engine exhaust by laser-induced incandescence. SAE International.
- Sun, Z. W., Z. T. Alwahabi, D. H. Gu, S. M. Mahmoud, G. J. Nathan, and B. B. Dally. 2015a. Planar laser-induced incandescence of turbulent sooting flames: The influence of beam steering and signal trapping. Appl. Phys. B 119(4):731–43. doi:10.1007/s00340-015-6080-6.
- Sun, Z. W., D. H. Gu, G. J. Nathan, Z. T. Alwahabi, and B. B. Dally. 2015b. Single-shot, time-resolved planar laser-induced incandescence (TIRE-LII) for soot primary particle sizing in flames. Proc. Combust. Inst. 35 (3):3673–80. doi:10.1016/j.proci.2014.07.066.
- Sweeney, M. S., S. Hochgreb, M. J. Dunn, and R. S. Barlow. 2012a. The structure of turbulent stratified and premixed methane/air flames, Part I: Non-swirling flows. Combust. Flame 159(9):2896–911. doi:10.1016/j.combustflame.2012.06.001.
- Sweeney, M. S., S. Hochgreb, M. J. Dunn, and R. S. Barlow. 2012b. The structure of turbulent stratified and premixed methane/air flames, Part II: Swirling flows. Combust. Flame 159(9):2912–29. doi:10.1016/j.combustflame.2012.05.014.
- Tian, B., Y. Gao, S. Balusamy, and S. Hochgreb. 2015. High spatial resolution laser cavity extinction and laser-induced incandescence in low-soot-producing flames. Appl. Phys. B 120(3):469–87. doi:10.1007/s00340-015-6156-3.
- Tian, B., C. Zhang, Y. Gao, and S. Hochgreb. 2017. Planar 2-color time-resolved laser-induced incandescence measurements of soot in a diffusion flame. Aerosol Sci. Technol. 51(12):1345–53. doi:10.1080/02786826.2017.1366644.
- USEPA, I. S. A. f. P. M. 2008. External review draft, USEPA, I. S. A. f. P. M., ed. Washington, DC.
- Vander Wal, R. L. 1998. Calibration and comparison of laser-induced incandescence with cavity ring-down. Symp. Int. Combust. 27(1):59–67. doi:10.1016/S0082-0784(98)80390-1.
- Wainner, R. T., J. M. Seitzman, and S. R. Martin. 1999. Soot measurements in a simulated engine exhaust using laser-induced incandescence. AIAA Journal 37(6):738–43. doi:10.2514/2.782.
- Will, S., S. Schraml, K. Bader, and A. Leipertz. 1998. Performance characteristics of soot primary particle size measurements by time-resolved laser-induced incandescence. Appl. Opt. 37:5647–58. doi:10.1364/ao.37.005647.
- Will, S., S. Schraml, and A. Leipert. 1996. Comprehensive two-dimensional soot diagnostics based on laser-induced incandescence (LII). Symp. Int. Combust. 26(2):2277–84. doi:10.1016/S0082-0784(96)80055-5.
- Yon, J., J. J. Cruz, F. Escudero, J. Morán, F. Liu, and A. Fuentes. 2021. Revealing soot maturity based on multi-wavelength absorption/emission measurements in laminar axisymmetric coflow ethylene diffusion flames. Combust. Flame 227:147–61. doi:10.1016/j.combustflame.2020.12.049.
- Zhu, J., M. Y. Choi, G. W. Mulholland, and L. A. Gritzo. 2000. Measurement of soot optical properties in the near-infrared spectrum. Int. J. Heat Mass Transfer 43(18):3299–303. doi:10.1016/S0017-9310(99)00382-8.